
Abstract
Background:
The relation between the frequency of intermittently scanned continuous glucose monitoring (isCGM) and diurnal variation of time in range (TIR) and time below range (TBR) is unknown.
Method:
A total of 163 persons with type 1 diabetes who used isCGM had glucose data for 60 days downloaded. Mean TIR and median TBR were calculated for 15-minute periods and presented for daytime and nighttime. The values for tertiles of scanning frequency were compared.
Results:
The 1st tertile (n = 53) of the population scanned <10 times; the 2nd tertile (n = 56) 10-13 times, and the 3rd tertile (n = 54) >13 per 24 hours. TIR (%, mean ± (SD)) increased significantly from the 1st to the 3rd scan tertile both during the day (43.8 ± 14.8, 52.0 ± 12.3, 62.1 ± 12.8) and the night (44.5 ± 17.3, 52.3 ± 18.5, 64.0 ± 13.9; P < .0001). In contrast, TBR (median, (IQR)) was not significantly associated with scan tertiles during daytime (3.5% (1.1-7.8), 4.4% (1.8-6.1), 3.5% (2.1-6.1); P = .85) or nighttime (3.8% (1.4-13.7), 5.0% (1.6-9.6), 5.7% (3.6-10.9); P = .24). In a multiple regression model, a 50% increase in 24-hour scanning frequency was associated with a 7.8 percentage point increase in TIR (95% CI, 5.6-10.0).
Conclusions:
Increased scanning frequency was associated with a higher TIR both during daytime and nighttime with no change in TBR.
Keywords
Introduction
Intermittently scanned continuous glucose monitoring (isCGM) gives the patient unlimited access to information of instant interstitial glucose values by swiping a receiver unit in close proximity to a sensor on the upper arm. In addition, glucose data recorded every 15 minutes for the preceding 8 hours are presented graphically, and a trend arrow indicates if glucose is stable, rising, or falling.
So far, no official recommendation as to the optimal number of scans per day exists although observational data have shown a positive association between the frequency of scanning and a high time in range (TIR) and a low time below range (TBR).1,2 It remains unclear if this finding may be explained by the scanning frequency per se or indirectly by high motivation for diabetes self-care with a favorable impact on glycemic control unrelated to scanning frequency. Since scanning requires active patient participation, the number of scans per hour during the night is reduced to about 20% of daytime scans. 1 This causes the documented reduction of available glucose data in the late evening/early night since on some days, the period from the last scanning made before going to bed until the first scan in the morning scan exceeded 8 hours. 3
The aim of this study was to evaluate any association between scanning frequency, TIR and TBR during the day and night. We hypothesized that the positive association of an increased number of scans per 24 h and TIR is present mainly during the daytime but not at night due to a presumably very limited number of scans.
Methods
We had unrestricted access to isCGM (Freestyle, Libre, Abbott, Witney, UK) for adult patients with type 1 diabetes in our clinic. 4 We arbitrarily advised patients to scan more than 10 times per day. At each visit, glucose data were downloaded as an Excel file from the Diasend (Glooko Inc., Palo Alto, CA) platform. During the study period, the dedicated platform Libre-View had not yet been approved by the regional legal authorities and therefore did not meet the data protection requirements for communication between patients and healthcare professionals. From February through December 2019, glucose data were available for 169 persons with type 1 diabetes. Detailed analyses of glycemic metrics for this group have previously been reported. 3 We recorded the average number of daily scans at the time of the visit to the outpatient clinic. Six patients had missing information about scanning frequency; thus, 163 patients contributed to the present study. The average number of scans for 14, 30, and 90 days can be seen directly on the touch screen of the receiver unit. Patients were divided into tertiles based on their average number of daily scans during the 30 days preceding their visit at the clinic.
Glucose data for 60 days before the HbA1c measurement made prior to the visit in the clinic were downloaded. For each of the 15-min periods with available glucose values, we calculated the average of imported and scanned values (if any). The active CGM time (%) was the ratio of the number of 15-min periods with a minimum of one glucose value divided by the maximal possible periods (5,760 = 60 × 24 × 4) multiplied by 100. TIR was calculated as the number of periods with an average glucose value in the range from 3.9 to 10.0 mmol/l divided by the total number of periods with at least one glucose value multiplied by 100. TBR (glucose <3.9 mmol/l) was calculated similarly. Glycemic variability is presented as the coefficient of variation (CV%) calculated as the standard deviation of the 15-min glucose average divided by the mean value multiplied by 100. Active CGM time, TBR, and TIR were calculated for 24-hour, daytime (06:00 a.m.-11:59 p.m.) and nighttime (00:00 a.m.-05:59 a.m.).
Statistical Analysis
Data are presented as mean ± standard deviation (SD) except for TBR and active CGM time, which was not normally distributed and therefore given as median and interquartile range (IQR). Mean glucose (mean of 15-min averages) was calculated using the R-package Flux. The contribution of the frequency of scanning to the variation of TIR and TBR was assessed by multiple linear regression with scan rate, method for insulin delivery (multiple daily injections (MDI) or continuous subcutaneous infusion (CSII)), age, gender, diabetes duration, and duration with Freestyle Libre as independent variables. One-way analysis of variance (ANOVA) and chi-squared test were applied for comparing scanning tertiles, except for TBR (Kruskal–Wallis test). In case of a significant analysis of variance, tertiles were compared using unpaired t test or chi-squared as applicable. The SPSS ver. 20.0 and R ver. 3.4.1 were used.
Results
The distribution of gender, age, diabetes duration, insulin delivery modality, and glycemic metrics is shown in Table 1. The persons in the 3rd scanning frequency tertile were younger and showed a female preponderance. A clear progressive increase in TIR from the 1st to the 3rd scanning tertile was recorded. Daytime TIR for the 2nd scanning tertile was significantly higher than the corresponding value for the first tertile: 8.3% (95% CI, 3.3-13.3, P = .0014), and daytime TIR for the 3rd tertile was significantly higher than that of the second tertile: 10.1% (5.0-15.1, P = .001). Similar data were recorded for nighttime TIR; 7.9% (1.6-14.2, P = .0149) and 11.7% (5.4-18.0, P = .0004), respectively. CV was significantly lowerfor the 3rd tertile than for the 1st tertile: −3.3% (−5.8 to −0.8, P = .01). In contrast, TBR did not vary significantly with scanning level. Accordingly, TAR was lower with increased scan rate. Figure 1 illustrates the diurnal variation of TIR, TBR, and glucose separately for each scanning frequency tertile.
Clinical Characteristics and 60-Day Glycemic Metrics for 163 Individuals with Type 1 Diabetes by Scanning Frequency Tertiles. Distribution Is Presented as Median (Range), mean ± SD or Median (IQR).
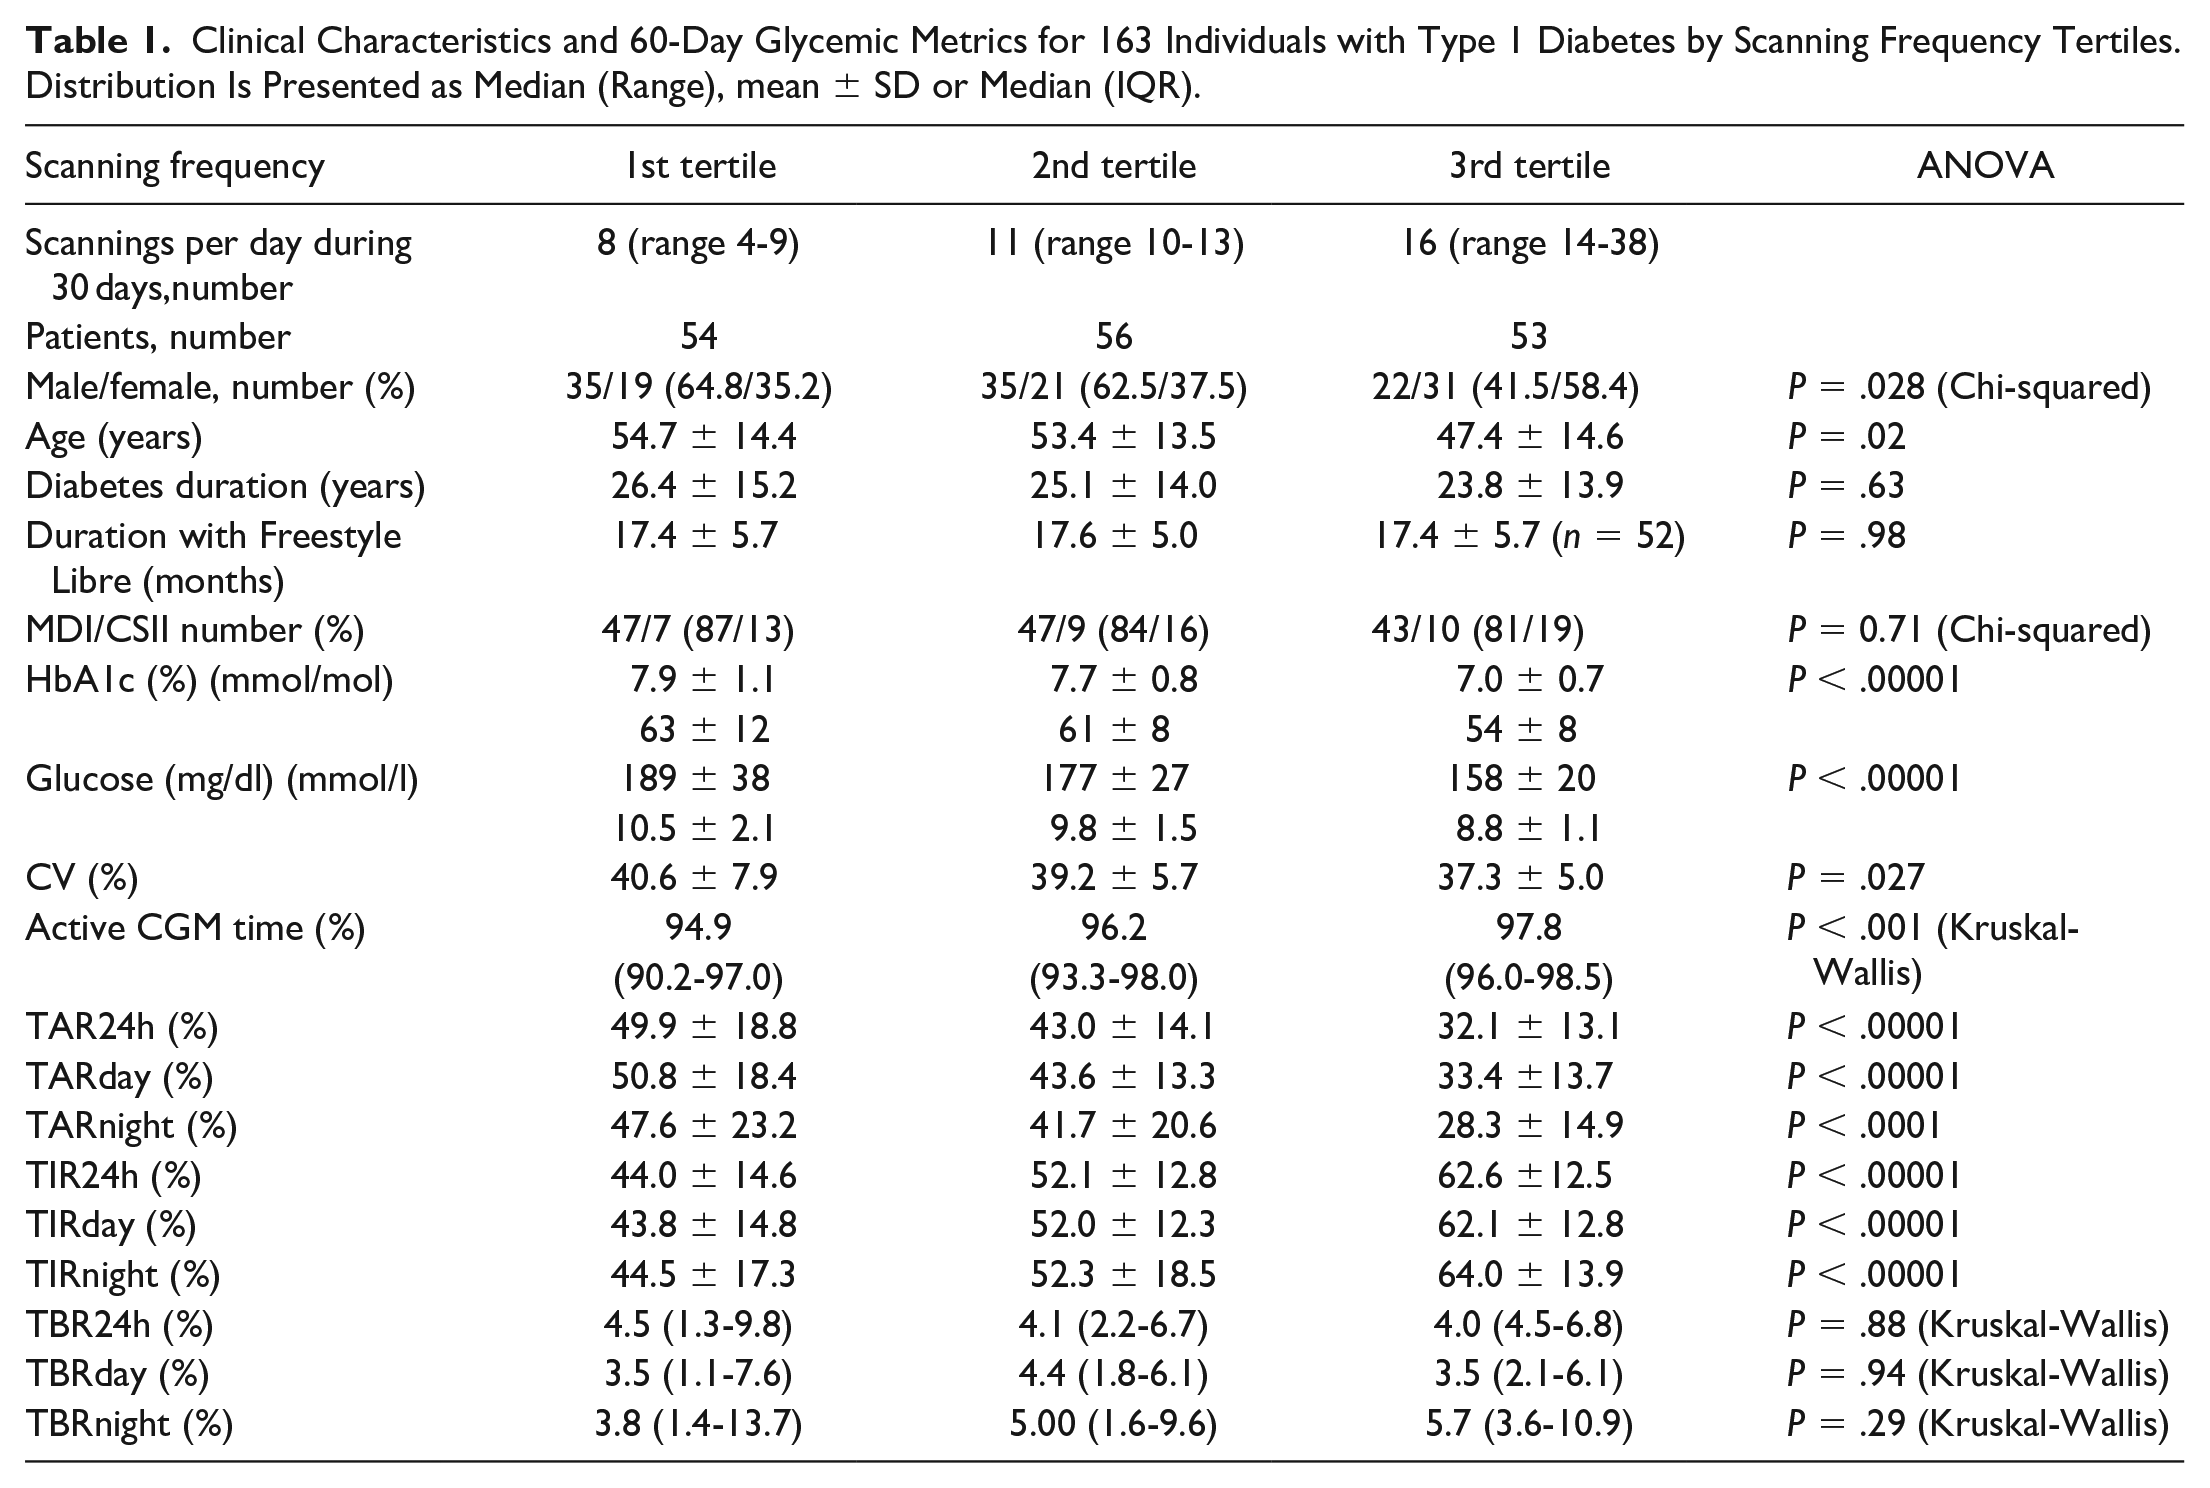
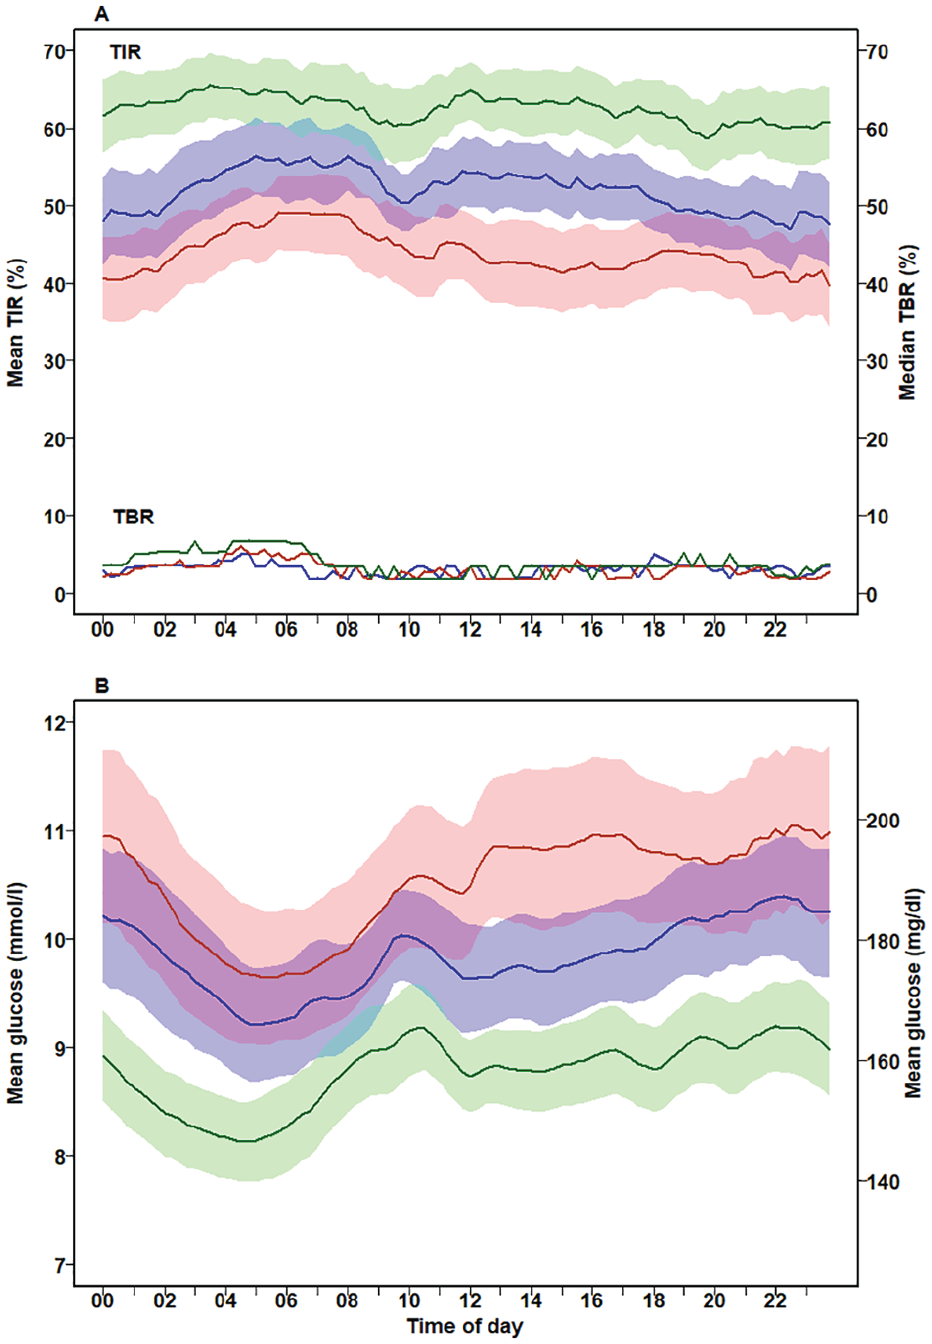
Diurnal variation of the mean TIR and median TBR (A) and mean glucose (B) from 163 individuals with type 1 diabetes by scanning frequency tertiles. Data are presented for each 15-minute period from to 00:00-00:14 to 23:45-23:59. Red lines, 1st tertile (<10 scans per day); blue line, 2nd tertile (10-13 scans per day); green line. 3rd tertile (>13 scans per day). The same color code applies to the shaded areas for TIR and glucose which represents the 95% CI of the mean. Due to considerable overlap and for the sake of clarity, no confidence interval is given for TBR.
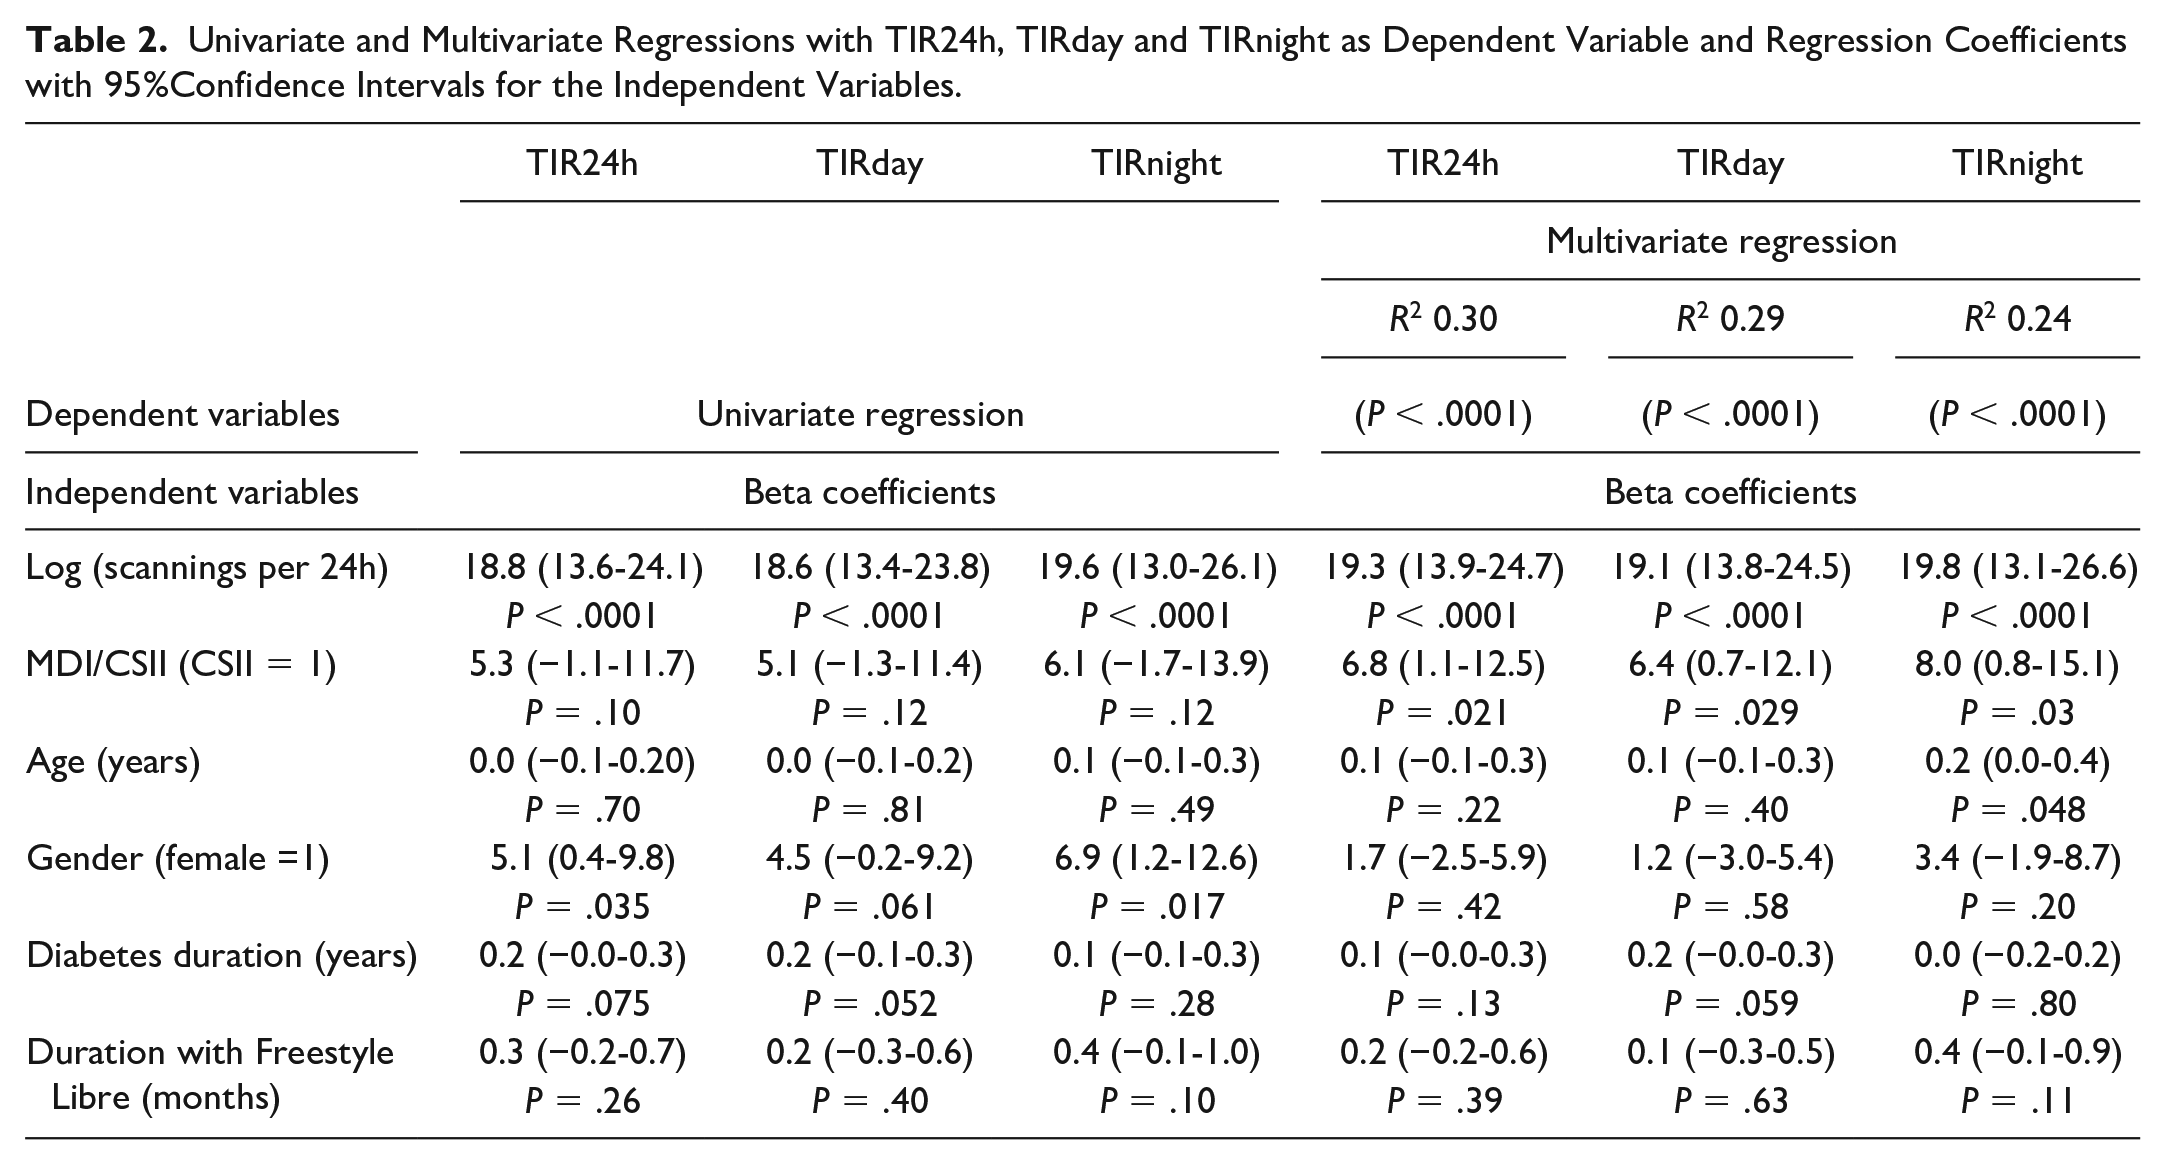
We performed univariate and multiple linear regression with TIR and TBR as the dependent variable and scanning frequency (continuous data), age, gender, diabetes duration, and treatment modality (MDI/CSII) as independent variables (Table 2). In the univariate analysis, TIR24h was significantly associated with log(scan per 24 hours): TIR24h = 18.84 × log(scan) + 7.25 (P < .0001) (Figure 2). For TIR24h, the number of scans and insulin delivery modality independently contributed to the model (R2 0.30 P < .0001), with an unstandardized regression coefficient of 19.3 (95% CI 13.9-24.7, P < .0001) for log(scan per 24 hours) and 6.8 (95% CI 1.1-12.5, P = .03) for CSII as compared to MDI. Similar results were found for TIRday and TIRnight except for a statistically significant but modest positive contribution of age for TIRnight (Table 2). It follows that a 50% increase in the number of daily scans is associated with an increase in TIR24h of 7.8 (=(log(1.5) × 19.3) percentage points, 95% CI (5.6-10.0).
Univariate and Multivariate Regressions with TIR24h, TIRday and TIRnight as Dependent Variable and Regression Coefficients with 95%Confidence Intervals for the Independent Variables.
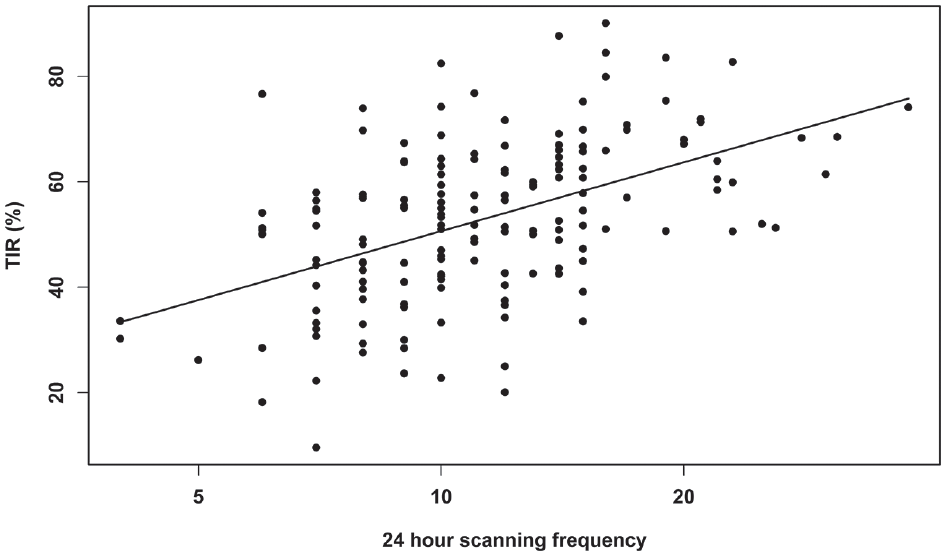
Univariate regression of TIR24h against 24-hour scanning frequency (log scale).
None of the independent variables significantly influenced the variation of TBR24h, TBRday, or TBRnight (R2 0.02, P = .75; 0.035, P = .47; 0.02, respectively; P = .89).
The fraction of patients with a TIR24h >70% was 3.7% (2 of 54 persons) for the 1st scanning rate tertile, 7.1% (4 of 56) for the 2nd tertile, and 22.6% (12 of 54 patients) for the 3rd tertile (P = .004).
Discussion
This study supports the concept of “the more the better” with regard to the association between the number of daily scans and glycemic metrics.1,2 We extend the findings of previous large international studies by demonstrating a strong positive association between the frequency of scans and TIR both at night and in the daytime. Furthermore, in contrast to these studies, we present information about gender, age, diabetes duration, period with Freestyle Libre scanner, and insulin delivery modality. TIR correlated with the number of scans even when correcting for these potential confounders. A 50% increase in the number of daily scans was associated with an increase in TIR of ≈8 percentage points. Notably, this is an association and not just an indication that a patient will necessarily obtain this benefit by increasing his or her number of scans.
As with other studies, including self-measurement of blood glucose (SMBG) by fingerprick, this study does not allow us to disentangle the effect of frequent measurements per se from a higher level of motivation for diabetes self-care. 5 Presumably, a higher number of scans goes hand in hand with other aspects of a high motivation for diabetes self-care such as carbohydrate counting, correct timing of bolusinsulin prior to meals, correction of hypo- and hyperglycemia, and so on.
The association of a high scan rate with a higher TIR also at night (with presumably few or no scans) seems paradoxical but may, in part, reflect good glycemic control in the late evening. Furthermore, patients with many scans may be more likely to study the retrospective nocturnal glucose curve and make wise decisions for improvements in the future. Thus, our hypothesis that the number of scans was associated with a high TIR mainly during day time could not be verified.
It is striking that patients belonging to the 2nd and 3rd scan tertile per day recordedprogressively lower TARday and TARnight (about 6-13 percentage points per tertile) and progressively higherTIRday and TIRnight (about 8-10 percentage points per tertile) without increasing TBR significantly. People with frequent scans are more likely to identify changing glucose values and to take action. This may explain the association of scanning rate with reduced glycemic variability.
Notably, even for patients in the highest scan tertile (a median of 16 scans per 24 h), the fraction of patients with a TIR above 70% was low. It seems that for a population of patients mainly using MDI or CSII without rtCGM, there is an upper limit for achievable TIR which clearly falls below the optimal 70% level.6,7
Surprisingly, few studies have reported specific advice to patients in regard to the minimum number of scans. Furthermore, the advice given varies from ≥4 8 to > 69,10 or ≥ 10 scans per day. 4 The mean number of scans actually performed was 15.1 per day in a randomized study describing reduction of TBR in well-controlled patients with isCGM as compared to SMBG. 11 Observational studies have shown a reduction in HbA1c after switching from SMBG to isCGM by 8.8 or 11 scans per day.12,13 In contrast, the number of scans achieved was much lower (3.5 per day) in a study reporting no significant effect of glycemic metrics in youth with a high baseline HbA1c. 14 A large-scale observational study from Belgium (9.7 scans per day) found no significant association between scan frequency and change in HbA1c although both baseline and follow-up HbA1c correlated negatively with scan frequency. 8 The authors’ interpretation was that motivation may be more important than scan frequency per se. Furthermore, patients with a high scan rate presumably also performed a high number of SMGM before initiating the study. We and others have previously reported that scanning rate correlated negatively not only with final HbA1c after switching from SMBG to isCGM but also with baseline HbA1c before introducing isCGM.4,12
When a patient decides to scan, an active desire exists to obtain information about the actual glucose value in order to take action if necessary in contrast to the passive flow of glucose data in rtCGM which may pass unrecognized. On the other hand, hypo- and hyperglycemic alerts are options with rtCGM, although “alarm fatigue” is a well-known condition. It remains unknown if newer generations of isCGM with alarms are non-inferior to rtCGM with respect to minimizing hypoglycemic events and TBR.
It is a limitation of the present study that we have no information about the time points during the 24-hour period at which scannings were made. The software platform Libre-View used to download data from the equipment includes time stamps for identification of the scanned values and separation of these from imported values. This, however, is not an option when data are downloaded using the Diasend platform as was the case in the present study.
Conclusions
A high scanning frequency was associated with a high TIR both during daytime and nighttime without increasing TBR. The number of scans should be as high as possible without inducing psychological distress, and at least 14 scans per day may be recommended.
Footnotes
Acknowledgements
We thank statistician Aparana Udupi, Biostatistical Advisory Service, Faculty of Health, Aarhus University, Denmark, for preparation of data for statistical analysis.
Abbreviations
CSII, continuous subcutaneous infusion; isCGM, intermittently scanned continuous glucose monitoring; MDI, multiple daily injections; rtCGM, real time continuous glucose monitoring; SMBG, self-measurement of blood glucose; TBR, time below range; TIR, time in range.
Declaration of Conflicting Interests
The author(s) declared no potential conflicts of interest with respect to the research, authorship, and/or publication of this article.
Funding
The author(s) disclosed receipt of the following financial support for the research, authorship, and/or publication of this article: The study was financially supported by Rosa and Asta Jensen foundation, which did not have any influence on the study