
Abstract
Background:
The I-HART CGM study has shown that real-time continuous glucose monitoring (rtCGM) has greater beneficial impact on hypoglycemia than intermittently scanned continuous glucose monitoring (iscCGM) in adults with type 1 diabetes at high risk (Gold score ≥4 or recent severe hypoglycemia using insulin injections). In this subanalysis, we present the impact of rtCGM and iscCGM on glycemic variability (GV).
Methods:
Forty participants were recruited to this parallel group study. Following two weeks of blinded rtCGM (DexcomG4), participants were randomized to rtCGM (Dexcom G5; n = 20) or iscCGM (Freestyle Libre; n = 20) for eight weeks. An open-extension phase enabled participants on rtCGM to continue for a further eight weeks and those on iscCGM to switch to rtCGM over this period. Glycemic variability measures at baseline, 8- and 16-week endpoints were compared between groups.
Results:
At the eight-week endpoint, between-group differences demonstrated significant reduction in several GV measures with rtCGM compared to iscCGM (GRADE%hypoglycemia, index of glycemic control [IGC], and average daily risk range [ADRR]; P < .05). Intermittently scanned continuous glucose monitoring reduced mean average glucose and glycemic variability percentage and GRADE%hyperglycemia compared with rtCGM (P < .05). At 16 weeks, the iscCGM group switching to rtCGM showed significant improvement in GRADE%hypoglycemia, personal glycemic status, IGC, and ADRR.
Conclusion:
Our data suggest most, but not all, GV measures improve with rtCGM compared with iscCGM, particularly those measures associated with the risk of hypoglycemia. Selecting appropriate glucose monitoring technology to address GV in this high-risk cohort is important to minimize the risk of glucose extremes and severe hypoglycemia.
Clinical trial registration:
ClinicalTrials.gov NCT03028220
Keywords
Introduction
Glycemic variability (GV) reflects hypo- and hyperglycemic excursions and can be quantified from glucose profiles in people with type 1 diabetes mellitus (T1DM). 1 Glycated haemoglobin (HbA1c), the standard for assessing glycemic control, reflects average blood glucose levels over one to three months prior to testing and may not completely represent daily blood glucose fluctuations, particularly metrics associated with risk. 2 Individuals with similar HbA1c values may have markedly different daily glycemic profiles, with differences in the magnitude and number of glucose excursions. Furthermore, even individuals with HbA1c levels close to target report the variation in blood glucose levels with postprandial hyperglycemia and significant exposure to hypoglycemia.
Glycemic variability can define within- and between-day glucose variability and includes both periods of hyper- and hypoglycemia.2,3 Broadly, GV can be subdivided into two subcategories. First, glycemic measures can be based on glucose distribution (eg, standard deviation [SD], coefficient of variation [CV], mean amplitude of glycemic excursions [MAGE], continuous overall net glycemic action [CONGA], mean of daily differences [MODD], lability index [LI], glycemic variability percentage [GVP], and mean absolute glucose change per unit time [MAG]). Second, the measures can be based on risk and quality of glycemic control (eg, glycemic risk assessment diabetes equation [GRADE], M-value, average daily risk range [ADRR], J-index, personal glycemic status [PGS], index of glycemic control [IGC], risk index [RI], low blood glucose index [LBGI], and high blood glucose index [HBGI]). 2 A description of various measures, with formulae used for their calculations, and a critical review of their limitations have been previously reported.1,4
Risk-based GV measures are associated with frequency and severity of hypoglycemia, 5 while in vitro and in vivo data suggest that GV is as an independent risk factor for total mortality and death due to cardiovascular disease in both type 1 and type 2 diabetes.6-8
The burden of hypoglycemia in adults with T1DM is significant and is associated with mortality and morbidity. 9 The mean incidence of mild (self-treated) hypoglycemia is one to two episodes per person per week and severe hypoglycemia (requiring third-party assistance for recovery) is 0·2-3·2 events per person annually. 10 Nocturnal hypoglycemia accounts for approximately half of severe hypoglycemic events and is a source of hypoglycemia fear. 11 Recurrent hypoglycemia is associated with the impaired awareness of hypoglycemia which affects approximately 20% of adults with T1DM 12 and is associated with a sixfold higher risk of severe hypoglycemia in people with impaired awareness.12,13
To support diabetes management, real-time continuous glucose monitoring (rtCGM) provides real-time feedback on glucose values and glucose trends. Additionally, it provides alerts and alarms for impending hypo- and hyperglycemia, and times of rapid glucose change. Real-time continuous glucose monitoring improves glycemic control, reduces HbA1c, 14 and reduces exposure to hypoglycemia 2 in people using multiple dose injection (MDI) regimens and continuous insulin infusions.15-17 In addition, rtCGM reduces hypoglycemic events compared to self-monitoring blood glucose (SMBG) in people with impaired hypoglycemia awareness.18,19
Intermittently scanned continuous glucose monitoring (iscCGM) is a factory calibrated sensor which when scanned displays glucose concentrations and trend along with up to eight hours of preceding glucose data. Intermittently scanned continuous glucose monitoring has been shown to reduce time spent in hypoglycemia in people with T1DM and an HbA1c close to target. 20 Both glucose monitoring techniques enable individuals to utilize glucose data to minimize GV and optimize the management of T1DM.
We undertook the first head-to-head randomized study to compare the impact of iscCGM and continuous glucose monitoring in people with T1DM at highest risk of hypoglycemia. We have previously shown a significantly greater reduction in percentage time spent in hypoglycemia in the rtCGM group compared with the iscCGM group over eight weeks. 21 Furthermore, with subsequent switching from iscCGM to rtCGM, a beneficial impact on hypoglycemia outcomes were seen, and continued use of rtCGM maintained the hypoglycemia risk benefit in this high-risk population. 22 In this predefined secondary analysis, we present the impact of iscCGM and rtCGM on GV measures and hypoglycemic excursions in this high-risk group.
Participants and Methods
The study was approved by the NHS Research Ethics Committee, United Kingdom. All participants provided verbal and written-informed consent. The study was an investigator-initiated randomized, unmasked parallel group study conducted at a single specialist site in the United Kingdom.
Screening and Participants
The study design has previously been described 21 and is summarized in Figure 1. Briefly, adults with T1DM for greater than three years using an intensified MDI regimen for over six months were recruited. All participants had experienced a severe hypoglycemic event within the last 12 months requiring third-party assistance or had a Gold score of greater than or equal to 4. All individuals had received structured education either as group or in a one to one environment from a specialist educator.
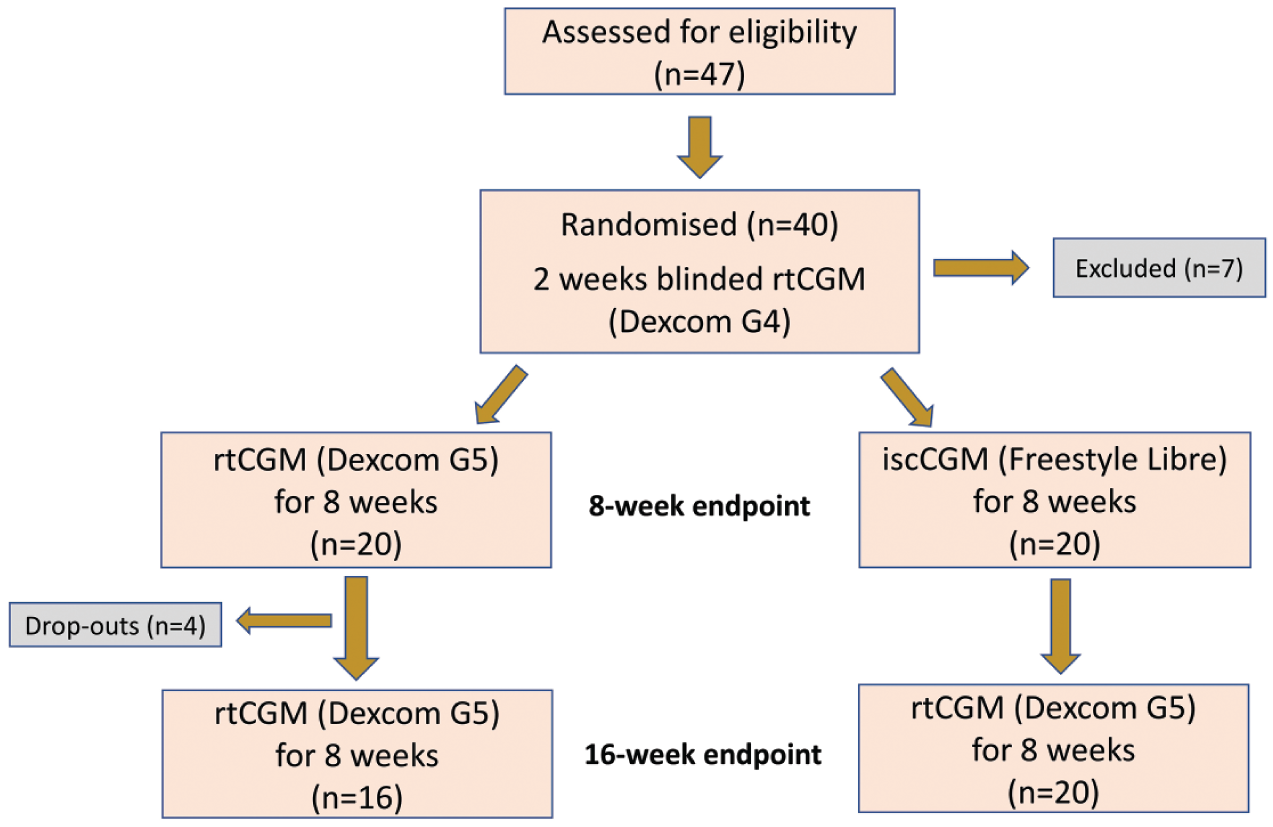
Study design and participant recruitment.
Baseline Participant Characteristics
A total of 40 participants were included: 24 males and 16 females. Baseline demographics have been summarized in Table 1 and previously reported in Reddy et al. 21
Baseline Characteristics for All Study Participants.
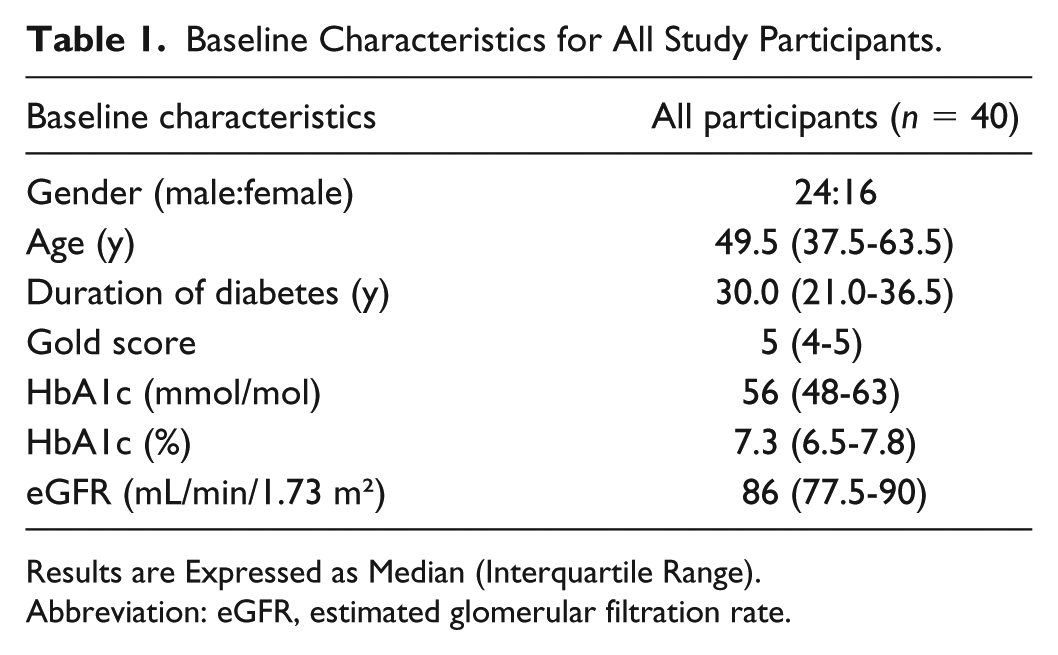
Results are Expressed as Median (Interquartile Range).
Abbreviation: eGFR, estimated glomerular filtration rate.
Procedures
All participants were commenced on blinded rtCGM (Dexcom G4, San Diego, CA, United States) for a two-week run-in phase. Calibration to capillary blood glucose was carried out a minimum of twice daily. From this, the baseline data were calculated. Participants were then randomized to rtCGM (Dexcom G5) or iscCGM (Abbott Freestyle Libre) in a 1:1 ratio by an online randomization tool (www.sealedenvelope.com). The treatment period was eight weeks. Both the rtCGM and iscCGM systems were used nonadjunctively in accordance with product licenses. After eight weeks, participants using iscCGM were switched to the Dexcom G5, and those using Dexcom G5 were offered the opportunity to continue with the Dexcom G5 for a further eight-week period.
Low glucose alert settings for rtCGM were standardized at 4.4 mmol/L (79 mg/dL) for all participants at the start of the study and were then reduced to 4.0 mmol/L (72 mg/dL) at week 2 depending on participant preference. High glucose alerts were initially set at >11.1 mmol/L (200 mg/dL), but could later be personalized.
Outcomes
Glucose variability measures at baseline and at eight weeks were analyzed for rtCGM and for iscCGM from the last 28 days of data for each treatment period. Within-group changes from baseline and between-group differences in the change from baseline were assessed. In addition, the number of hypoglycemic episodes were analyzed and have been reported by week. Each episode of hypoglycemia was defined based on a minimum duration of 20 minutes and a separation time of 15 minutes. Glucose thresholds of <3.0 mmol/L (54 mg/dL) and <3.9 mmol/L (70 mg/dL) were measured.
Glycemic Variability
Measures of GV were computed using EasyGV (v10.0) software. Evaluated GV measures are SD, CV, MAGE, CONGA, MODD, LI, MAG, GVP, PGS, M-value, IGC, RI, GRADE, ADRR, J-index, HBGI, and LBGI. Glycemic risk assessment diabetes equation score is also reported as GRADE%hypoglycemia, GRADE%euglycemia, and GRADE%hyperglycemia representing percentages of GRADE scores attributable to glucose values <3.9 mmol/L (<70 mg/dL), and between 3.9 to 7.8 mmol/L (70-140 mg/dL) and >7.8 mmol/L (>140 mg/dL), respectively. Times in range and in hypoglycemia, and LBGI have been previously published. 21 LBGI has been included in this paper as a GV measure for comparison purposes.
Statistical Analysis
Nonparametric tests (the Wilcoxon Rank sum test) were used to compare between rtCGM and iscCGM on the change from baseline to eight weeks in the intervention arms, while the Wilcoxon-matched pairs signed-rank was used for the analysis of within-group differences in each of the arms. Data are presented as medians (interquartile ranges, IQRs), unless otherwise stated. Statistical tests were two tailed, and for descriptive and exploratory analyses, a significance level of P < .05 was adopted. Statistical tests were performed using Stata. The power calculation was based on the primary outcome. 21 Glycemic variability measures were secondary outcomes and the study was not powered to detect statistical differences in secondary outcomes between groups.
Results
Measures of GV and Glycemic Control at Baseline
Baseline medians and IQR for several measures of GV were analyzed for 40 adults with T1DM as shown in Table 2. At baseline, there were no significant differences within the GV indices between the continuous and iscCGM groups
Medians (and Interquartile Range) at Baseline for Glycemic Variability Measures and Associated Median Change From Baseline to Eight Weeks for Real-Time Continuous Glucose Monitoring and Intermittently Scanned Continuous Glucose Monitoring (Measures Calculated in mmol/L).
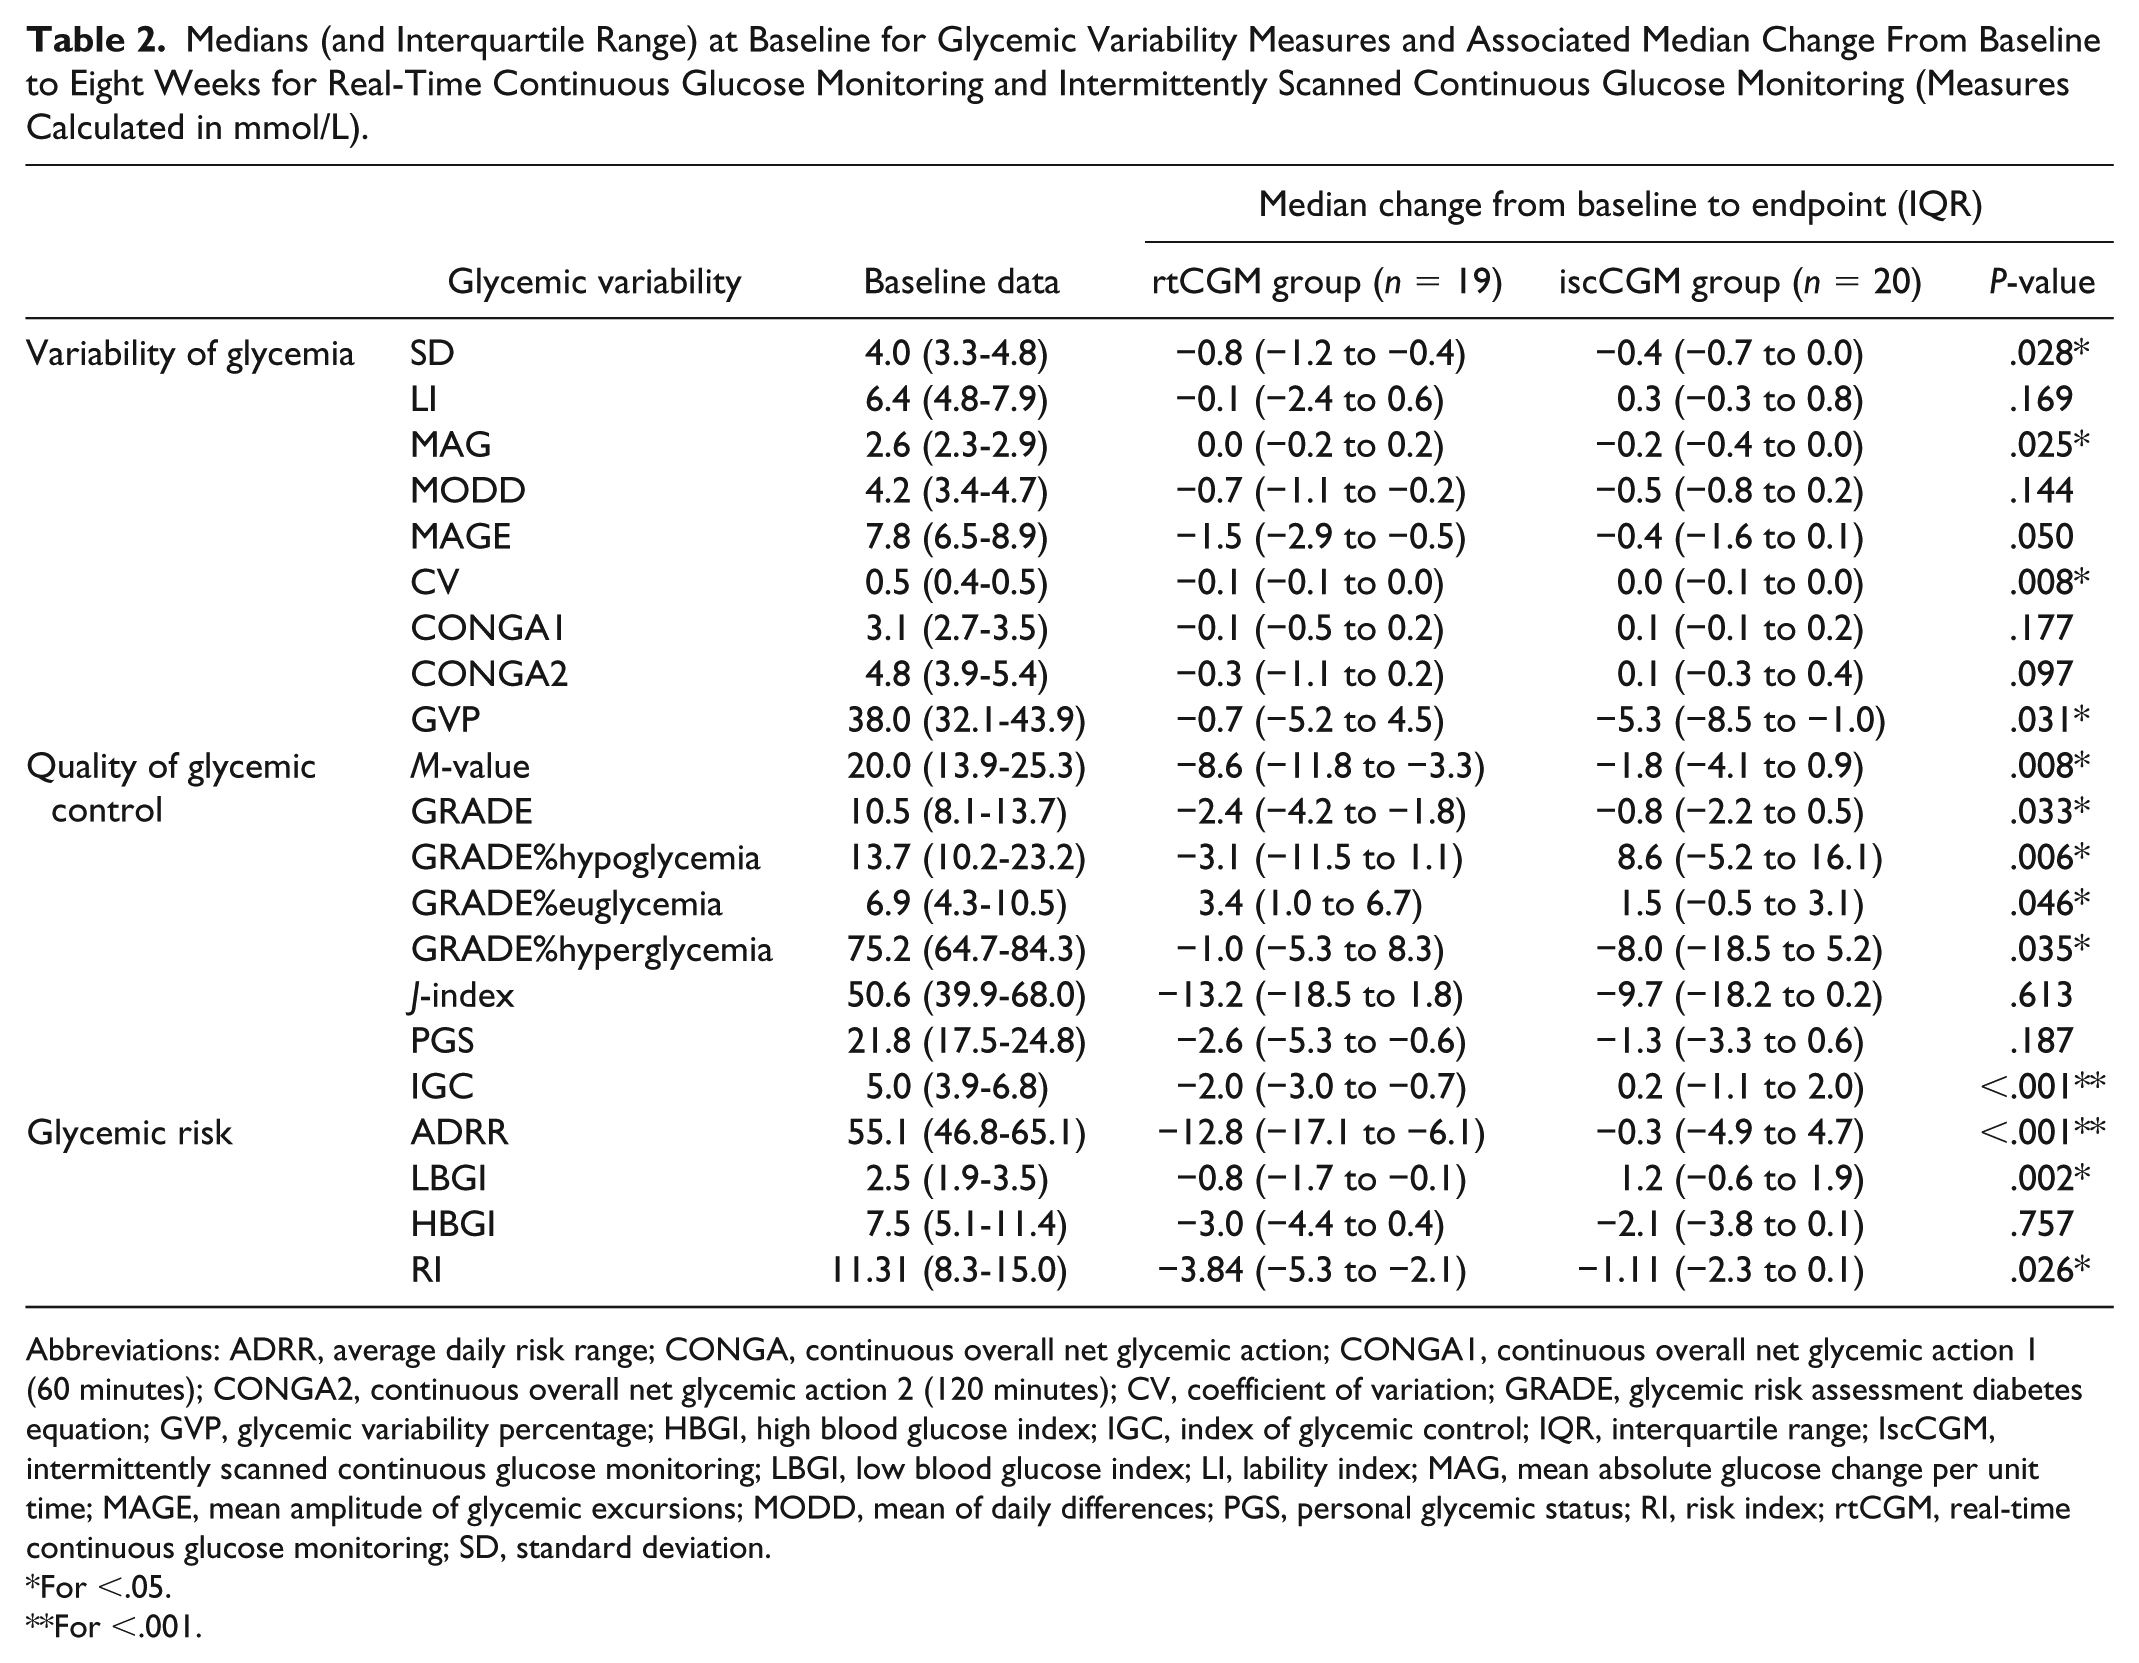
Abbreviations: ADRR, average daily risk range; CONGA, continuous overall net glycemic action; CONGA1, continuous overall net glycemic action 1 (60 minutes); CONGA2, continuous overall net glycemic action 2 (120 minutes); CV, coefficient of variation; GRADE, glycemic risk assessment diabetes equation; GVP, glycemic variability percentage; HBGI, high blood glucose index; IGC, index of glycemic control; IQR, interquartile range; IscCGM, intermittently scanned continuous glucose monitoring; LBGI, low blood glucose index; LI, lability index; MAG, mean absolute glucose change per unit time; MAGE, mean amplitude of glycemic excursions; MODD, mean of daily differences; PGS, personal glycemic status; RI, risk index; rtCGM, real-time continuous glucose monitoring; SD, standard deviation.
For <.05.
For <.001.
Run-in vs Eight Weeks: rtCGM vs iscCGM
At the eight-week endpoint, in the rtCGM group, outcomes derived from rtCGM data were analyzed in 19 participants, following the loss of rtCGM data for one participant due to an uploading error. All data were analyzed in the iscCGM group (n = 20).
The analysis of between-group differences demonstrates significant reduction in several GV measures with rtCGM compared to iscCGM (Table 2). Statistically significant between-group differences were observed with a reduction in the rtCGM group in SD, CV, M-value, GRADE%hypoglycemia, IGC, ADRR, RI, and LBGI compared with iscCGM (P < .05). These measures predominantly reflect the risk and quality of glycemic control.
In contrast, iscCGM was associated with a greater reduction in MAG and GVP (ie, measures of variability of glycemia) and GRADE%hyperglycemia compared with rtCGM (P < .05).
Eight vs 16 Weeks: Effect of Switching to rtCGM for Both Groups
All participants in the iscCGM group were analyzed following the switch to rtCGM (n = 20). Within the rtCGM group, five participants were excluded from the analysis of this phase (n = 15). One participant failed to upload eight-week data (uploading error), two decided not to participate in the second treatment period (one due to work commitments and the other gave no reason), one participant lost the transmitter during the treatment period without informing the study team, and one participant did not comply with the study protocol and was excluded from the study.
No statistical change in those continuing on rtCGM for a further eight weeks was observed in any of the glycemic indices (Appendix S1). However, participants in the iscCGM group switching to rtCGM showed a significant improvement in SD, CV, M-value, GRADE, GRADE%hypoglycemia, J-index, PGS, IGC, ADRR, RI, and LBGI (<.05; Table 3). The switch from iscCGM to rtCGM was associated with an overall increased MAG, GVP, HBGI, and GRADE%hyperglycemia (P < .001).
Medians (and Interquartile Range) for Intermittently Scanned Continuous Glucose Monitoring Group Switched to Real-Time Continuous Glucose Monitoring Between 8 and 16 Weeks and Outcomes on Each Glycemic Variability Measure (Measures Calculated in mmol/L).
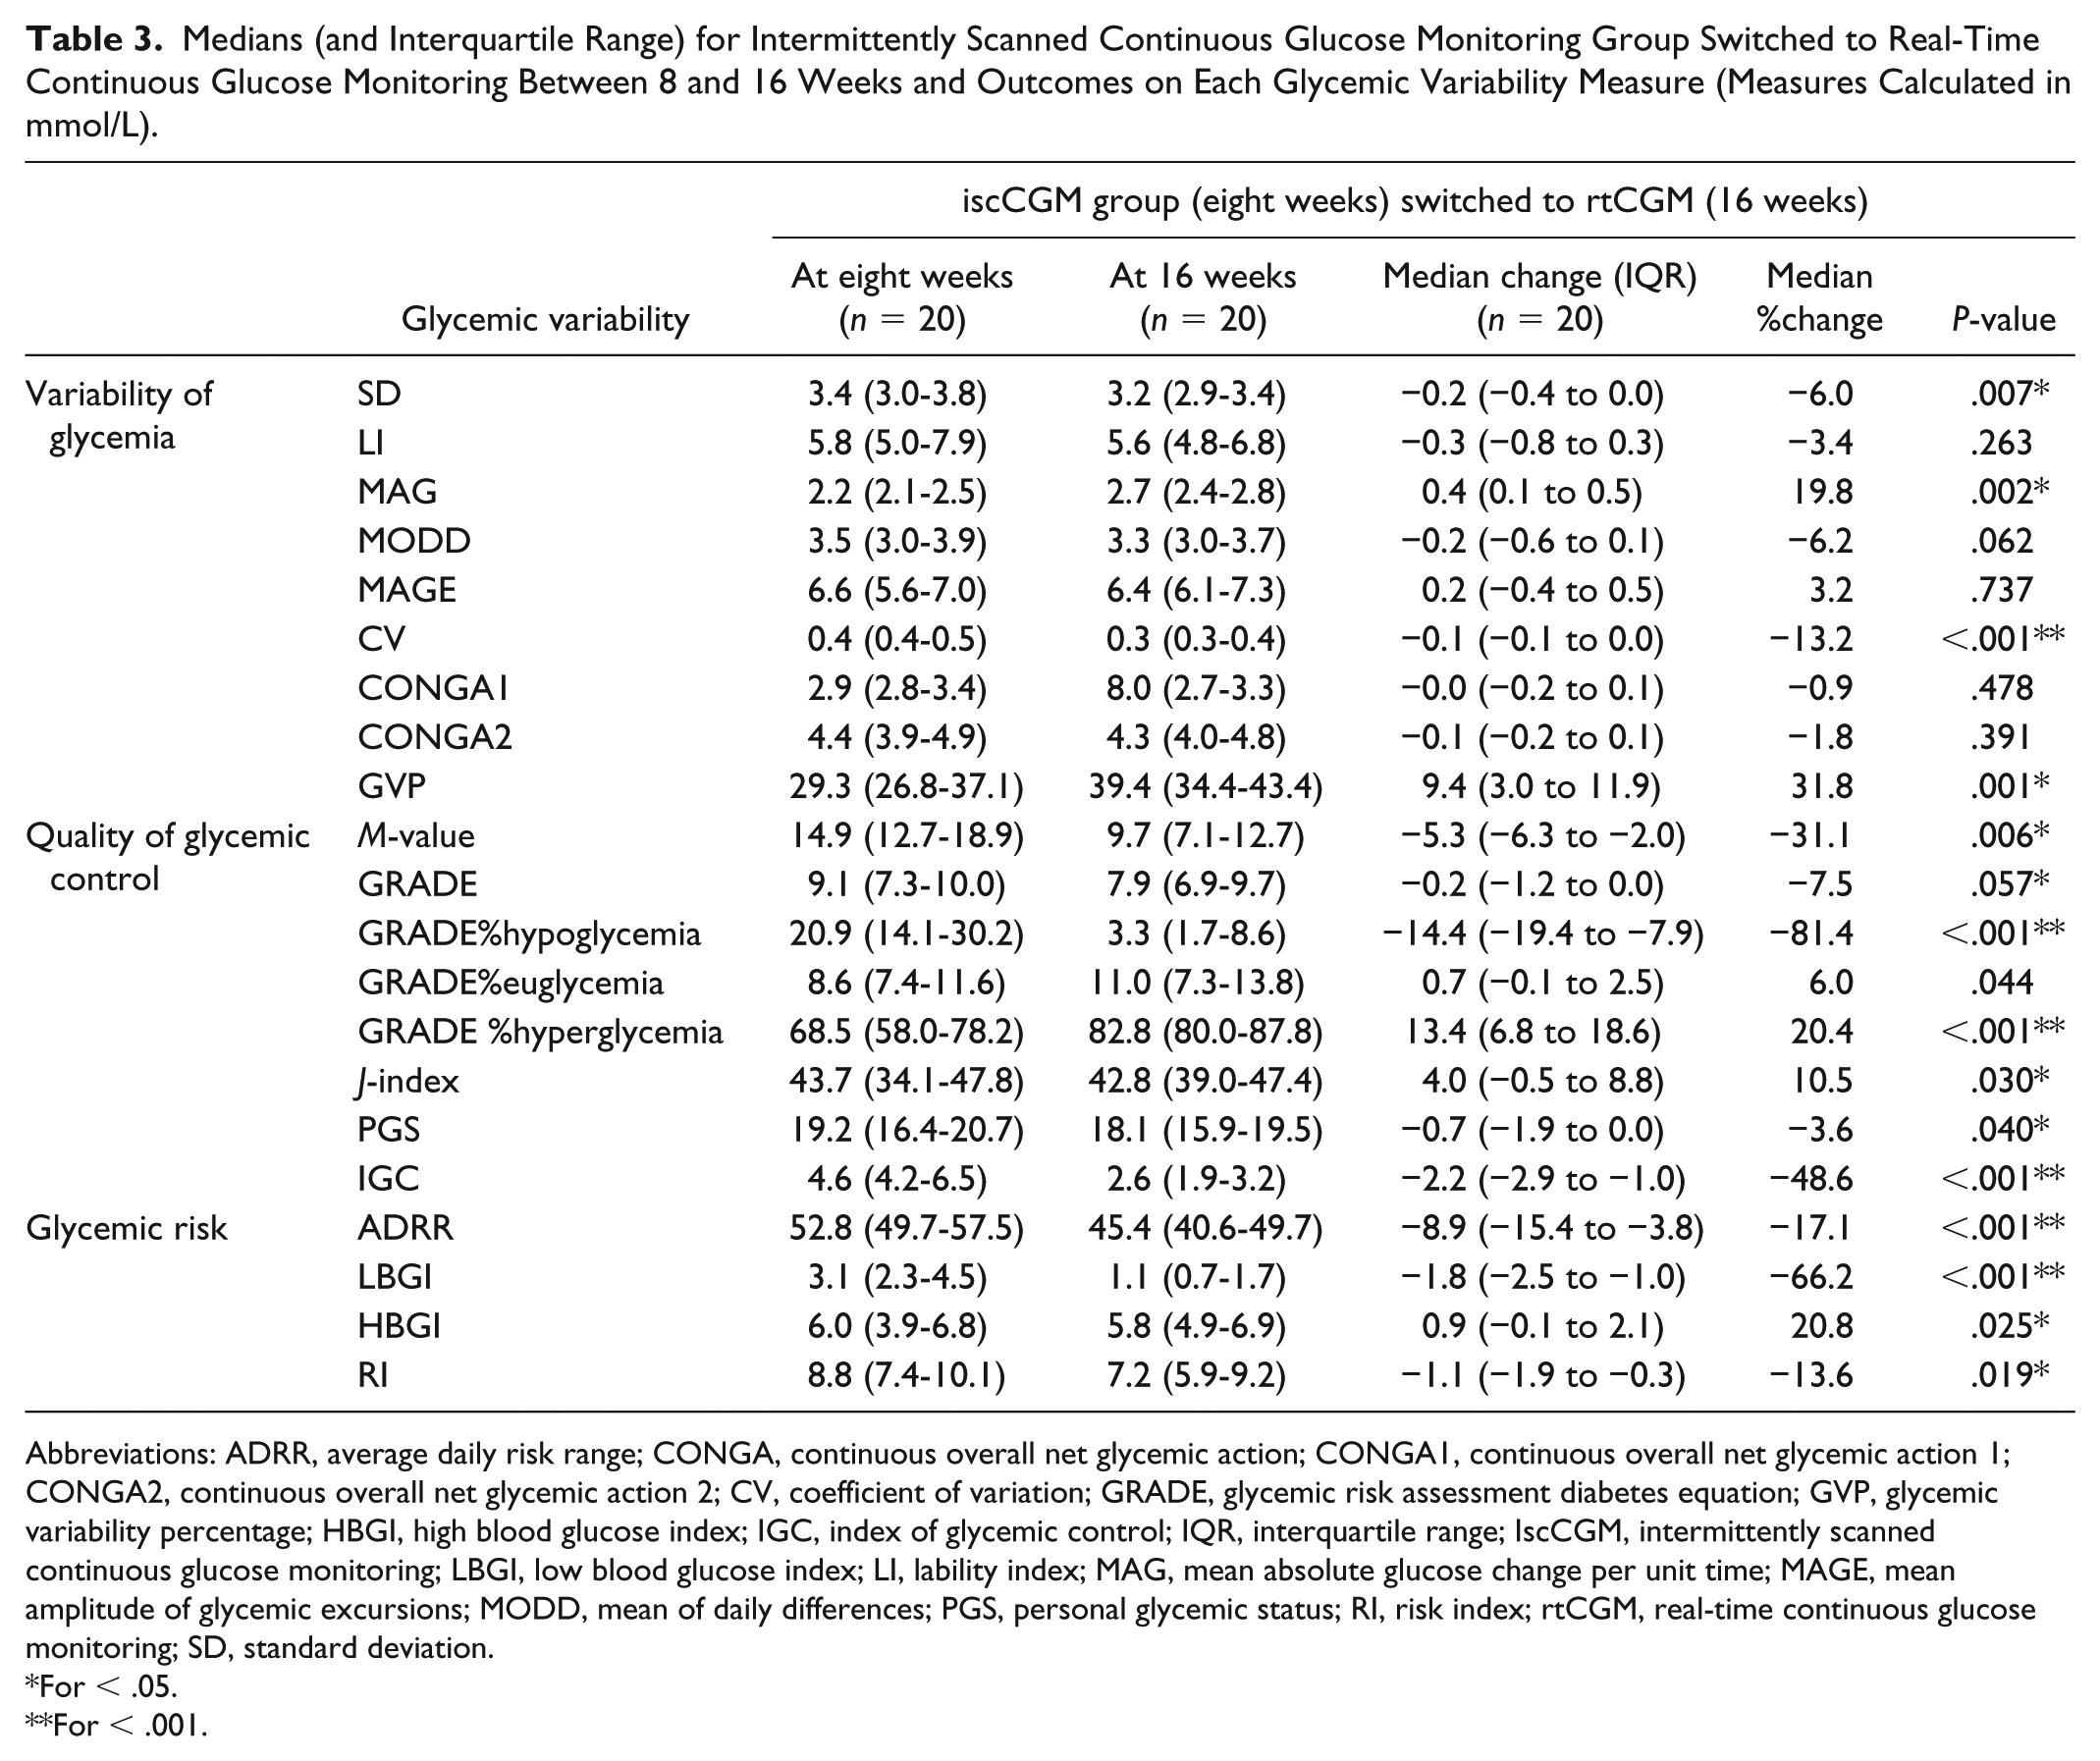
Abbreviations: ADRR, average daily risk range; CONGA, continuous overall net glycemic action; CONGA1, continuous overall net glycemic action 1; CONGA2, continuous overall net glycemic action 2; CV, coefficient of variation; GRADE, glycemic risk assessment diabetes equation; GVP, glycemic variability percentage; HBGI, high blood glucose index; IGC, index of glycemic control; IQR, interquartile range; IscCGM, intermittently scanned continuous glucose monitoring; LBGI, low blood glucose index; LI, lability index; MAG, mean absolute glucose change per unit time; MAGE, mean amplitude of glycemic excursions; MODD, mean of daily differences; PGS, personal glycemic status; RI, risk index; rtCGM, real-time continuous glucose monitoring; SD, standard deviation.
For < .05.
For < .001.
Hypoglycemic Excursions With rtCGM and IscCGM
Significantly fewer hypoglycemic episodes below a threshold of 3.0 mmol/L (54 mg/dL) and 3.9 mmol/L (70 mg/dL) were seen with rtCGM compared with iscCGM during the randomized intervention phase of the study (P < .01, Figure 2).
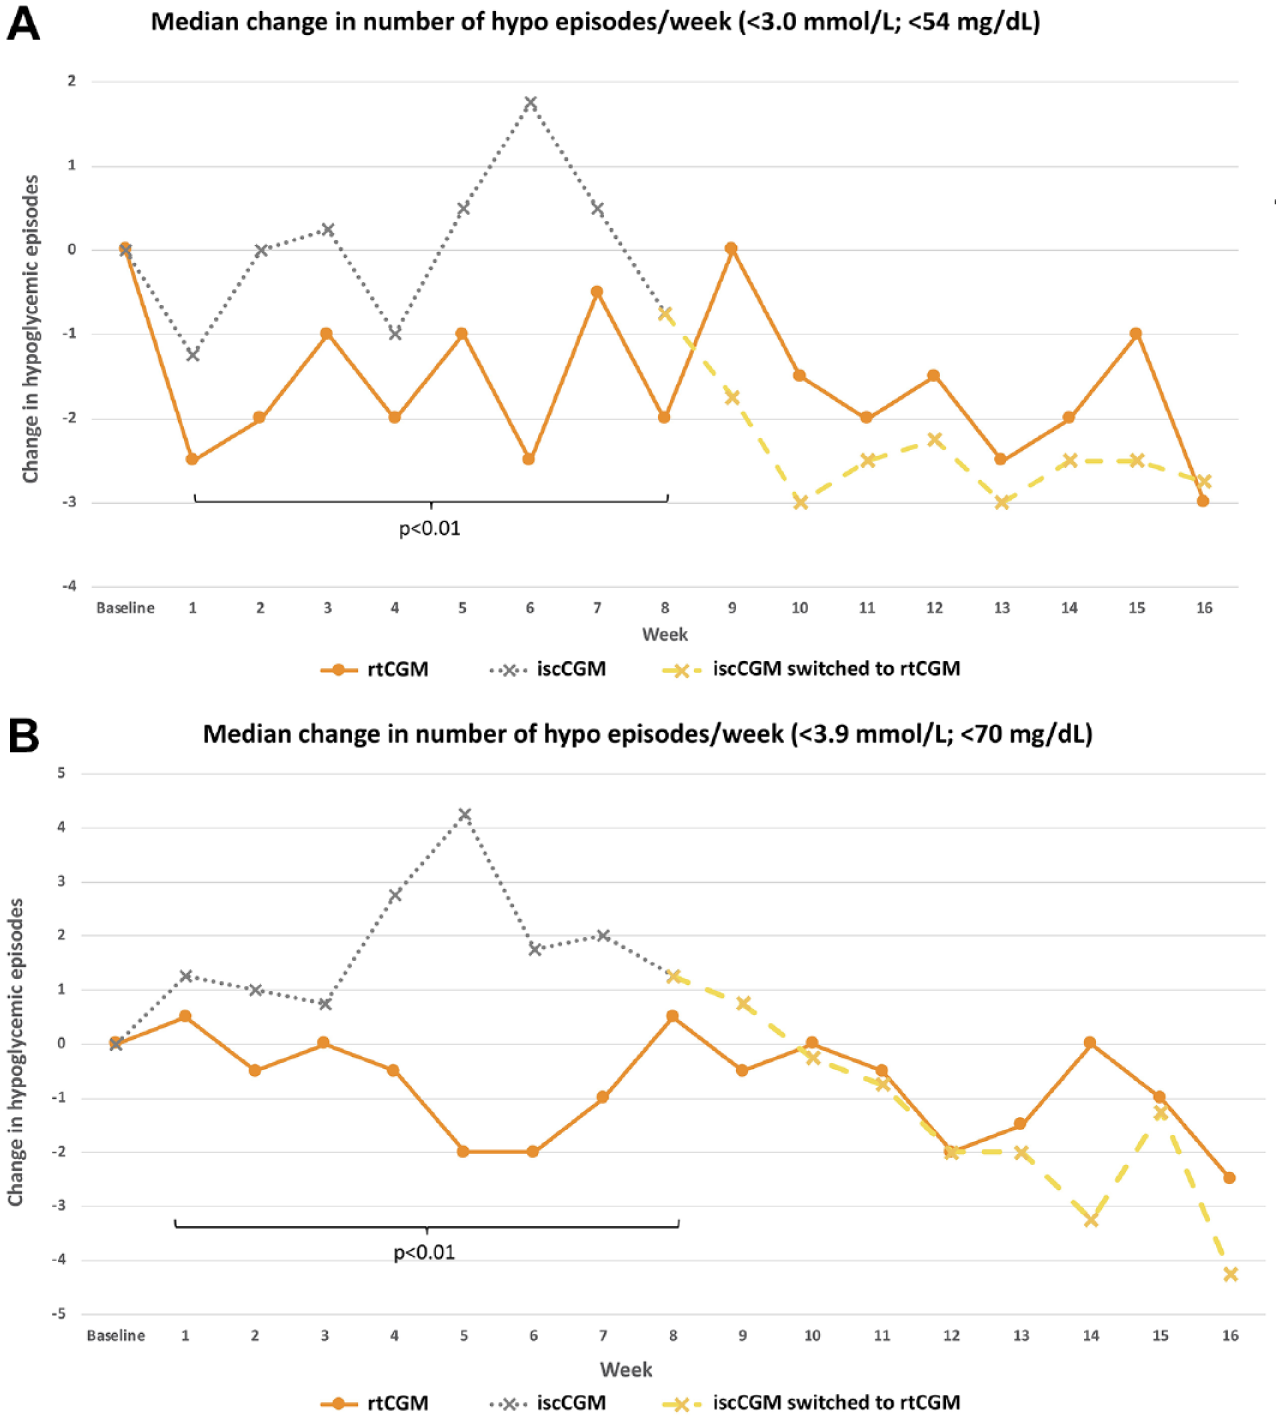
Median number of hypoglycemic episodes per week in the intermittently scanned continuous glucose monitoring and real-time continuous glucose monitoring group for (a) <3.0 mmol/L (<54 mg/dL) and (b) <3.9 mmol/L (<70 mg/dL).
Between 8 and 16 weeks, no change in number of hypoglycemic episodes was observed in the rtCGM group continuing with the additional eight weeks of real-time continuous glucose monitoring. However, switching from iscCGM to rtCGM led to a significant reduction in hypoglycemic episodes. This effect was observed for serious hypoglycemia (<3.0 mmol/L; <54 mg/dL) and for an “alert level” of hypoglycemia at <3.9 mmol/L (<70 mg/dL).
Discussion
This is the first study to assess the differential impact of rtCGM and iscCGM on glucose variability and indicates that rtCGM has a greater beneficial impact on most indices compared with iscCGM in adults with T1DM at highest risk hypoglycemia. Following randomization, the majority, but not all, GV measures improve with rtCGM compared with iscCGM, particularly those measures associated with the risk of hypoglycemia. The improvement observed in the rtCGM group remains sustained during the study period of 16 weeks. Switching from iscCGM to rtCGM confers an additional benefit in some measures of GV and in reducing number of hypoglycemic episodes.
Various GV metrics each differ in evaluating actual variability of glycemia (SD, CV, CONGA, LI, MAGE, and MAG), compared to measures of quality of glycemic control (ie, J-index, GRADE, and M-value) and to glycemic risk (HBGI, LBGI, and ADRR). International consensus recommendations suggest that CV should be considered as the primary measure, with SD as a key secondary measure, when assessing GV. 23 In this study, both CV and SD show significant reduction with rtCGM compared to iscCGM at eight weeks and when switching iscCGM to rtCGM at 16 weeks.
Both rtCGM2,24-26 and iscCGM 20 have been previously shown to reduce GV compared to SMBG. In a small single study comparing iscCGM to rtCGM, no statistical difference was observed between the two groups. 27 However, the study was small (n = 8) with a relatively homogeneous group of people with TIDM and an HbA1c close to target. In comparison, in our study, the relative magnitude of changes suggests greater impact with rtCGM, particularly in hypoglycemic risk, which fits with our previously reported findings.21,22
RtCGM reduced the number of hypoglycemic episodes compared to iscCGM in adults. In particular, the benefits of rtCGM were observed with more serious, clinically important hypoglycemia (<3.0 mmol/L; <54 mg/dL). This correlates with the reduction in %time in hypoglycemia previously reported.21,22
In our cohort of individuals, at eight weeks, iscCGM was associated with improved GRADE%hyperglycemia which may reflect the sensor’s negative bias and a shift of reported glucose distribution to the left. 28 Similarly, at 16 weeks, HBGI and GRADE%hyperglycemia increased with the switch to rtCGM from iscCGM, reflecting the loss of the negative bias from flash.
Mean absolute glucose change per unit time and GVP are of particular interest as they both fell further from baseline with iscCGM than with rtCGM and both include time in the equation. Mean absolute glucose change per unit time uses change in time as the denominator and GVP uses a “distance travelled” approach. This finding may reflect a difference in participant behavior when using rtCGM or iscCGM and merits further investigation. The previously published data, and the data in this analysis, suggest that rtCGM reduces the risk of hypoglycemia (LBGI), exposure to hypoglycemia (%time and episodes), and overall variability independent of the mean glucose (CV) but despite this, iscCGM appears to reduce variation over time. In addition to potential behavioral differences, this may partly reflect a negative accuracy bias reducing reported exposure to hyperglycemia and attenuating change over time. This will be more noticeable in the hyperglycemic range due to the left-skewed nature of glucose data. It may also reflect differences in data filtering between the interventional devices and the ability to detect rapid change—manufacturer data for the Freestyle Libre device suggest that it incorrectly reports the rate of change trend arrows in either direction between 38% and 55% of the time compared to reference rates of change assessed by Yellow Springs Instruments (YSI). 29
As previously discussed,21,22 a limitation of this study includes the difference between the baseline and the intervention measurement modality. The run-in glucose data were obtained from the Dexcom G4 device, while data at the eight-week endpoint was derived from the Abbott Freestyle Libre and Dexcom G5 device, with the 16-week endpoint data derived from Dexcom G5 in both groups. However, in this analysis, while those variability metrics that consider glucose relative to a fixed point may be less comparable, the concordance of the hypoglycemia risk and exposure data with the previously reported results is reassuring.
Conclusion
In summary, our data suggest an improvement in some, but not all, GV metrics with rtCGM compared to iscCGM, particularly in measures sensitive to hypoglycemia. The key measures (ie, CV and SD) are significantly reduced with rtCGM compared to iscCGM. Furthermore, rtCGM is associated with a reduced number of hypoglycemic episodes in adults with T1DM at highest risk of hypoglycemia. These results are consistent with the previous conclusions supporting rtCGM over iscCGM in people at highest risk of hypoglycemia. Selecting appropriate glucose monitoring technology glucose to address GV in this cohort is important to minimize the risk of glucose extremes and severe hypoglycemia.
Supplemental Material
Appendix_Table_1 – Supplemental material for Glycemic Variability and Hypoglycemic Excursions With Continuous Glucose Monitoring Compared to Intermittently Scanned Continuous Glucose Monitoring in Adults With Highest Risk Type 1 Diabetes
Supplemental material, Appendix_Table_1 for Glycemic Variability and Hypoglycemic Excursions With Continuous Glucose Monitoring Compared to Intermittently Scanned Continuous Glucose Monitoring in Adults With Highest Risk Type 1 Diabetes by Parizad Avari, Vanessa Moscardo, Narvada Jugnee, Nick Oliver and Monika Reddy in Journal of Diabetes Science and Technology
Footnotes
Acknowledgements
The authors wish to thank all the study participants for their valuable time and commitment. Infrastructure support was provided by the NIHR Imperial Biomedical Research Centre and the NIHR Imperial Clinical Research Facility. The views expressed are those of the author(s) and not necessarily those of the NHS, the NIHR, or the Department of Health and Social Care.
Declaration of Conflicting Interests
The author(s) declared the following potential conflicts of interest with respect to the research, authorship, and/or publication of this article: M.R. has received honoraria for advisory board participation from Dexcom and Roche Diabetes. N.O. has received honoraria for speaking and advisory board participation from Abbott Diabetes, Dexcom, Medtronic Diabetes, and Roche Diabetes. The funder of the study had no role in study design, data collection, data analysis, data interpretation, or writing of the report.
Funding
The author(s) disclosed receipt of the following financial support for the research, authorship, and/or publication of this article: This work was supported by DEXCOM.
Supplemental Material
Supplemental material for this article is available online.
References
Supplementary Material
Please find the following supplemental material available below.
For Open Access articles published under a Creative Commons License, all supplemental material carries the same license as the article it is associated with.
For non-Open Access articles published, all supplemental material carries a non-exclusive license, and permission requests for re-use of supplemental material or any part of supplemental material shall be sent directly to the copyright owner as specified in the copyright notice associated with the article.