
Abstract

Hyperglycemia is both a causative factor and an early marker for β-cell dysfunction before the onset of diabetes.1,2 Thus, understanding the extent of hyperglycemia in individuals without diabetes is of significance for prevention of diabetes. In the present study, to detect hyperglycemia in overweight/obese men without diabetes, continuous glucose monitoring (CGM) was performed.
A total of 50 male (age 50–65 years, body mass index [BMI] ≥25 kg/m2) participants without previously documented dysglycemia were recruited into this study. On the first day, anthropometric and laboratory data were obtained, the 75-g oral glucose tolerance test (OGTT) was performed, and the iPro™2 Professional CGM (Medtronic, MN, USA) device was attached. The recorder and Enlite sensor were worn for 6 days. The participants were instructed to calibrate the sensor four times throughout the day. Individuals with normal (NGT) or impaired glucose tolerance (IGT) by OGTT, and ≥1,800 CGM recording data, were chosen for inclusion in the analysis (n = 36). The glucose concentrations corresponding to the cutoff points proposed as clinical targets3,4 were used as the thresholds. The study was performed in accordance with the principles of the Helsinki Declaration and approved by the institutional and independent review boards. Written informed consent was obtained from all participants.
The median BMI (interquartile range [IQR]) was 27.9 (26.5-29.4). One quarter of the study population had HbA1c levels >5.6% (38 mmol/mol), and 19.4% had 1,5-AG levels <14.0 µg/mL. Although the β-cell function estimated by the HOMA-β was well preserved, approximately a quarter of the study population had an insulinogenic index of <0.4. The results of the 75-g OGTT revealed that 73% had NGT, whereas 27% had IGT. The median (IQR) at 1-h post-challenge and the maximal glucose levels during OGTT were 176 (150-194) mg/dL and 181 (161-194) mg/dL, respectively. The CGM results, for which the median total count was 1,964 (163.7 hours), showed that the median maximal CGM glucose level and CV were 193 (173-219) mg/dL and 18.3% (15.4-20.6), respectively (Table 1). Approximately half (47%) of the participants had CGM-recorded sensor glucose levels of ≥200 mg/dL at least once, whereas approximately 30% had CGM glucose levels ≥180 mg/dL at least once in every 5 meals. The median time above range (TARs) higher than 140, and 180 mg/dL were 10.4%, and 0.6%, respectively, whereas the median percentages of postprandial peaks ≥140, and ≥180 mg/dL were 57.5%, and 8.1% of meals, respectively (Table 1).
Characteristics and CGM Metrics of the Study Participants (n = 36).
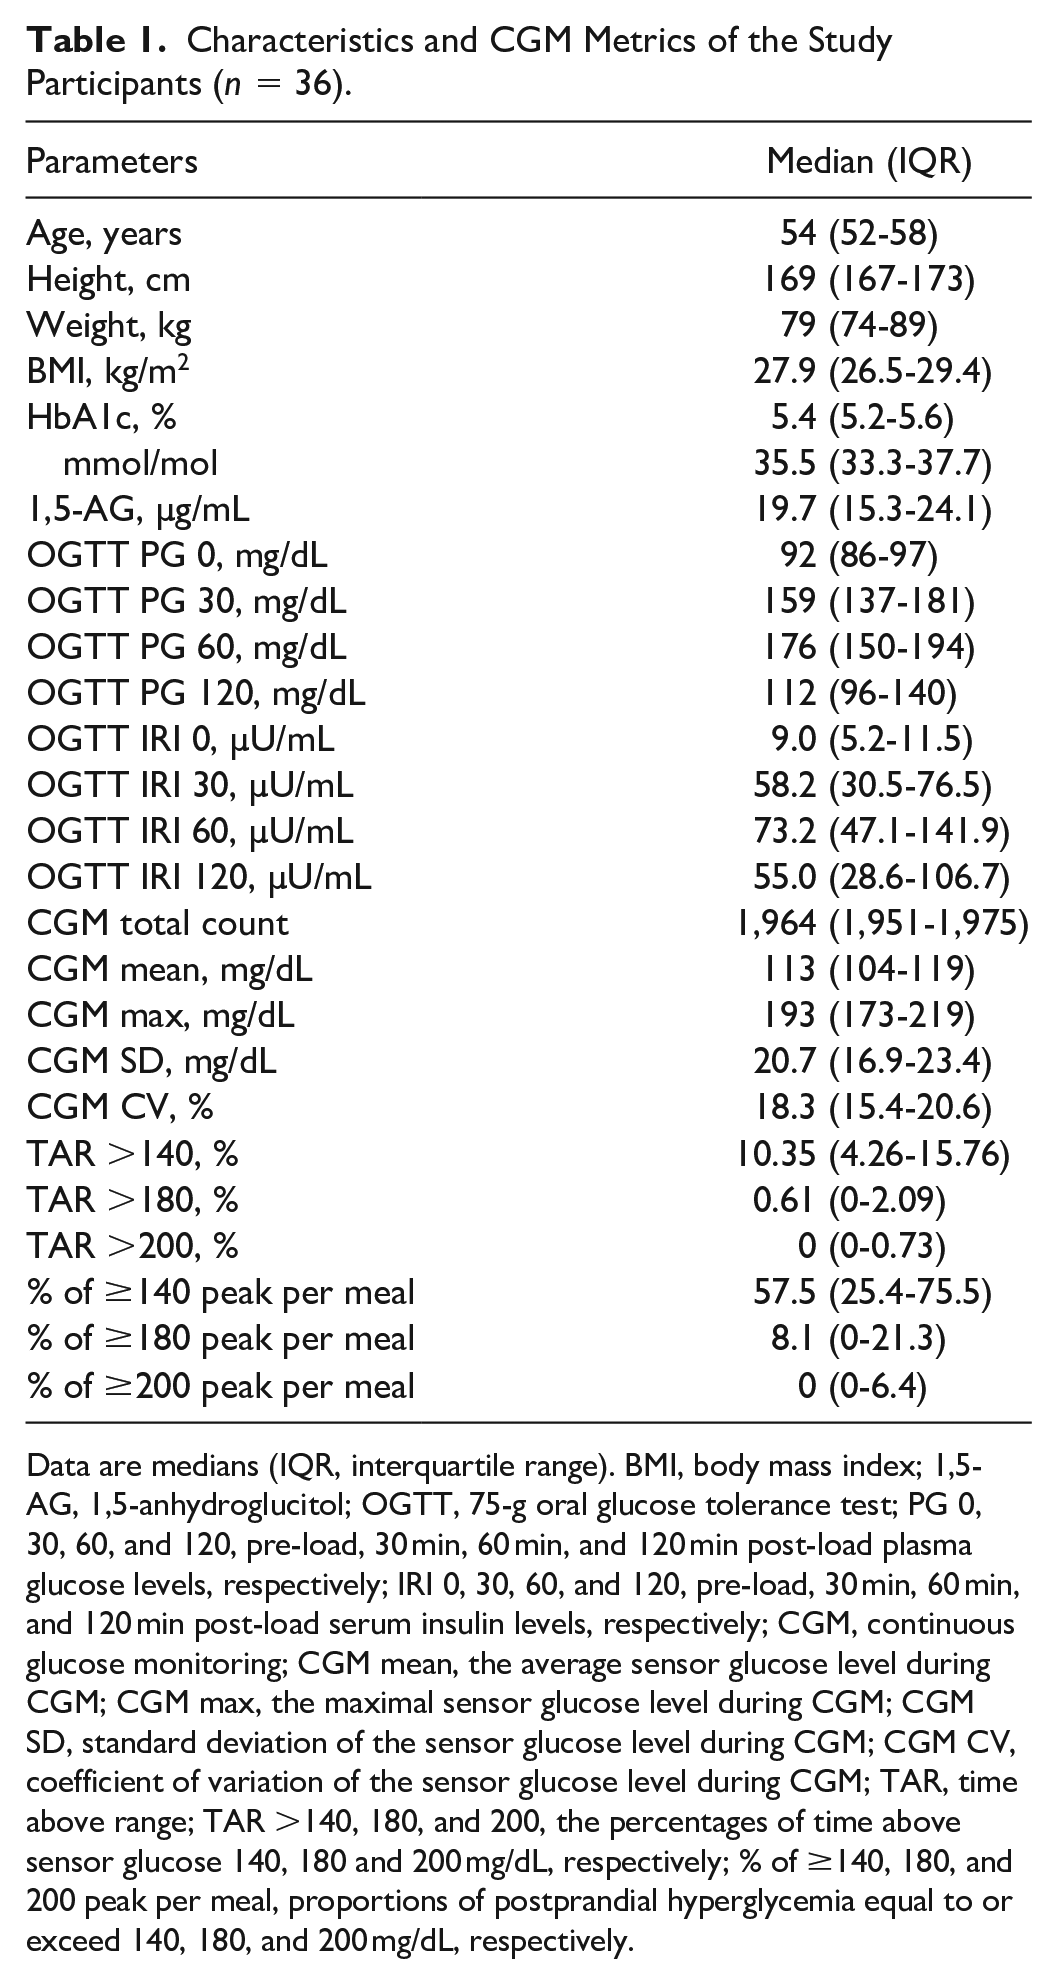
Data are medians (IQR, interquartile range). BMI, body mass index; 1,5-AG, 1,5-anhydroglucitol; OGTT, 75-g oral glucose tolerance test; PG 0, 30, 60, and 120, pre-load, 30 min, 60 min, and 120 min post-load plasma glucose levels, respectively; IRI 0, 30, 60, and 120, pre-load, 30 min, 60 min, and 120 min post-load serum insulin levels, respectively; CGM, continuous glucose monitoring; CGM mean, the average sensor glucose level during CGM; CGM max, the maximal sensor glucose level during CGM; CGM SD, standard deviation of the sensor glucose level during CGM; CGM CV, coefficient of variation of the sensor glucose level during CGM; TAR, time above range; TAR >140, 180, and 200, the percentages of time above sensor glucose 140, 180 and 200 mg/dL, respectively; % of ≥140, 180, and 200 peak per meal, proportions of postprandial hyperglycemia equal to or exceed 140, 180, and 200 mg/dL, respectively.
In individuals with diabetes, postprandial hyperglycemia is associated with various comorbidities, and a peak postprandial glucose level of <180 mg/dL is the recommended target. 5 However, whereas the glycemic response to meals has been studied widely in patients with diabetes mellitus, there is limited CGM-based data on the frequency of postprandial hyperglycemia in individuals without diabetes. 6 The present study suggests that, in non-diabetes, most of which exhibits NGT on 75-g OGTT, a substantial proportion of obese/overweight people exhibited elevated sensor glucose levels above the recommended target for diabetes management and caution must be exercised to prevent postprandial hyperglycemia.
Footnotes
Acknowledgements
Abbreviations
AG, anhydroglucitol; BMI, body mass index; CGM, continuous glucose monitoring; CV, coefficient of variation; HOMA, homeostatic model assessment; IGT, impaired glucose tolerance; IQR, interquartile range; NGT, normal glucose tolerance; OGTT, oral glucose tolerance test; SD, standard deviation; TAR, time above range.
Author Contributions
Ichiro Kishimoto contributed to the conception and design of the study, analyzed data, and wrote the manuscript. Akio Ohashi contributed to the acquisition of data, data analysis, and interpretation of the results. All authors provided final approval of the version to be published and agree to be accountable for all aspects of the work.
Declaration of Conflicting Interests
The author(s) declared no potential conflicts of interest with respect to the research, authorship, and/or publication of this article.
Funding
The author(s) disclosed receipt of the following financial support for the research, authorship, and/or publication of this article: This research was supported by the Japan Agency for Medical Research and Development (AMED; Grant Number JP16ek0210034) and the clinical research fund from Toyooka Public Hospital.