
Abstract
Background:
Continuous glucose monitoring (CGM) devices, with their 1-5 min measurement interval, allow blood glucose (BG) concentration dynamics to be captured more frequently and less invasively than traditional BG measures. One cohort CGM could provide insight is athletes. This study investigates what impact their heightened energy expenditure and dietary intake may have on their ability to achieve optimal BG.
Methods:
Ten subelite athletes (resting HR<60 bpm, training>6 hrs per week) were recruited. Two Ipro2 CGM devices (Medtronic Minimed, Northridge, CA) were inserted into the abdomen and remained in place for ~6 days. Time in band was calculated as the percentage of CGM BG measurements with in the 4.0-6.0 mmol/L. Fasting glucose was calculated using CGM calibration BG measurements and postprandial glucose response was also calculated using the CGM values.
Results:
4/10 athletes studied spent more than 70% of the total monitoring time above 6.0 mmol/L even with the 2-hour period after meals is excluded. Fasting BG was also in the ADA defined prediabetes range for 3/10 athletes. Only 1 participant spent substantial time below 4.0 mmol/L which was largely due to significantly lower energy intake compared to recommendations.
Conclusions:
Contrary to expectations high BG appears to be more of a concern for athletes then low BG even in those with the highest energy expenditure and consuming below the recommended carbohydrate intake. This study warrants further investigation on the recommended diets and the BG of athletes to better determine the causes and impact of this hyperglycemia on overall athlete health.
Keywords
The World Health Organization (WHO) defines normal glycemia as fasting glucose less than 6.1 mmol/L and recommends that glucose be <7.8 mmol/L 2 hours after a 75 g oral glucose tolerance test (OGTT) test. 1 The American Diabetes Association (ADA) considers those with a fasting glucose of 5.6-6.9 mmol/L and blood glucose (BG) > 7.8 -11.0 mmol/L after an OGTT at increased risk of diabetes. 2 However, as the WHO guidelines explain, there is no definitive cut off for “normoglycemia.” 1
Continuous glucose monitoring (CGM) devices, with their 1-5 minute measurement interval, allow BG concentration dynamics to be captured far more frequently and less invasively than traditional BG measures. CGM devices typically consist of a small pager-like monitoring device that receives a signal from a sensor inserted into the subcutaneous layer. The sensor creates a signal using the glucose oxidase reaction and produces a current proportional to the glucose concentration in the surrounding interstitial fluid. The signal is converted into a BG value by using calibration BG measurements, which are entered into the monitor by the user every ~6-8 hrs.
These devices are primarily designed for use in individuals with type 1 and type 2 diabetes to aid BG regulation and are well studied in this cohort.3,4 However, because of the increased measurement frequency and reduced invasiveness they have recently been applied to other cohorts, such as intensive care patients and neonates, with varying success.5-12 Another, perhaps overlooked, cohort where the more intensive metabolic monitoring provided by CGM may be beneficial is athletes.
Athletes are traditionally encouraged to consume a diet rich in carbohydrates to ensure adequate glycogen stores and improve performance.13-15 Physical training is known to improve insulin sensitivity, both immediately postexercise and through multiple long-term adaptations in glucose transport and metabolism. 16 However in contrast, strenuous exercise is known to increase circulating concentrations of catecholamines, such as adrenalin and noradrenaline, to near pathological levels,17,18 resulting in hyperglycemia and hyperinsulinemia post–intense exercise.17,19,20
This study aims to use the CGM BG profiles and dietary habits of subelite athletes to investigate if this cohort is achieving optimal BG levels during normal free living and training. The CGM data provide a unique insight in to the day to day BG levels of Athletes that could not be achieved without the application of this technology. In particular, it asks what impact their increased insulin sensitivity, heightened energy expenditure and increased exposure to stress hormones have on their BG levels.
Methods
Ten fit, healthy subelite athletes (resting HR <60 bpm) were recruited under informed written consent for a study into optimal athlete nutrition (henceforth referred to as athletes). Table 1 summarizes the cohort demographics. All subjects regularly trained > 6 hours per week in a range of endurance based sports, predominantly running and cycling. Participants were free living during the monitoring period and did not have tailored nutritional programs from this study or an existing coach. The research procedures and use of data were approved by the University of Canterbury Human Ethics Committee.
Cohort Demographics of the Participants.
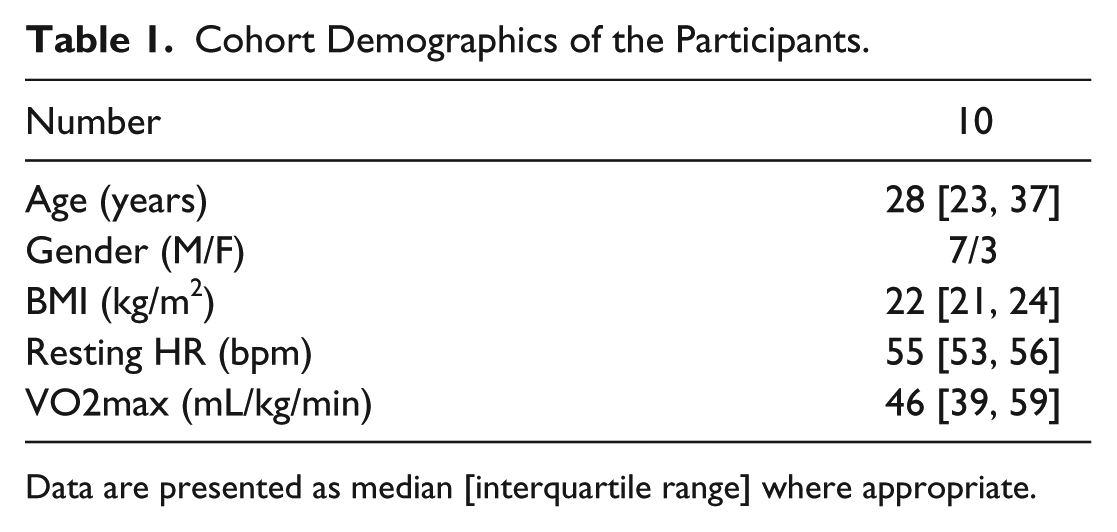
Data are presented as median [interquartile range] where appropriate.
Two Ipro2 and 1 Guardian Real-time CGM devices (Medtronic Minimed, Northridge, CA, USA) were inserted into the abdomen of each athlete ~24 hours prior to the first ‘fasted exercise test’. The CGM device remained in each subject for 4-6 days. For all athletes, the Ipro CGM devices were both inserted in to the left side of the abdomen and the Guardian in the right side. These devices are referred to as sensor 1 (SG1), the lower left abdomen sensor, sensor 2 (SG2), the upper-left abdomen sensor, and the real-time sensor in the right abdomen sensor (SGrealtime). Figure 1 shows these locations which are typical for these devices. The Guardian real-time data were not used in this analysis. Two Ipro2 sensors were worn to provide redundancy in case of sensor failure, which is not immediately apparent with these retrospective devices.
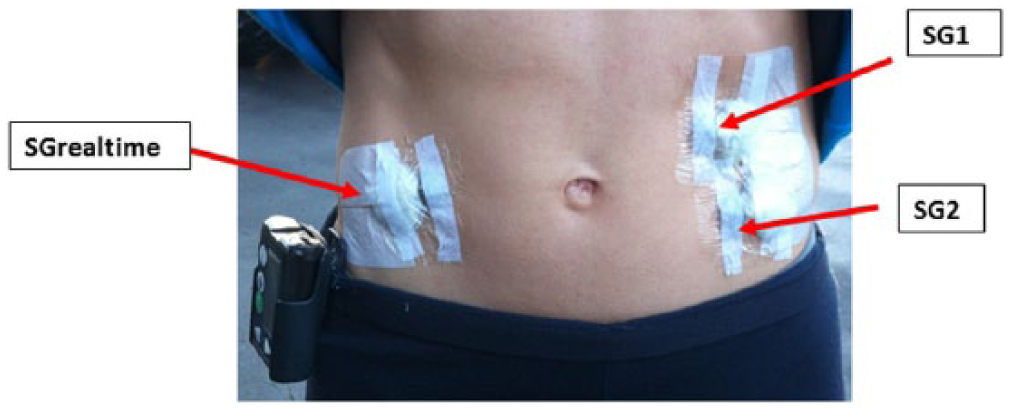
Photo showing the locations of each CGM device.
During the ~6 days of CGM per athlete:
BG was measured 4 times per day prior to meals, thus including morning fasting, and sleeping. These measurements were used to calibrate the device (calibration BG)
All meals and snacks were recorded (self-reporting) and carbohydrate, sugar, fiber, protein and fat intake was calculated.
Any exercise was also recorded (self-reporting) and energy expenditure estimated.
A fasted exercise test was carried out on Day 2, as shown in Figure 2.
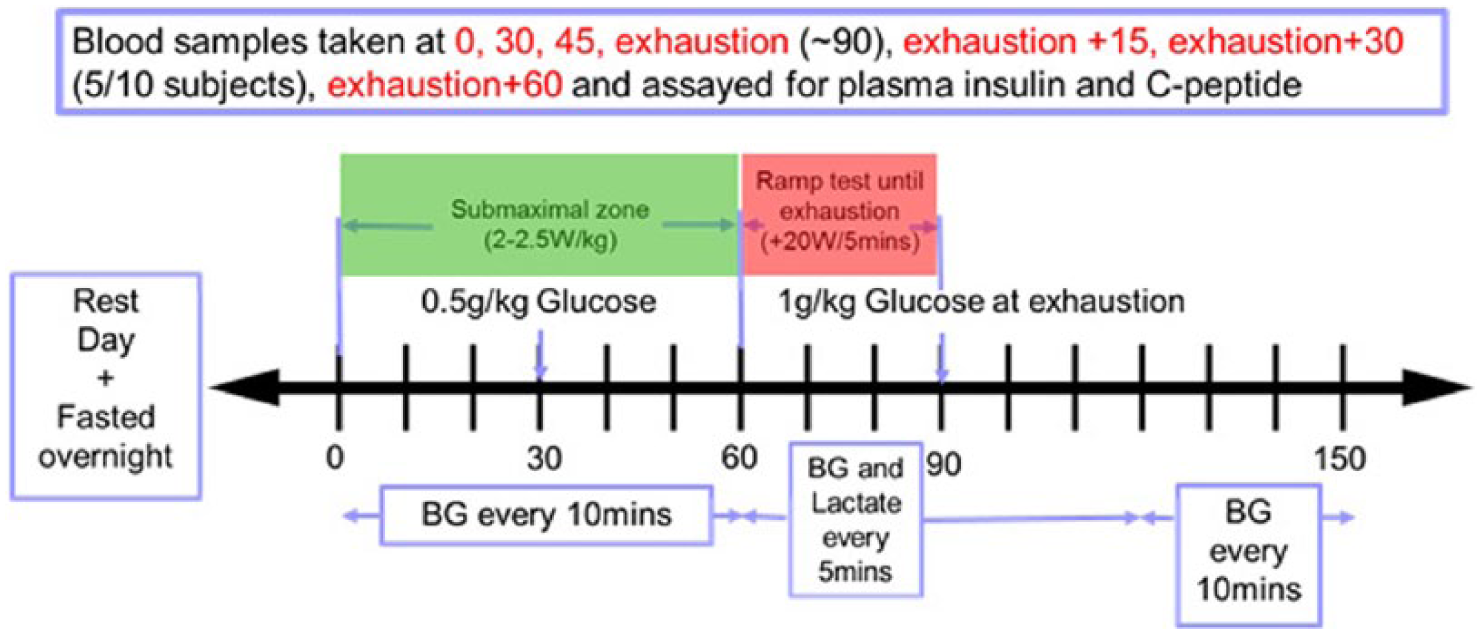
Schematic displaying experimental procedure for the fasted exercise test the participants undertook.
Calibration BG measurements were taken using capillary finger stick measurements and the Abbott Optimum Xceed (Abbott Diabetes Care, Alameda, CA) glucometer. The Abbott device has reported error of 5-10%.9,21-23 A body composition analysis was undertaken by 8 of the 10 participants prior to the fasting test using a body composition analyzer (InBody230, InBody Bldg, Seoul, Korea).
Analysis
Sensor glucose (SG) data from measured CGM traces of the 2 Ipro2 devices were analyzed. These devices have shown to have very good accuracy and sensor agreement in active individuals.8,24 The 2 signals were averaged at each time step for the time period they were worn to provide a single, reliable trace of BG. For Ath04, Ath09, and Ath10 only 1 CGM trace was available due to sensor failure.
For each athlete, the cumulative distribution of BG data was analyzed for the entire 5-6 days of monitoring, and reanalyzed with the 2-hour period following any meal or snack removed. Time in band was calculated as the percentage of SG with in the 4.0-6.0 mmol/L during the 2 different monitoring periods. Although a consensus has yet to be reached on what normal glucose levels, intensive insulin therapy studies show achieving higher time in this band results in improved patient outcomes25-27 and it lies below typical thresholds for diabetes diagnosis.1,2 Many studies have also demonstrated the linearly increasing risks associated with hyperglycemia, regardless of diabetes status, with lower limits between 4.0 and 6.0 mmol/L.1,28-33
The average carbohydrate, sugar, and fiber intake (g/day) while using CGM were calculated. First, daily caloric intake was calculated using basal metabolic rate (BMR) as estimated by the body composition analysis. For 2/10 athletes, Ath02 and Ath03, body composition analysis results were not available. Therefore, BMR was estimated using the standard equations 34 that take in to account height, weight, and age. This BMR was then multiplied by an activity factor 35 considering the amount of exercise undertaken by the athlete during the monitoring period. This process and relating caloric requirements are shown in Table 2.
The Process of Calculating the Caloric Requirements Based on BMR and Activity Level and the Average Calorie Intake Achieved by Each Subject.
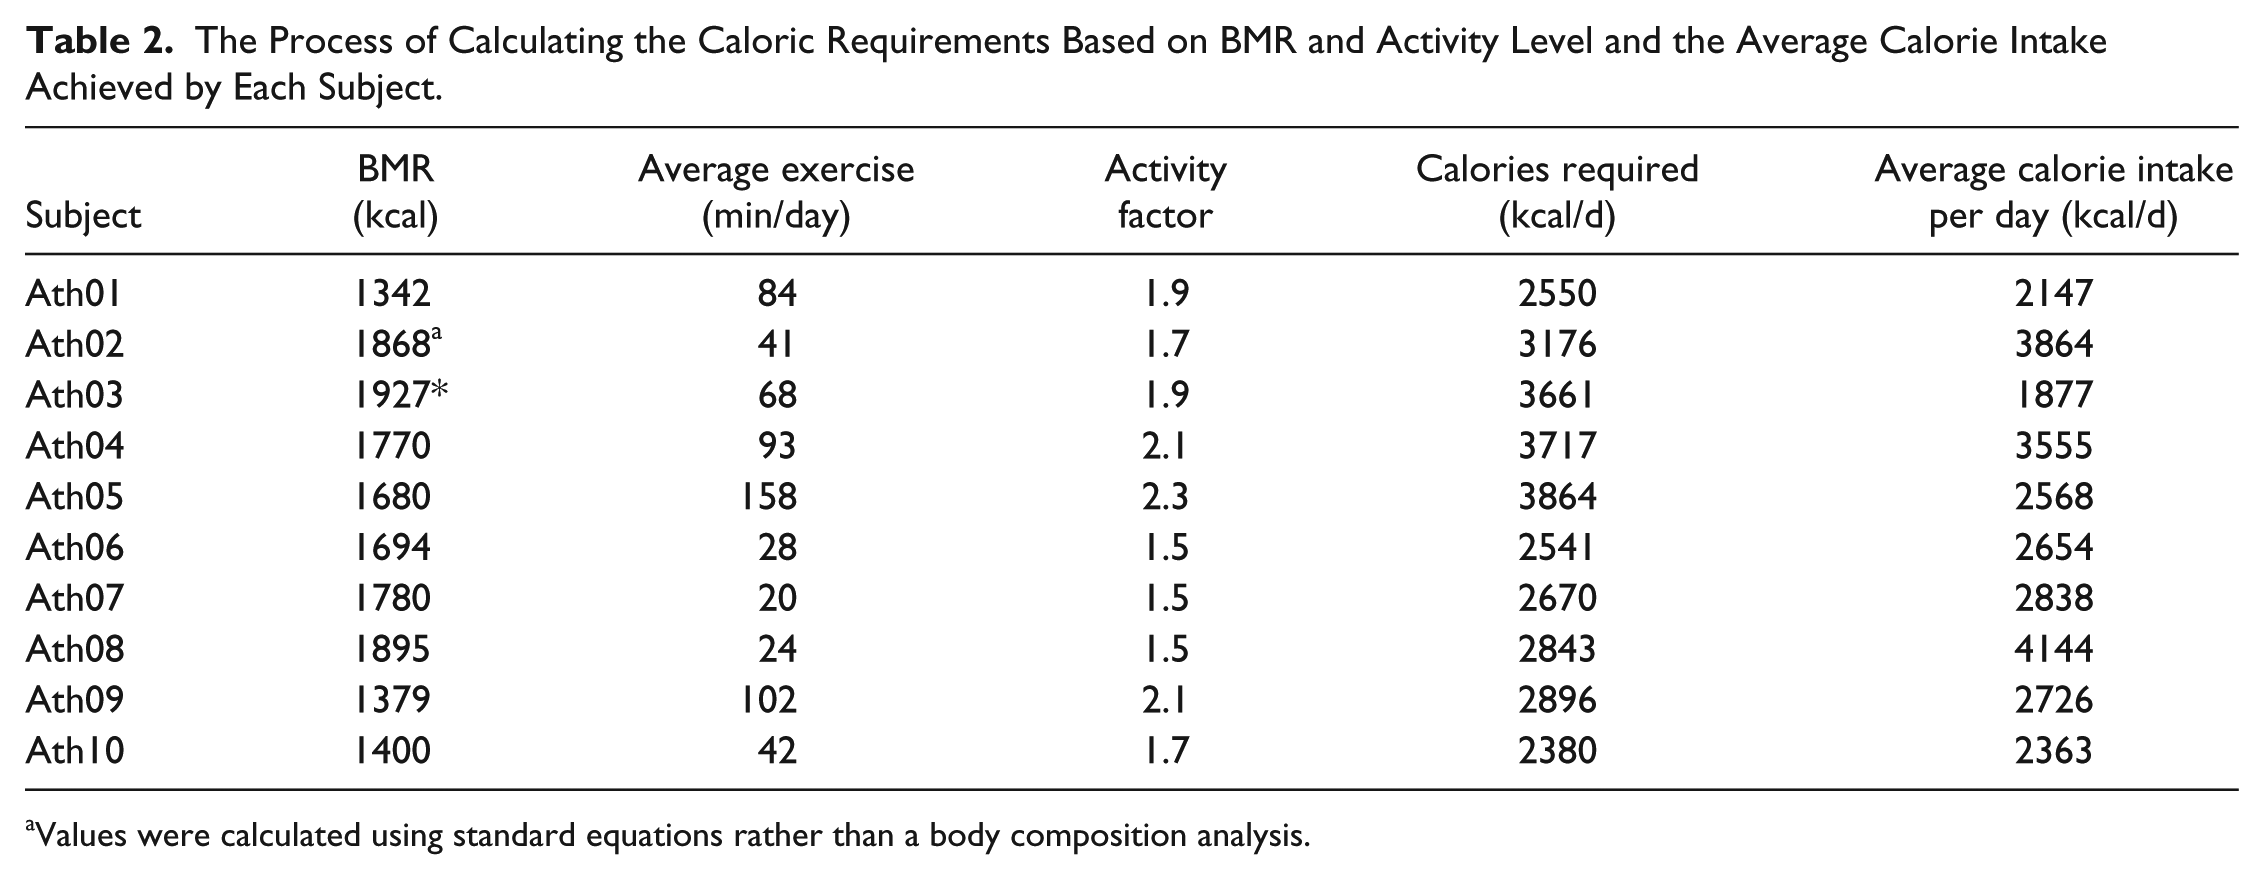
Values were calculated using standard equations rather than a body composition analysis.
US dietary guidelines 36 recommend 45-65% of total calorie intake be from carbohydrates and the recommended amount of added sugars is also related to calorie level in these guidelines. Added sugar content of food consumed during the monitoring period was calculated using the US Department of Agriculture (USDA) database. 37 If the added sugar content was not available from the database it was assumed to be zero, providing an overall conservative estimate.
Fasting blood glucose (FBG) was calculated as the median value of the calibration measurements taken prior to breakfast over the 5-6 days of CGM monitoring. Fasting plasma insulin (FPI) was determined by the first plasma insulin measurement taken prior to starting the fasted exercise test on Day 2 (Figure 2). Fasting insulin secretion (FIS) was calculated from the initial C-peptide measurement taken prior to starting the fasted exercise test using the method of Van Cauter et al 38 assuming steady-state, as subjects were fasted.
Postprandial glucose response (PPGR) was calculated as the incremental area under the BG curve after a meal. 39 Only the area above the starting glucose value was considered. PPGR was only considered for meals that had greater than 30 g of carbohydrate, and where there was no meal of greater than 15 g carbohydrate in the 2 hours prior to or after this meal. If meals were consumed within 15 minutes then carbohydrate content was combined and the 2-hour area under the curve considered from the start of the second meal. Postprandial glucose (PPG) was the glucose value recorded 2 hours after a meal under the same conditions as above.
Results
Individual SG profiles are shown in Figure 3 and Figure 4. These profile highlight the very unique response of each individual to exercise and carbohydrates. Ath02 and Ath04 both show very little variation in SG but Ath02 SG is centered on a higher glucose value resulting in more time out of the 4.0-6.0 mmol/L. Other subjects such as Ath03 and Ath09 show a large variation in SG, once again centered on different glucose levels resulting in Ath03 displaying the most hypoglycemia and Ath09 displaying the most hyperglycemia. Also individual plots for each SG profile can be found in the supplementary material accompanying this article. These plots show both SG profiles and the resulting averaged SG.
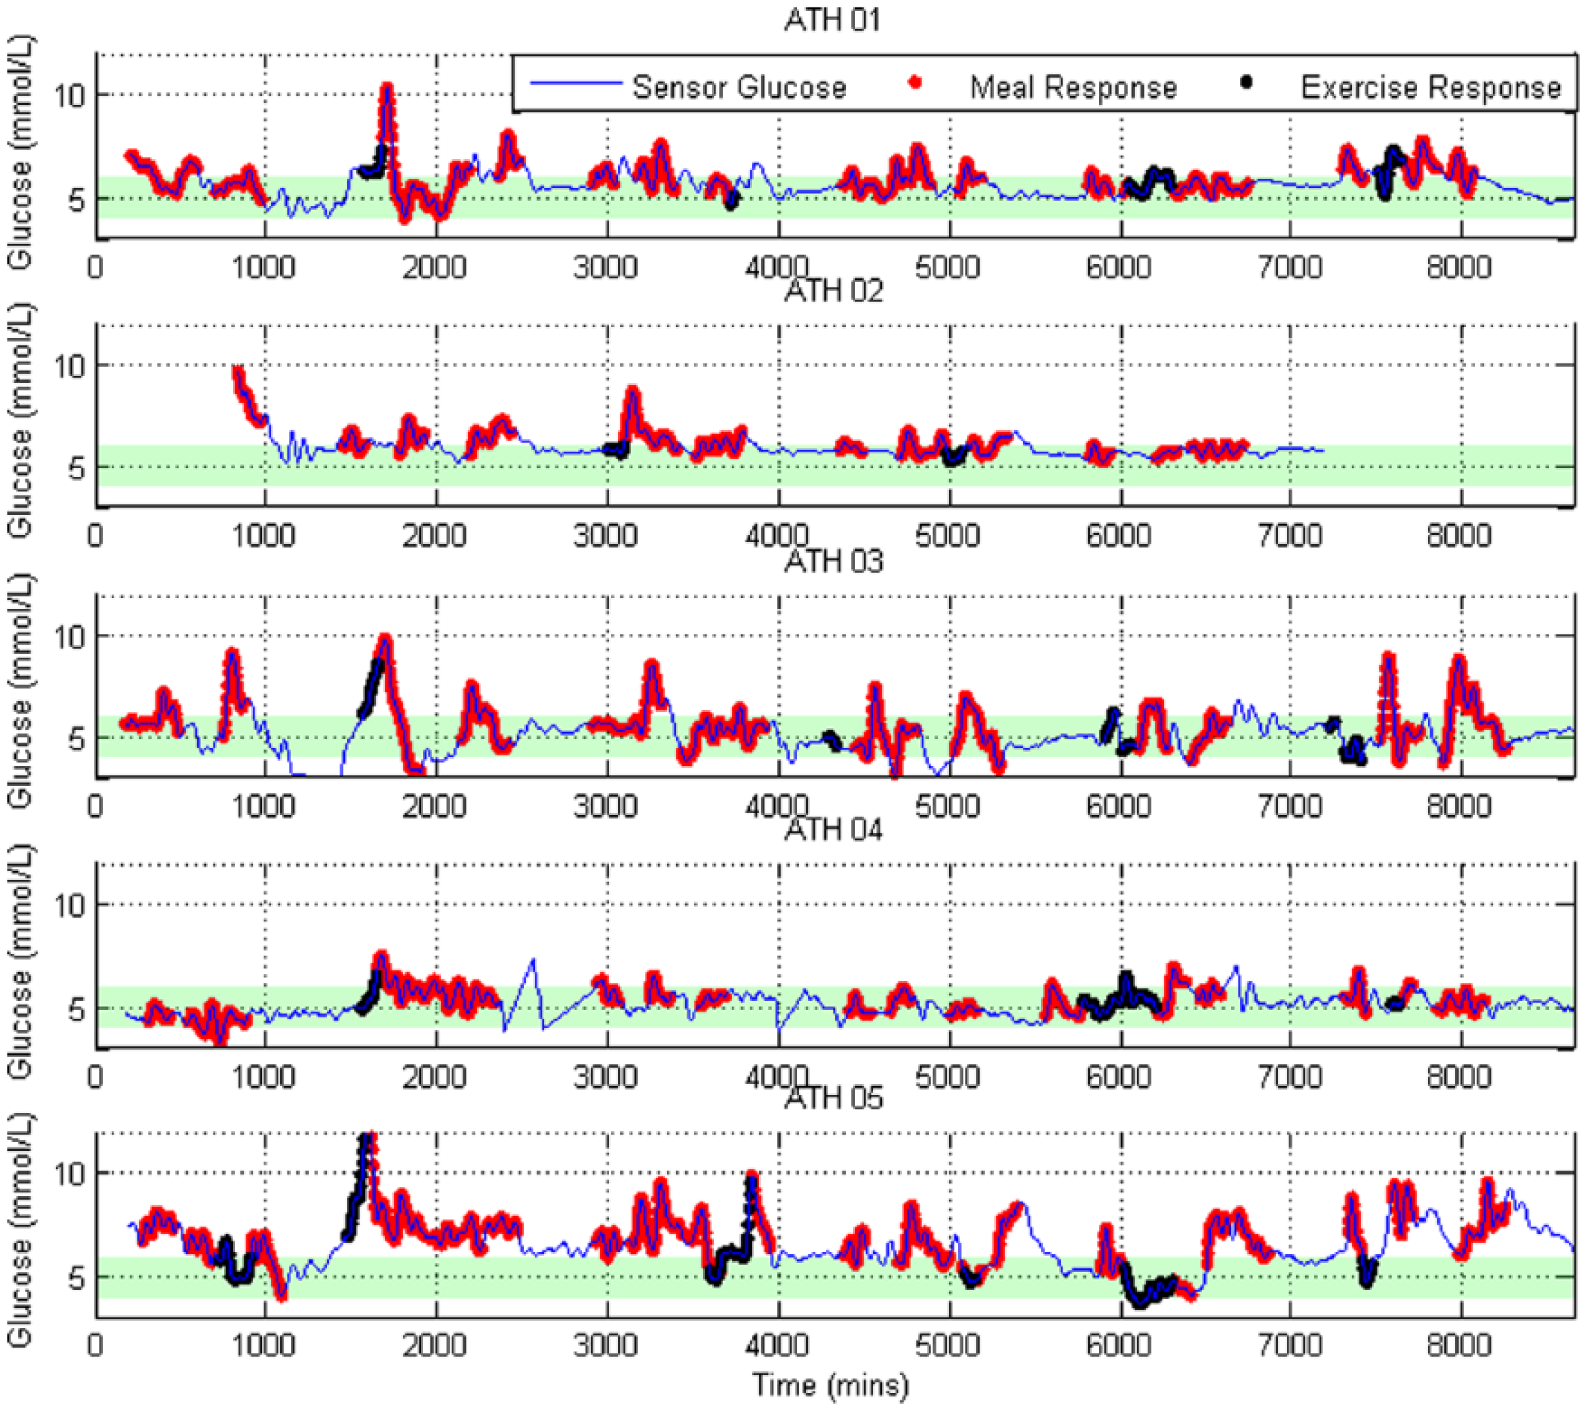
CGM profiles for the first 5 subjects. The 2-hour postprandial meal response is highlighted in red, and periods of exercise are highlighted in black.
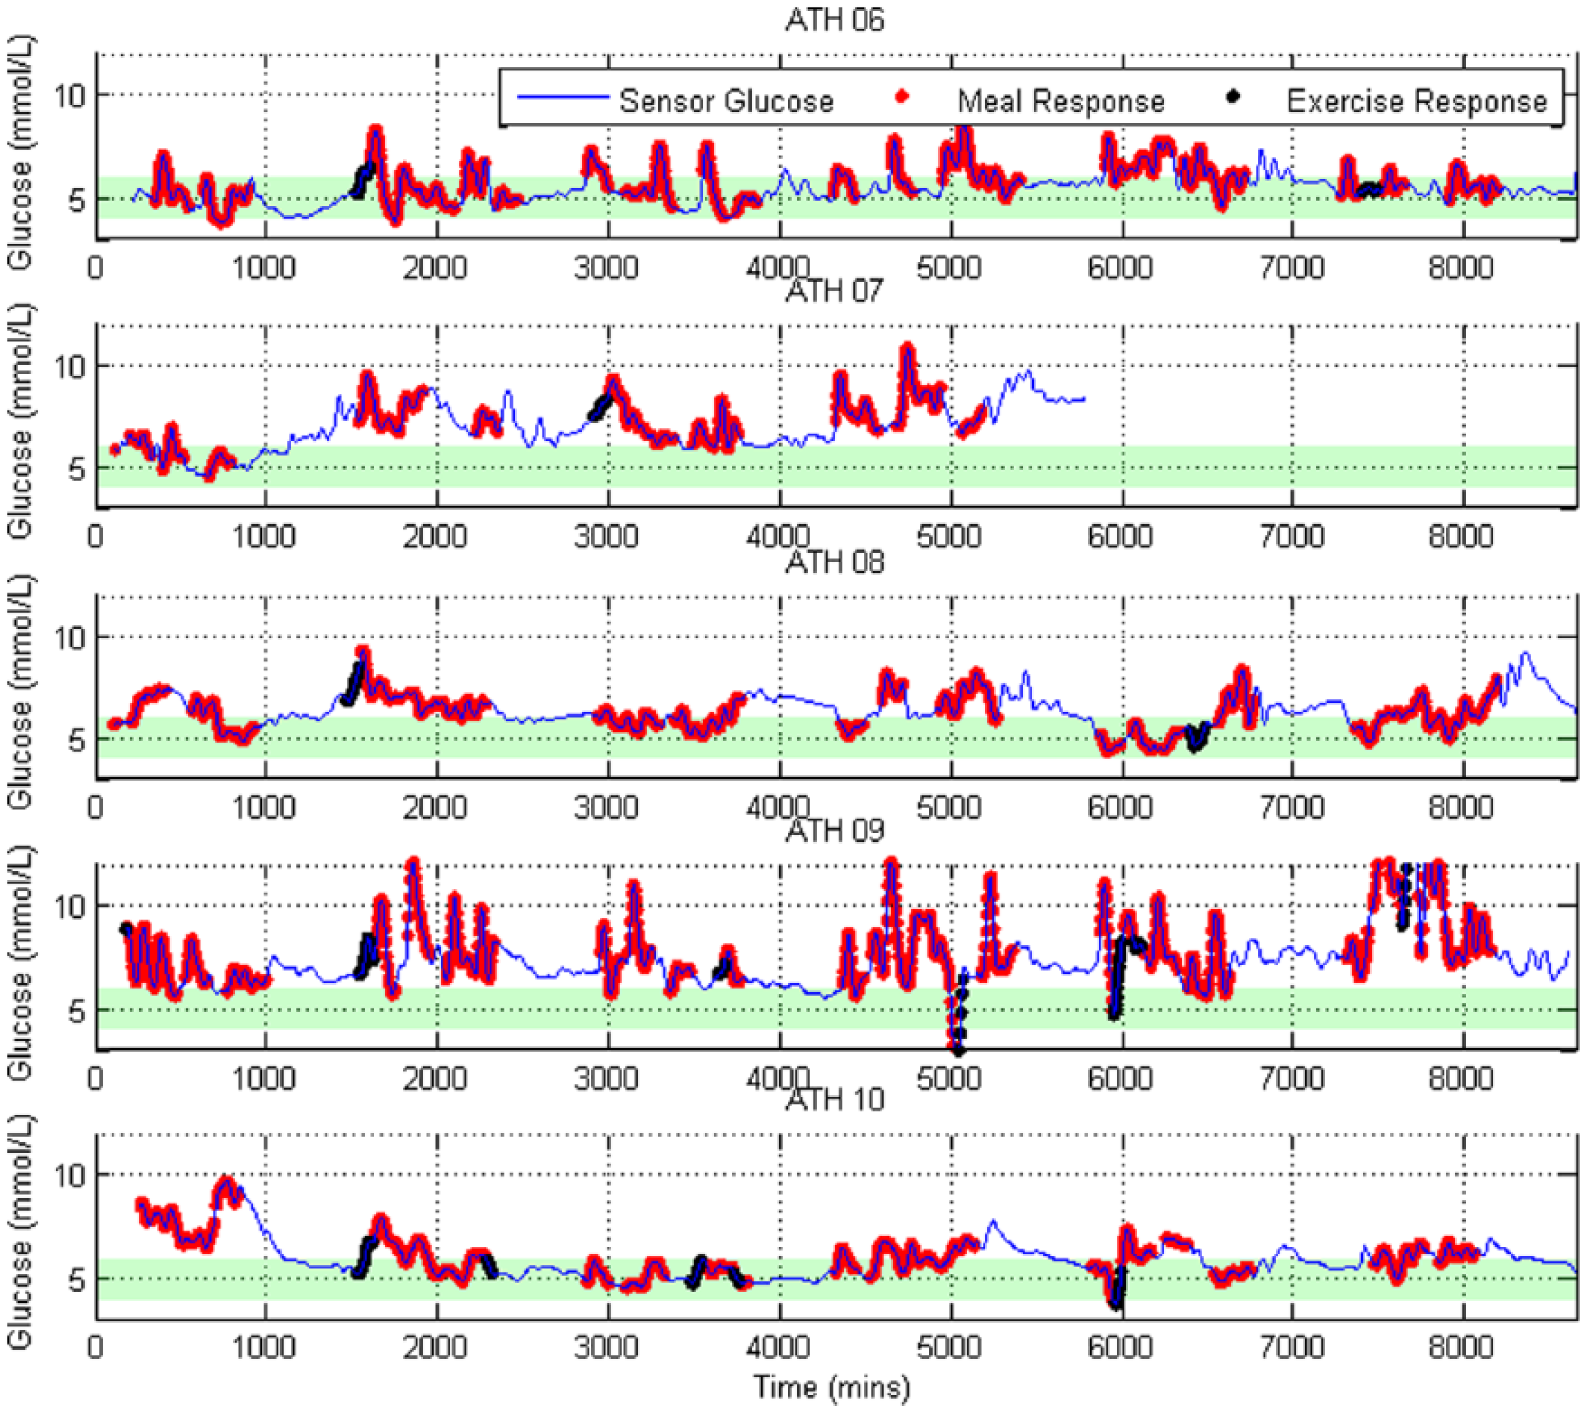
CGM profiles for the last 5 subjects. The 2-hour postprandial meal response is highlighted in red, and periods of exercise are highlighted in black.
In Figure 5 it is further evident participants spend a significant amount of time outside the normoglycemic 4.0-6.0 mmol/L range. Once meals are removed, in the bottom plot, there is a distinct separation between 4/10 of the subjects (Ath05, 07, 08, 09) who have less than 30% time in the 4.0-6.0 mmol/L. In contrast, the remaining 6/10 participants achieve over 85% time in the desired 4.0-6.0 mmol/L range, which is clear when comparing the distributions.
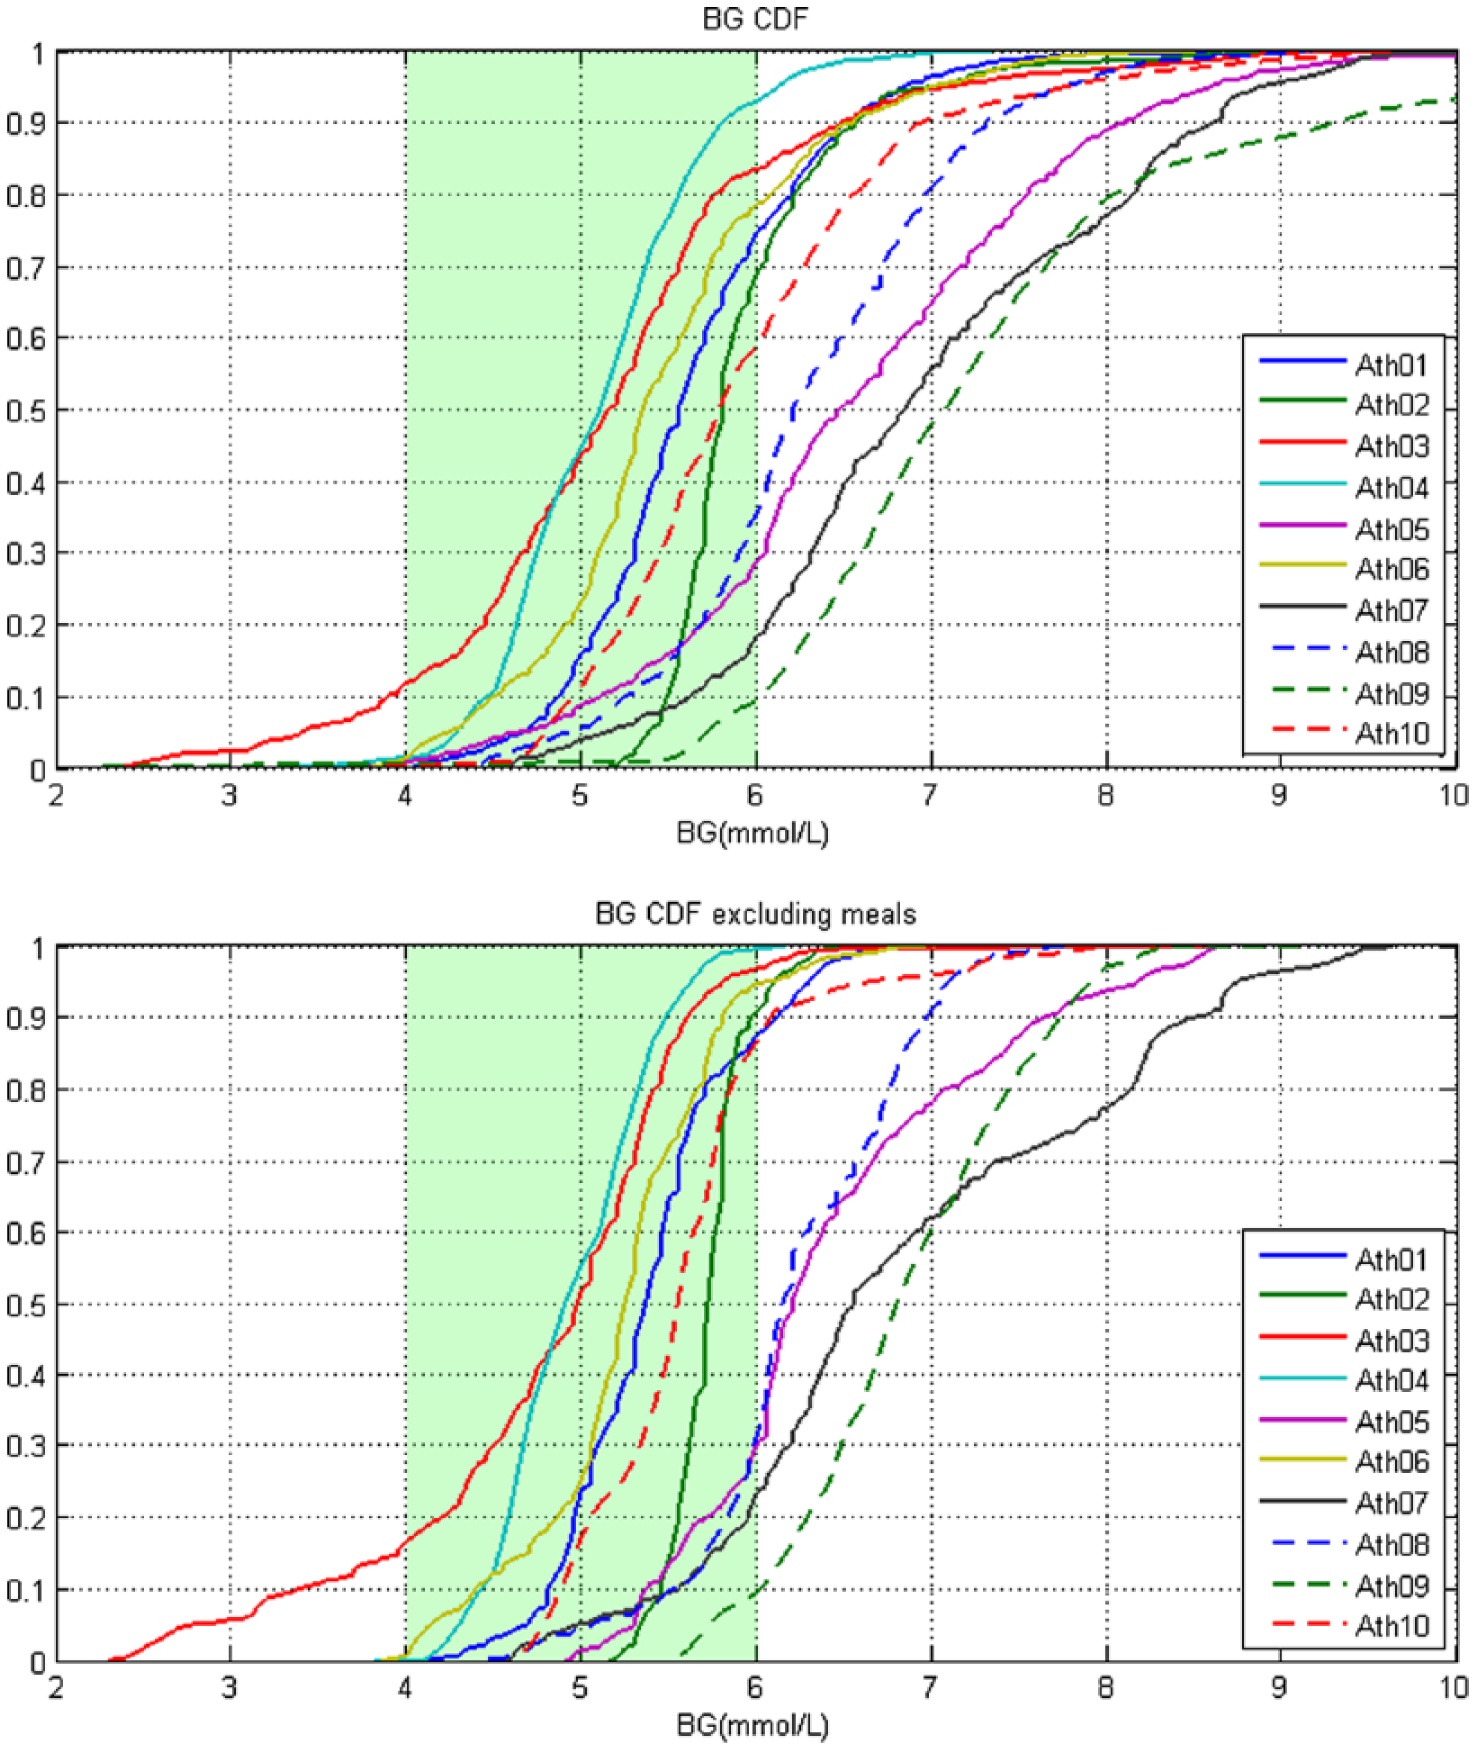
Cumulative distribution plots of measured CGM values. The top plot is the cumulative distribution of the entire averaged CGM signal. The bottom plot is the CGM signal with 2 hours from the beginning of each meal and snack removed. The green band represents the normal range.
All but 4 participants consumed on average an amount of carbohydrate that was between 45 and 65% of their recommended daily calorie intake. Ath03, Ath05, and Ath09 did not reach the minimum recommended amount of carbohydrate. Ath08 consumed more than 65% of their recommended intake as carbohydrate. All participants achieved their recommended fiber intake of >25 g. Some participants, such as Ath07 and Ath08, have a very low fiber to sugar ratio and nearly double the recommended intake of added sugars (Figure 6). Ath03 consumed on average ~150 g of carbohydrate less than the lower recommended limit, 1770 kcal less than required (Table 2) and was the only participant to demonstrate a significant amount time below 4.0 mmol/L.
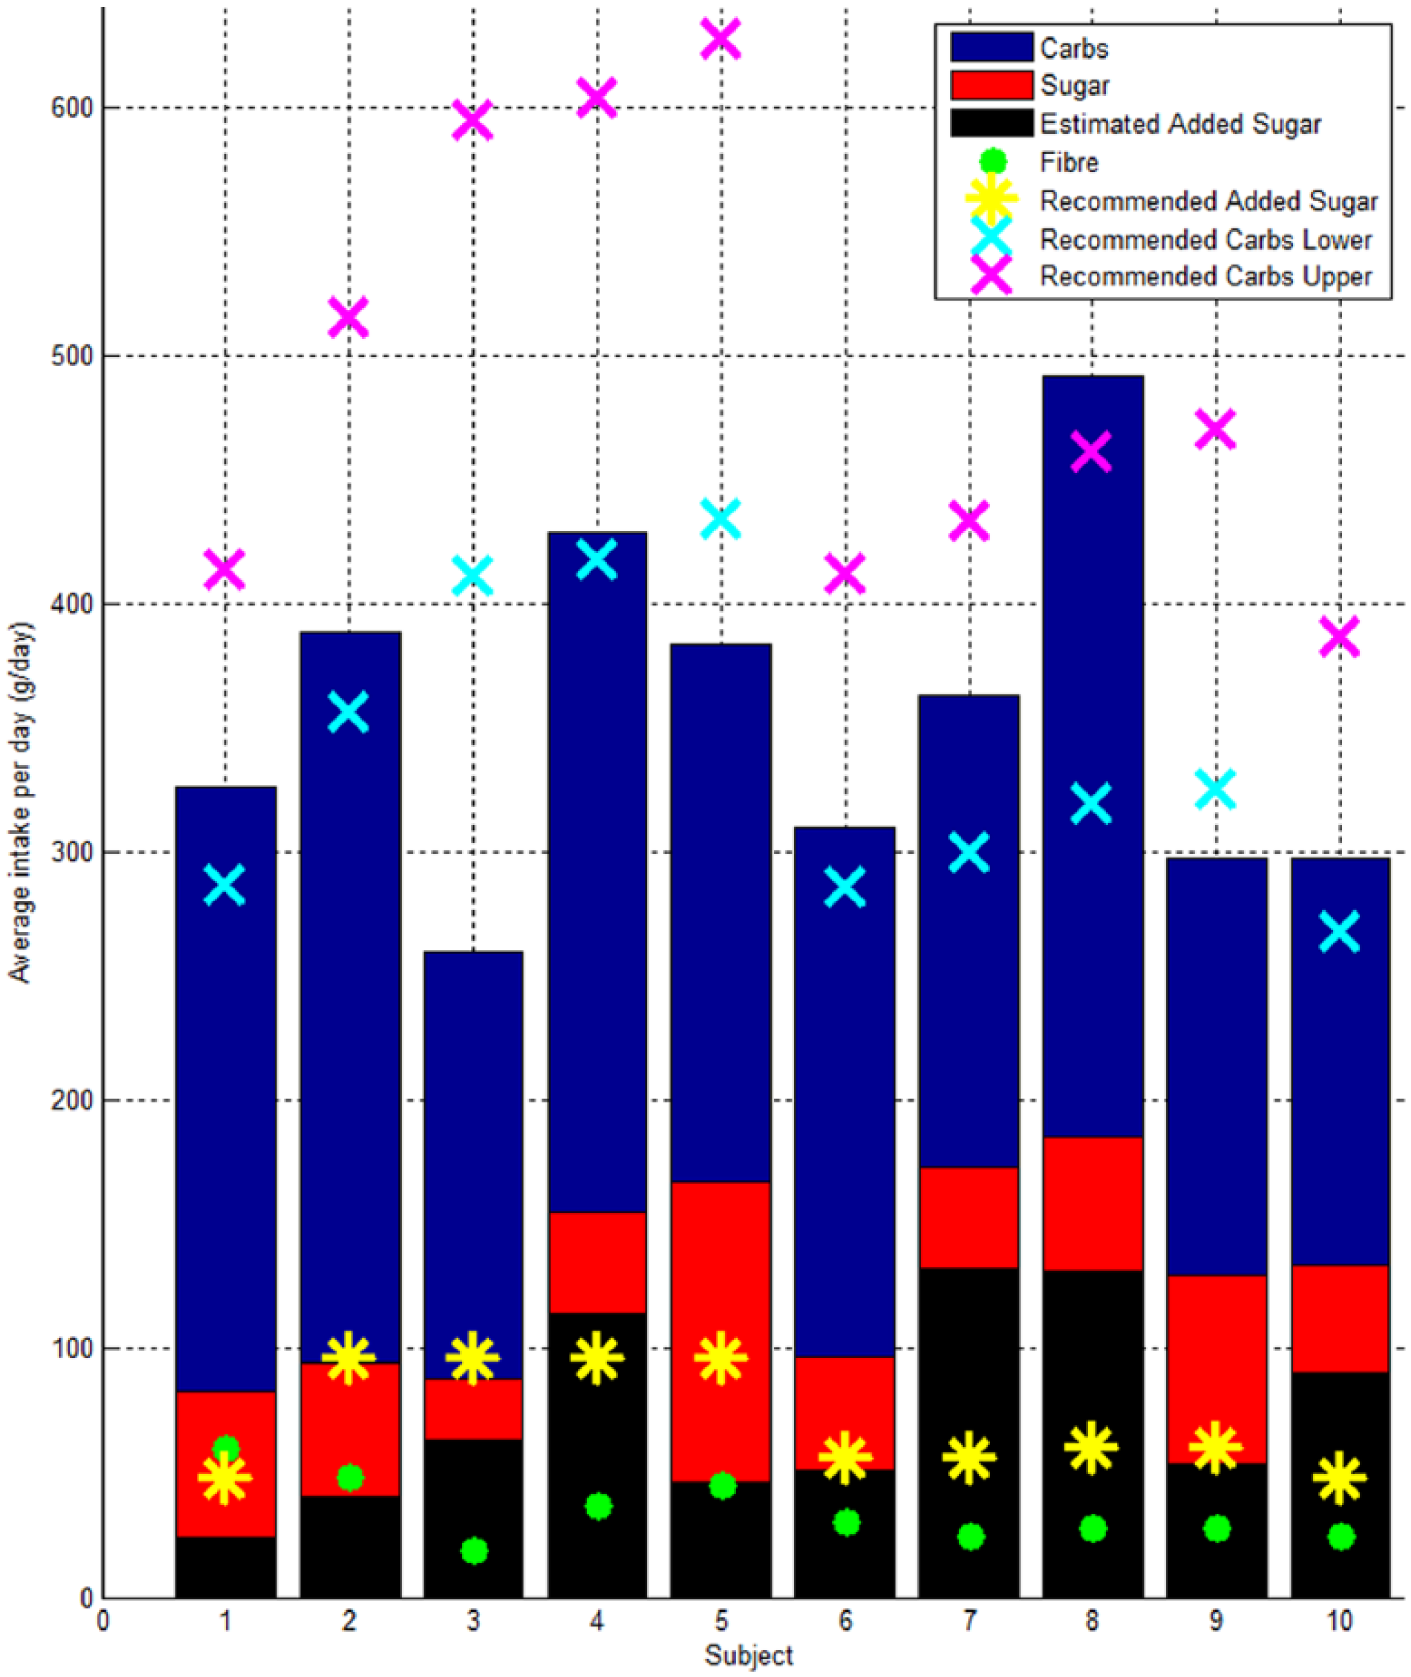
Bar plot showing the average intake per day of carbohydrate, sugar, fiber, and the recommended daily intake of carbohydrate, upper (65% of calorie intake) and lower (45% of calorie intake).
Table 3 shows Ath05, Ath07 and Ath09 have elevated fasting glucose within the prediabetes range 5.6-6.9 mmol/L suggested by the ADA. However, none of the subjects met the prediabetes criteria of PPG > 7.8 mmol/L. Although this criteria is based on the BG 2 hours after a 75 g glucose tolerance test rather than after an uncontrolled meal. The mean PPGR ranges from 0.2 to 2.0 mmol/L.hr displaying a wide range intra and inter of carbohydrate sensitivity. High PPGR did not necessarily correlate with time out side of the 4.0-6.0 mmol/L band.
Summary Table of Measured Physical and Metabolic Variables.
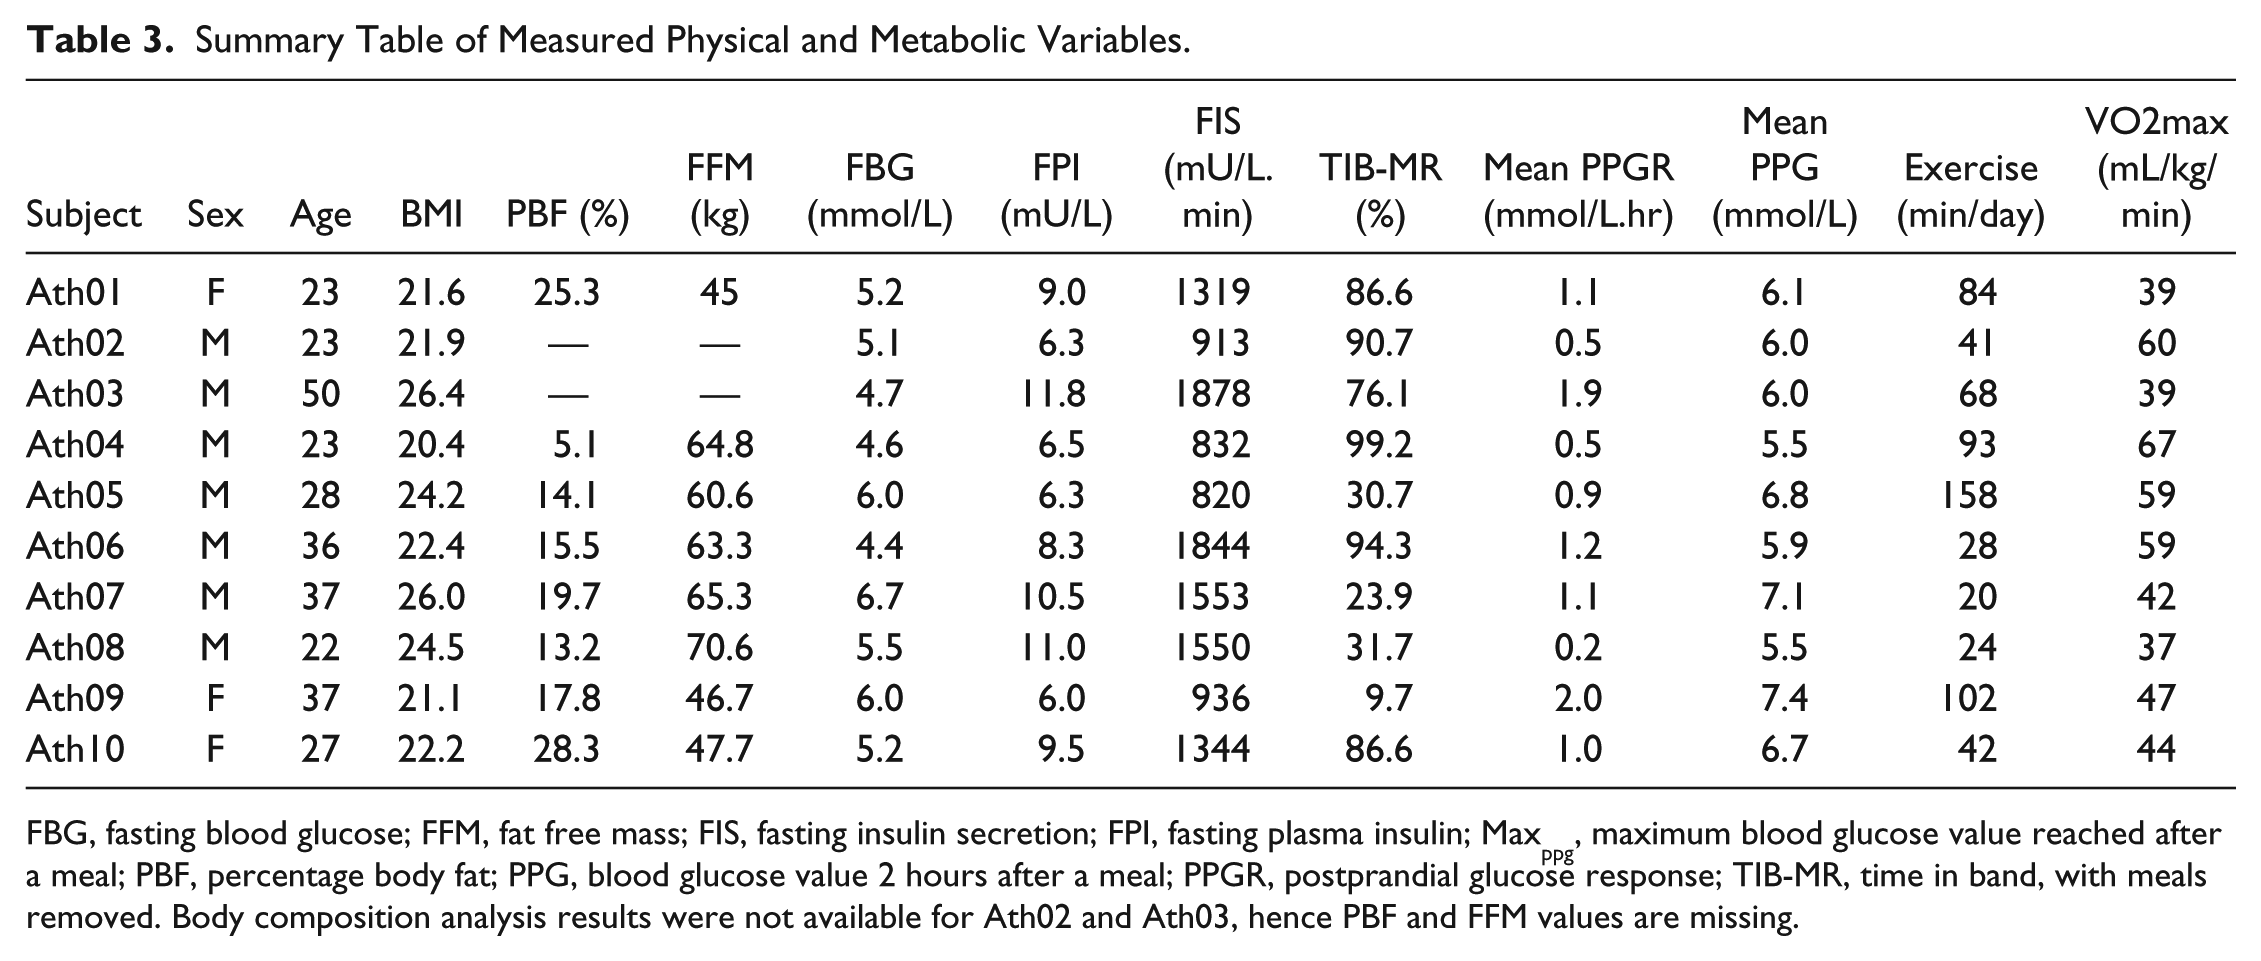
FBG, fasting blood glucose; FFM, fat free mass; FIS, fasting insulin secretion; FPI, fasting plasma insulin; Maxppg, maximum blood glucose value reached after a meal; PBF, percentage body fat; PPG, blood glucose value 2 hours after a meal; PPGR, postprandial glucose response; TIB-MR, time in band, with meals removed. Body composition analysis results were not available for Ath02 and Ath03, hence PBF and FFM values are missing.
Discussion
Physical training is known to improve insulin sensitivity, both immediately postexercise (up to 2 hrs) and through multiple adaptations in glucose transport and metabolism. 16 Therefore, it could be expected high BG would not be frequently seen in athletes and low BG would be of greater concern due to increased energy expenditure. However, this hypothesis does not appear to be the case in the data we have collected.
In particular, 4/10 subjects spent more than ~70% of the total monitoring period with SG > 6.0 mmol/L even with the 2-hour period after meals removed. Only 1 athlete experienced a significant time below 4.0 mmol/L and this behavior appears largely due to a considerably decreased calorie intake compared to recommended guidelines.
Ath09 and Ath05 undertook the most exercise during the monitoring period, averaging 102 and 158 min/day respectively. This high training load could have contributed to the low time in the 4.0-6.0 mmol/L band, as exercise is known to increase BG and induce hyperglycemia and hyperinsulinemia as a result of this catecholamine response.17,19,20 Both subjects have the lowest FPI and insulin secretion recorded suggesting efficient glucose uptake. In addition, both achieved VO2max values that put them in the excellent category based on their gender and age.
Ath07 and Ath08 carried out the least amount of exercise during the monitoring period only averaging 20 and 24 min/day of exercise, while over consuming added sugars 1 and Ath08 over consuming on the recommended carbohydrate intake. Lowering physical activity is known to impact the glycemic control of healthy individuals and the increased insulin sensitivity witnessed due to training wanes with 5 days of detraining.16,40-42 The large amount of time spent out of band by Ath07 and Ath08 is likely to be attributed to these diet and lifestyle choices. This conclusion is supported by Ath07 and Ath08 showing the highest FPI levels and FIS and only achieving average or above average category VO2max levels based on gender and age.
An individual’s tolerance of carbohydrate is highly variable and is related to a number of factors including age and genetics.43,44 A differing ability to tolerate carbohydrates in this cohort is demonstrated with the wide range of cohort values of mean PPGR and mean PPG, 0.2-2.0 mmol/L.h and 5.5-7.4 mmol/L respectively. Also PPGR and PPG do not necessarily correlate with time in band or FBG. A subject can achieve good overall control or even experience low BG, such as Ath03, but still demonstrate a high mean PPGR indicating a high sensitivity to carbohydrates. A subject like Ath09 also appears to have a very high sensitivity to carbohydrates achieving high PPGR and low time in band while under consuming on the recommended carbohydrate intake. However, a subject like Ath04 displays a very high tolerance of carbohydrates, achieving the greatest time in band and very low PPGR, while still over consuming added-sugars. It is interesting to note that normalizing results by grams of carbohydrate consumed did not change the trends seen.
Athletes are traditionally encouraged to consume high carbohydrate diets to replenish muscle glycogen stores and improve performance, with a particular focus on postexercise carbohydrate consumption.13-15 However, this advice may be negatively impacting the blood sugar levels of athletes predisposed to have a low tolerance of carbohydrates. In addition it is unlikely that low BG in day to day life is a real concern for athletes, unless they are significantly under consuming calories. Hence, the potential for a more personalized nutrition plan aided by CGM to optimize the BG levels during different phases of athletes training is highlighted by these results.
This study warrants further investigation on the recommend diets and the BG levels of athletes, in particular those in the subelite category studied here. Subelite athletes are unlikely to have the same nutritional and dietary support from trained professionals as elite athletes. Hence, their nutritional intakes are more perhaps likely to be suboptimal, as demonstrated in this study.
Limitations
This study is limited by the small cohort size. However, this initial pilot investigation has highlighted some interesting points where there is potential to optimize an athlete’s diet. Hence, it has raised questions where further studies are thus justified.
A second limitation is that activity was only monitored by self-reporting in future studies it would be much better to use a specific activity monitoring device to capture energy expenditure more accurately. Equally, activity could be directly controlled in a more homogenous cohort, in a more strictly controlled study than this pilot investigation.
Conclusion
Physical training is known to significantly increase insulin sensitivity and improve PPG and PPGR. Therefore, it could be expected sustained high BG during free living would not be frequently seen in athletes and low BG would be of greater concern due to increased energy expenditure. However, this hypothesis does not appear to be the case in the data we have collected. When the SG profiles of 10 trained, subelite athletes were analyzed over a 6 day monitoring period 4/10 athletes studied spent more than 70% of the total monitoring time above 6 mmol/L even with the 2-hour period after meals removed. FBG was also in the range of prediabetes for 3/10 athletes as defined by the ADA. Only 1 participant spent substantial time below 4 mmol/L and this was largely due to a significantly lower overall calorie intake compared to recommendations. A differing ability to tolerate carbohydrates in this cohort is demonstrated with the wide range of cohort values of mean PPGR and mean PPG, 0.2-2.0 mmol/L.h and 5.5-7.4 mmol/L respectively. Therefore, a diet rich in carbohydrates may not be beneficial in some athletes, especially as low BG is unlikely to be of concern to an athlete consuming adequate calorie intake. This study provides a unique insight in to the day to day glucose levels of athletes that could only be achieved through the use of CGM devices highlighting the need for further investigation on the recommend diets of athletes to better determine the causes and impact of the hyperglycemia seen on health and performance.
Footnotes
Abbreviations
ADA, American Diabetes Association; BG, blood glucose; CGM, continuous glucose monitoring; FBG, fasting blood glucose; FFM, fat free mass; FIS, fasting insulin secretion; FPI, fasting plasma insulin; OGTT, oral glucose tolerance test; PBF, percentage body fat; PPG, postprandial glucose; PPGR, postprandial glucose response; SG, sensor glucose; TIB, time in band; T2DM, type 2 diabetes; WHO, World Health Organization.
Declaration of Conflicting Interests
The author(s) declared no potential conflicts of interest with respect to the research, authorship, and/or publication of this article.
Funding
The author(s) disclosed receipt of the following financial support for the research, authorship, and/or publication of this article: This study was supported by an eTIME IRSES EU FP7 #318943 grant, University of Canterbury doctoral scholarship, and the Sadie Balkind Scholarship.
References
Supplementary Material
Please find the following supplemental material available below.
For Open Access articles published under a Creative Commons License, all supplemental material carries the same license as the article it is associated with.
For non-Open Access articles published, all supplemental material carries a non-exclusive license, and permission requests for re-use of supplemental material or any part of supplemental material shall be sent directly to the copyright owner as specified in the copyright notice associated with the article.