
Abstract
Background:
Frequent blood glucose level (BGL) monitoring is essential for effective diabetes management. Poor compliance is common due to the painful finger pricking or subcutaneous lancet implantation required from existing technologies. There are currently no commercially available non-invasive devices that can effectively measure BGL. In this real-world study, a prototype non-invasive continuous glucose monitoring system (NI-CGM) developed as a wearable ring was used to collect bioimpedance data. The aim was to develop a mathematical model that could use these bioimpedance data to estimate BGL in real time.
Methods:
The prototype NI-CGM was worn by 14 adult participants with type 2 diabetes for 14 days in an observational clinical study. Bioimpedance data were collected alongside paired BGL measurements taken with a Food and Drug Administration (FDA)-approved self-monitoring blood glucose (SMBG) meter and an FDA-approved CGM. The SMBG meter data were used to improve CGM accuracy, and CGM data to develop the mathematical model.
Results:
A gradient boosted model was developed using a randomized 80-20 training-test split of data. The estimated BGL from the model had a Mean Absolute Relative Difference (MARD) of 17.9%, with the Parkes error grid (PEG) analysis showing 99% of values in clinically acceptable zones A and B.
Conclusions:
This study demonstrated the reliability of the prototype NI-CGM at collecting bioimpedance data in a real-world scenario. These data were used to train a model that could successfully estimate BGL with a promising MARD and clinically relevant PEG result. These results will enable continued development of the prototype NI-CGM as a wearable ring.
Introduction
It is estimated that 463 million adults worldwide are living with diabetes and this is expected to increase to 700 million by 2045. 1 No cure for diabetes currently exists. Diabetes management is centered on blood glucose level (BGL) normalization to reduce the risk of associated long-term complications such as retinopathy, end-stage kidney disease, diabetic foot disease, and atherosclerotic cardiovascular disease.2,3
Blood glucose level monitoring is an essential part of BGL normalization. Self-monitoring blood glucose (SMBG) meters and continuous glucose monitoring systems (CGMs) are the two methods currently used for BGL monitoring. 4 While SMBG meters are traditional tools, CGMs provide additional information to guide management decisions, enabling better glycemic control and reduced hypoglycemic event prevalence. 5 Both technologies are invasive, either requiring a finger prick to obtain a blood sample or subcutaneous implantation of a lancet. 4 This can cause discomfort and pain, 6 an increased risk of infection or tissue damage, 7 and a reduced adherence to BGL monitoring. Suboptimal BGL monitoring is common, precludes effective BGL normalization, and increases the risk of long-term complications. 8 A non-invasive CGM (NI-CGM) could address these limitations and improve health outcomes and quality of life for people living with diabetes. 9 Although no NI-CGMs are currently commercially available, several promising technologies are under development. 10
Bioimpedance is one of the primary technologies being considered for use as an NI-CGM.11-14 It is routinely used for human body composition analysis as it is safe, easy to use, portable, reliable, rapid, and low cost.15-17 A correlation between bioimpedance and BGL has been demonstrated under controlled conditions.18-20 Previous attempts to develop an NI-CGM using this technology have, however, resulted in less accurate BGL estimations than existing invasive CGMs.21-23 Pendra (Pendragon Medical Ltd, Zurich, Switzerland) was the first bioimpedance-based NI-CGM developed and taken to market. 24 This device was ultimately discontinued due to insufficient accuracy in a post-market validation study and limitations with calibration and use while sweating or moving. 14 Addressing these identified challenges with bioimpedance could enable production of an accurate NI-CGM.
Bioimpedance is the opposition to the flow of an applied alternating current through the tissue of a living organism. 25 It is comprised of resistance and reactance. Resistance is the dissipation of energy as current flows through intracellular and extracellular ionic solutions and reactance is the capacitance (energy storage) from soft tissue, cell membranes, and organelles.26,27 Bioimpedance is frequency-dependent as the penetration of applied current through cells varies with frequency. It will preferentially pass through extracellular fluid at low frequency (<5 kHz) and can penetrate all fluid compartments at high frequency (>100 kHz).28,29 Measuring bioimpedance over a range of frequencies (bioimpedance spectroscopy) allows for information to be generated from the multiple different biological tissues through which the current passes, rather than only one pathway if a single frequency is used.6,29
Although the biological relationship between bioimpedance and BGL is not yet fully understood, there is one suggested hypothesis. 10 The red blood cell membrane contributes to the reactance of a bioimpedance measurement, whereas the intracellular and extracellular fluids contribute to the resistance.30,31 Increases in plasma glucose concentration increase osmolarity and drive movement of intracellular water into the extracellular space. The resultant dilution of sodium ions causes redistribution of intracellular potassium ions into the extracellular space.32-34 These changes in ion concentration alter the permittivity and conductivity of the red blood cell membrane which is suggested to be measurable using bioimpedance. 10 Other biological processes may confound this suggested mechanism. The rationale for use of bioimpedance to estimate BGL is based on this hypothesis and the identified experimental correlation between the two under controlled conditions.18-20
The current study used a prototype NI-CGM in the form of a wearable ring that used bioimpedance technology. The prototype NI-CGM was used in an observational clinical study to collect bioimpedance data from a cohort of people with diabetes with the aim of developing a mathematical model to estimate BGL.
Methods
Study Device
A prototype NI-CGM developed by Opuz Pty Ltd (Sydney, Australia) was used in this study (Figure 1a). A bioimpedance sensor with a tetrapolar electrode system was used to take bioimpedance measurements across the third proximal phalanx (base of the third finger; Figure 1b). Each prototype NI-CGM was custom fit to a participant to maximize contact and minimize movement between skin and the electrodes, while also maintaining user comfort. The electrode system was optimized to maximize the signal quality, sensitivity, and repeatability of bioimpedance measurements, 35 which were experimentally validated. Bioimpedance measurements were described by magnitude and phase and were taken at 20 frequencies (10 Hz-200 kHz). The prototype NI-CGM was IEC 60601 compliant, biocompatible, and battery powered.
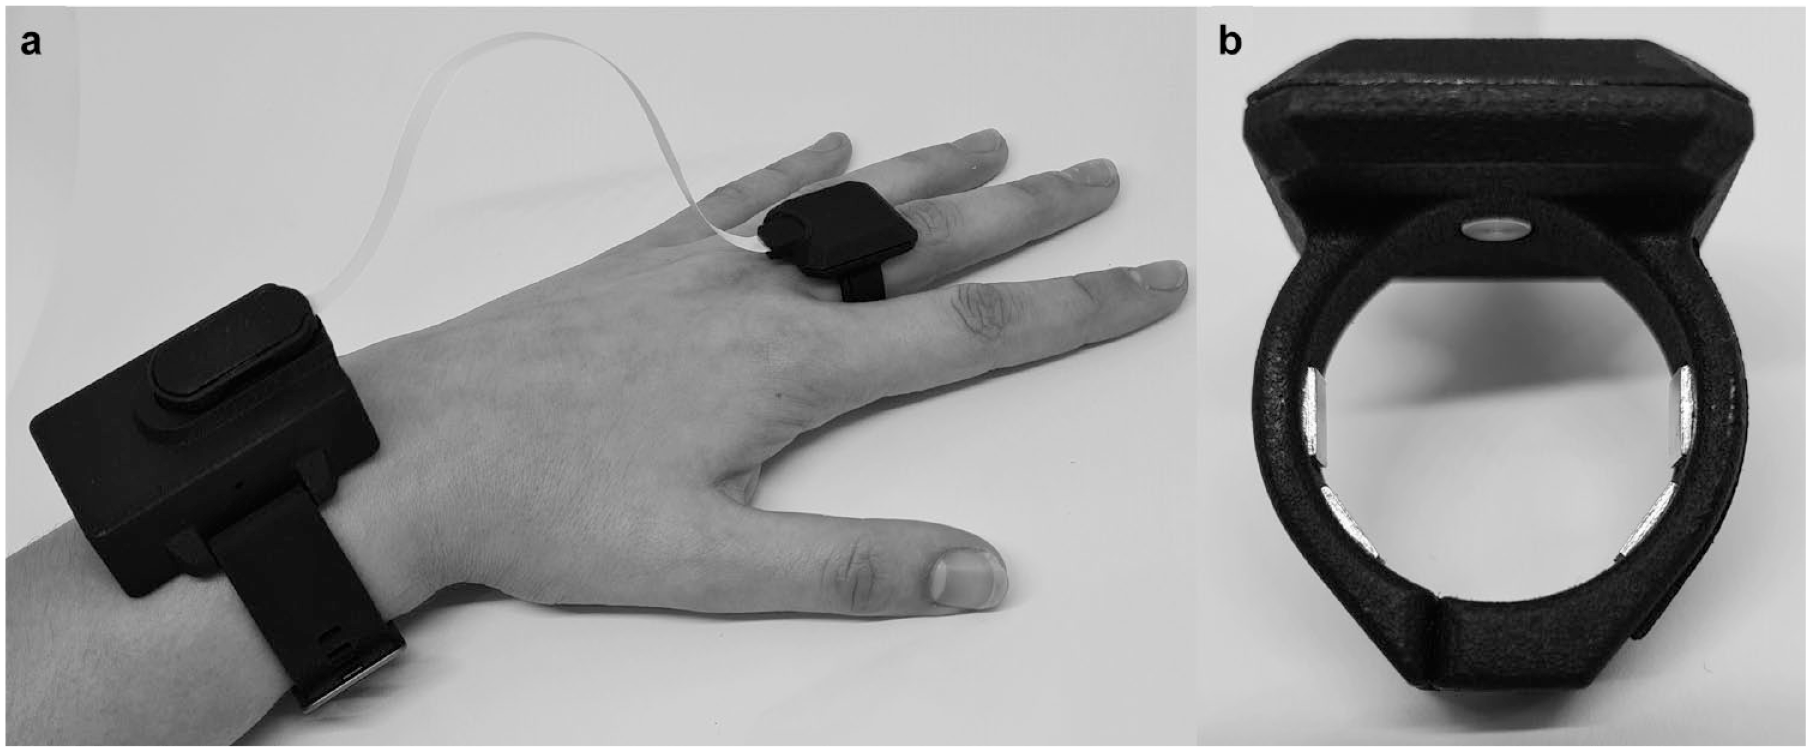
(a) The prototype NI-CGM used in this study as worn by a study participant. (b) A closeup of the prototype NI-CGM used in this study, which shows the electrode system and temperature sensor which interface with a finger. Abbreviation: NI-CGM, non-invasive continuous glucose monitoring system.
During bioimpedance measurements, the prototype NI-CGM also measured skin temperature with a custom-built temperature sensor and movement and orientation with a custom-built accelerometer, due to their potential impacts on the bioimpedance data.
Measurement data (bioimpedance, temperature, and accelerometer) were stored internally and communicated periodically via Bluetooth Low Energy to an iOS app that was built for the clinical study. The iOS app was designed for ease of use and to enable maximum participant compliance. It enabled user-driven measurements and recording of matched BGL data taken with the other study devices. All measurement and BGL data were uploaded from the iOS app to the cloud. This allowed real-time monitoring of study participants using custom-built software to boost compliance and enable rapid troubleshooting which were both critical to increasing the size and quality of the resultant study dataset.
Study Population
The study was approved by the Bellberry Ltd Human Research Ethics Committee (Adelaide, Australia; July 21, 2020; reference number 2020-02-09) and was listed on the ClinicalTrials.gov clinical trial registry (identifier: NCT04946188). A cohort of 14 participants (12 men and 2 women; median age 60; age range 22-70) with physician-diagnosed type 2 diabetes were recruited for the study (Supplementary Table S1). These participants satisfied the study inclusion and exclusion criteria and provided written and oral informed consent.
Study Design
The study was conducted over a 14-day period. Participants wore the prototype NI-CGM continually, except while charging, bathing, or during strenuous exercise or water-based activities. Participants were not required to fast nor make any adjustments to their daily habits, diet, medication, or routine care. The BGL data were collected during the study using both an SMBG meter (Accu-Chek Mobile; Roche, Basel, Switzerland) and a CGM (FreeStyle Libre; Abbott, Abbott Park, Illinois, USA).
Two types of measurements were taken during the study: user-driven measurements and automatic measurements. User-driven measurements were simultaneously taken with the prototype NI-CGM, SMBG meter, and CGM at least seven times per day. This included before and after eating, which are recommended times for SMBG monitoring and coincide with BGL fluctuations. 36 User-driven measurements were taken using the study iOS app, which monitored movement to ensure participants were sitting still and resting their arm for the measurement duration (Figure 2). Automatic measurements were also taken with the prototype NI-CGM and CGM every 10 and 15 minutes, respectively.
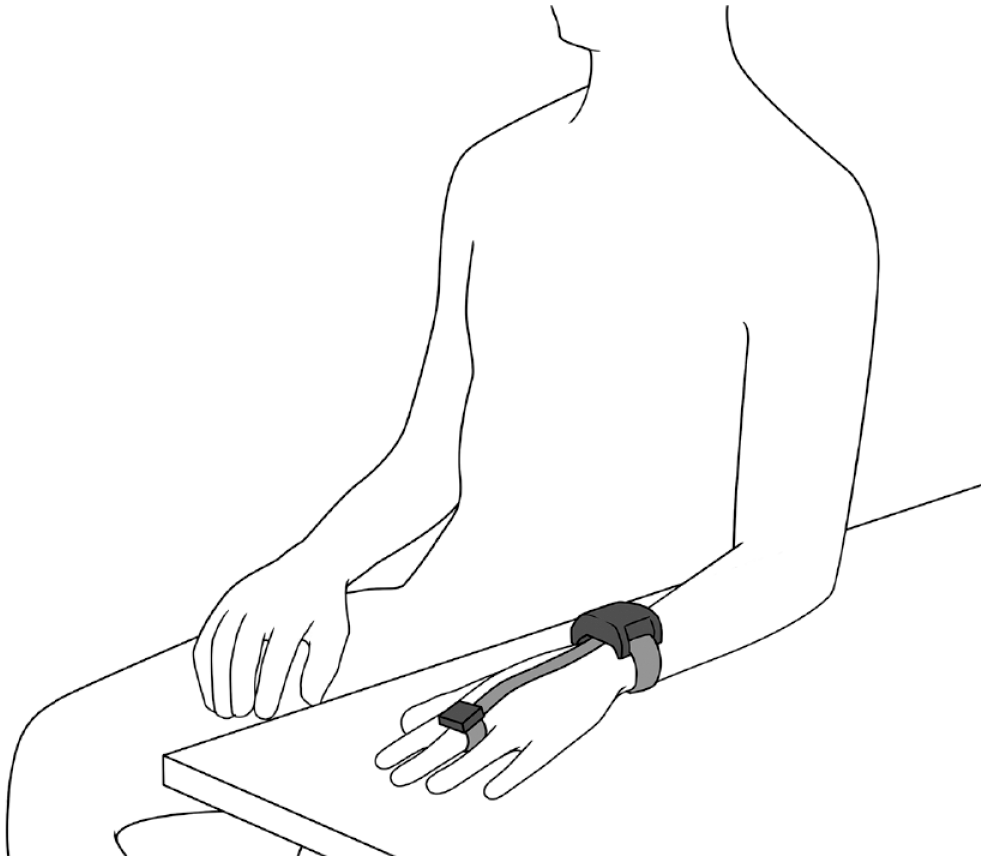
The position that participants had to maintain for the duration of user-driven measurements taken during the study with the iOS app.
Participants attended two onsite sessions during the study during which user-driven measurements were taken every 20 minutes over 4 hours. These were completed at the midway point and on the last day of the study. The SMBG meter data from these sessions were used to calculate the bias and lag of CGM measurements. This information was used to improve CGM accuracy, generating an adjusted-CGM dataset. The adjusted-CGM dataset was subsequently used to develop the BGL mathematical model.
Results and Discussion
Data Collection
Data were collected with the prototype NI-CGM, SMBG meter, and CGM over the 14-day study period. The median (interquartile range; Q1-Q3) of BGL data collected across all study participants was 142 mg/dL (73-180 mg/dL) with the SMBG meter and 128 mg/dL (101-160 mg/dL) with the CGM (Supplementary Table S2). The BGL data were skewed toward normal BGL values (72-140 mg/dL) with a tail in the hyperglycemic range (>140 mg/dL). Negligible data were collected in the hypoglycemic range (<72 mg/dL); however, this was expected due to the study inclusion criteria (Figure 3). For eight participants, the CGM became detached and was subsequently replaced mid-study.
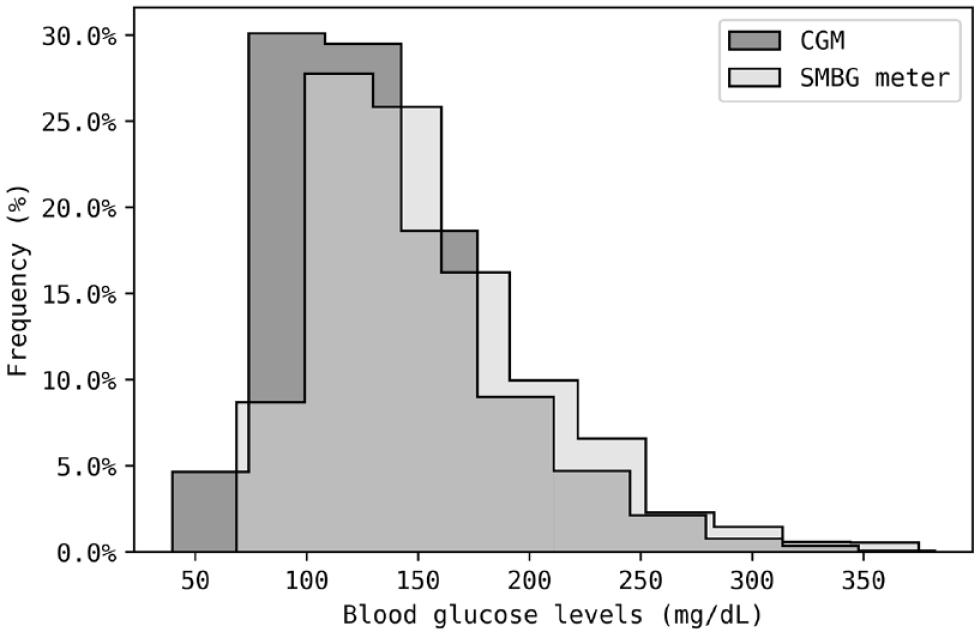
Percentage frequency histogram of all BGL measurements obtained from the SMBG meter and CGM in this study, grouped into ten bins. The SMBG meter and CGM data were normalized to account for differences in sample size. Both devices were positively skewed in their data, with tails in the hyperglycemia range. For both devices, the modal class is around 125 mg/dL, suggesting participants have well controlled type 2 diabetes. Abbreviations: BGL, blood glucose level; SMBG, self-monitoring blood glucose; CGM, continuous glucose monitoring system.
Bioimpedance data collected with the prototype NI-CGM underwent quality control to remove likely anomalous data which were generated in circumstances such as incorrect device fitment. Data collected when the NI-CGM was not worn by a participant (indicated by an impedance magnitude greater than 107 Ohms), where the phase angle changed substantially from negative to positive mid-measurement, and outliers identified as above the 95% percentile at each frequency were removed. A total of 13 318 automatic measurements and 1489 user-driven measurements were taken across the 14 participants. After quality control, there were 6485 and 893 measurements remaining, respectively. See supplementary material for an example of the bioimpedance dataset following quality control (Supplementary Figure S1).
Bias and Lag Correction
The learning and performance of any mathematical model is enhanced by having a sufficiently large and varied dataset and an accurate measure of the defined target (BGL). The SMBG meter dataset represents the criterion standard; however, its use as the model target was limited by sparsity. The CGM produced a large BGL dataset due to the frequent automatic measurements; however, the SMBG meter dataset is more accurate. The inaccuracy of the CGM is estimated using bias and lag. Bias is a systematic shift in measured BGL which exists due to variability in the CGM calibration process and user characteristics. The CGM measures glucose via interstitial fluid rather than directly from blood, and hence, there is often a user-specific lag in transfer of glucose from blood to the interstitial fluid.37,38 Corrections for CGM bias and lag were thus made, using SMBG meter data to improve the accuracy of the large CGM dataset (Supplementary Table S3). Linear smoothing achieved this using the Python (version 3.7) SciPy (version 1.7.1) library. A global search of various bias (–90 to 90 mg/dL in 0.9 mg/dL increments) and lag (0-40 minutes in 0.1 minute increments) combinations were performed to minimize the root mean square error between the linear interpolated CGM data and the SMBG data collected during the onsite sessions. This was a two-dimensional optimization, calculating both bias and lag concurrently. This transformation produced the adjusted-CGM dataset which was used for further data analysis.
Backward filling was used to transform CGM data from each onsite visit for 12 participants. Data from the first session was used for transformations back to the start of the study and from the second session for transformations back to the first session (Figure 4a). Two participants did not complete a second onsite visit due to issues with their prototype NI-CGM. Both backward and forward filling was used to transform CGM data from the only onsite visit for these participants back to start and forward to the end of the study, respectively (Figure 4b). A total of 570 SMBG meter and 584 CGM measurements were used in these bias and lag transformations. Bioimpedance data collected during the onsite sessions were subsequently used for model development but not evaluating model performance.
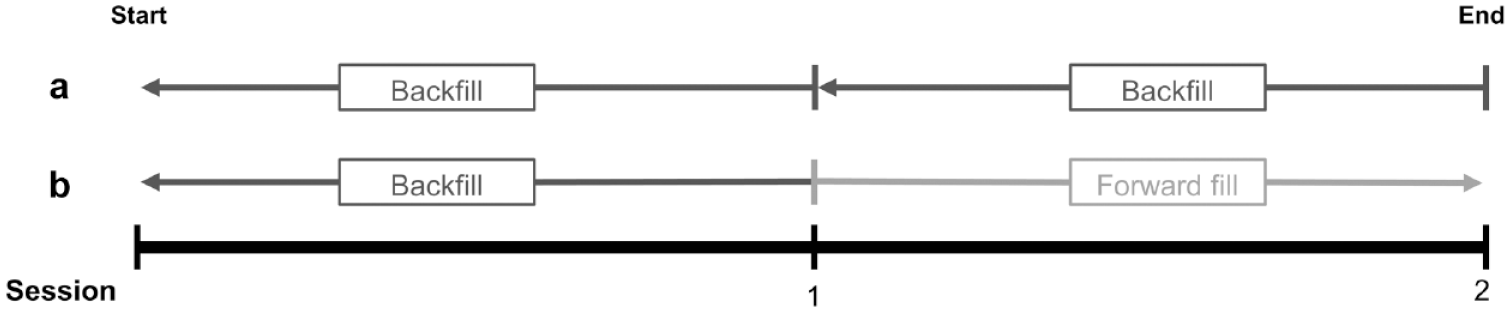
Representation of how bias and lag data were applied to the CGM dataset to create the adjusted-CGM data. (a) Participant attended onsite sessions half-way through and at the end of the study. Outcomes from both sessions were applied to the entire dataset for the days prior (backward fill). (b) Participant attended only the onsite session half-way through the study. Bias and lag were backward filled on CGM data obtained before the onsite session and forward filled after the onsite session. Abbreviation: CGM, continuous glucose monitoring system.
The success of bias and lag transformations was evaluated by comparing the Mean Absolute Relative Difference (MARD) before and after transformation. The MARD is commonly used to assess CGM accuracy against reference values. 39 The comparison between CGM estimations and reference values can be visualized on a Parkes error grid (PEG). As the data are from a clinical perspective, no assumptions on the normality or skewedness were made. The raw CGM dataset had a MARD of 16.5% compared with the SMBG meter dataset, with 65% of estimations in zone A and 35% in zone B on a PEG plot (Figure 5a). The MARD decreased to 10.9% after adjusting the CGM dataset, with 88% of estimations in zone A and 12% in zone B on a PEG plot (Figure 5b). The results from this correction demonstrated that the adjusted-CGM dataset is a closer proxy for SMBG meter data than the raw CGM dataset. Hence, this adjusted-CGM dataset was used for training and validating a model with the bioimpedance data acquired with the NI-CGM.
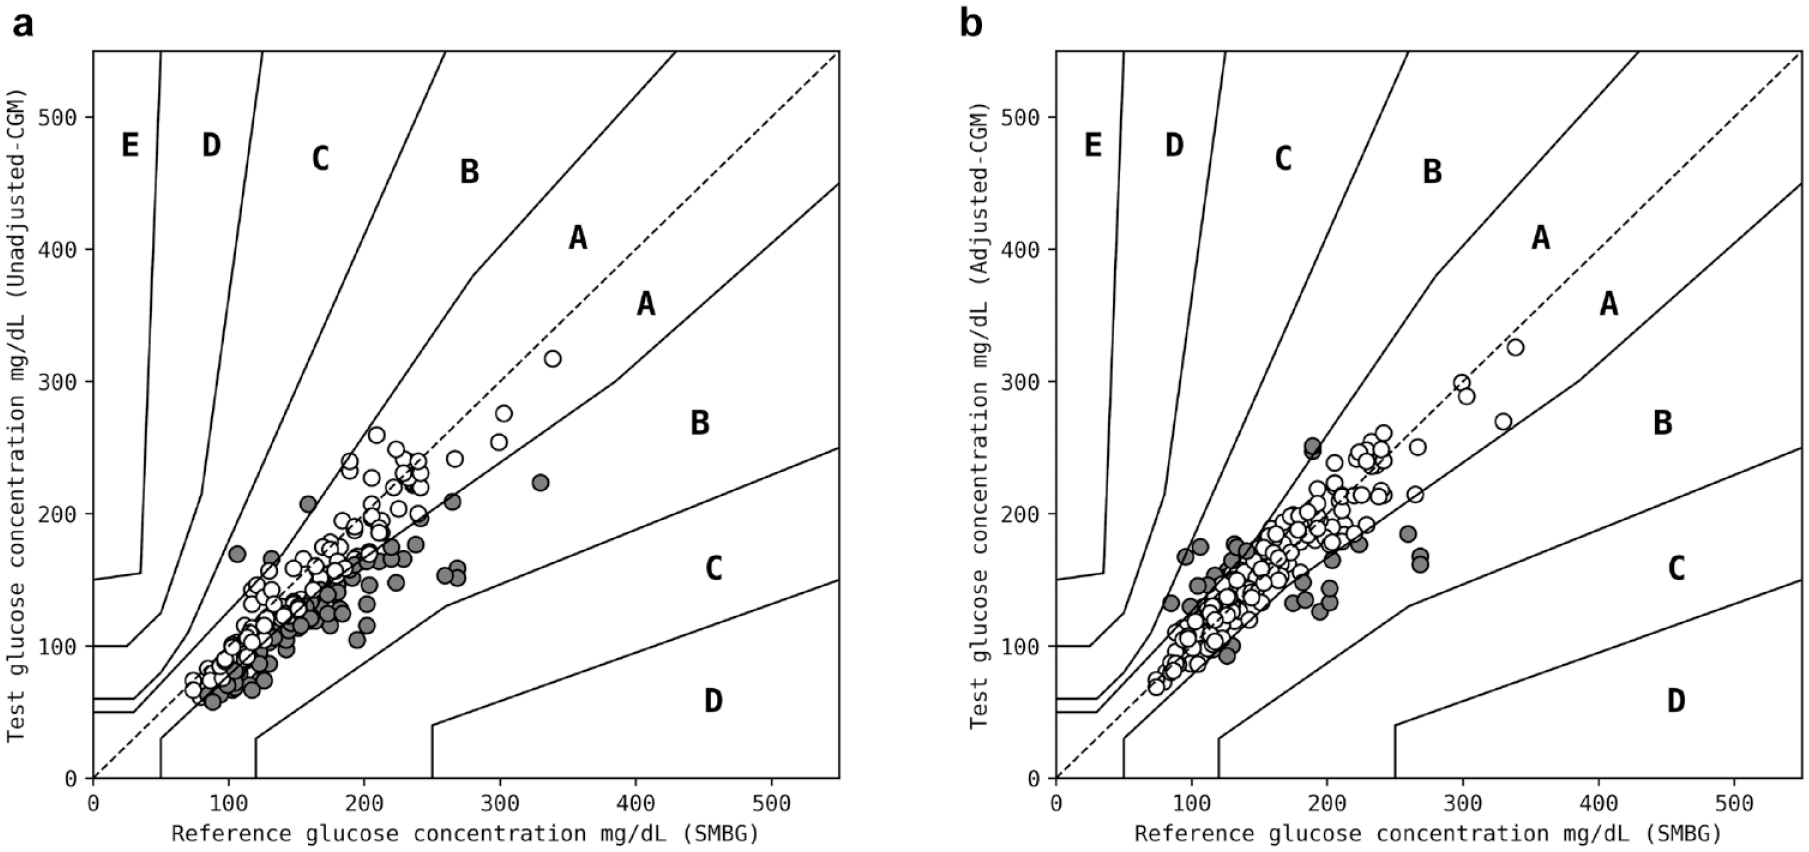
Parkes error grid plots for (a) SMBG meter data against the raw CGM data and (b) SMBG meter data against the adjusted-CGM data. Adjustments were made for bias and lag across each participant to the raw CGM data which produced the adjusted-CGM data. This resulted in improvement from a MARD of 16.5% and 65% of estimations in zone A and 35% in zone B to a MARD of 10.9% and 88% of estimations in zone A and 12% in zone B, respectively. Datapoints in zones A, B, and C are colored white, gray, and black, respectively. Abbreviations: SMBG, self-monitoring blood glucose; CGM, continuous glucose monitoring system; MARD, Mean Absolute Relative Difference.
Model Development
A gradient boosted model was developed using the Python (version 3.7) scikit-learn (version 0.24.2) library. Bioimpedance data (magnitude and phase angle) recorded with the prototype NI-CGM across all 20 frequencies were used as the input and the adjusted-CGM dataset as the target variable. A randomized 80-20 training-test split was used. The model parameters were tuned using fivefold cross-validation on the training set. Following a randomized grid search, the final set of parameters selected were those that minimized the cross-validation root mean square error when evaluated against SMBG meter data. The final model comprised 70 estimators with a maximum depth of eight and a learning rate of 0.1. The model was chosen for this study because it could identify and emphasize subtle relationships in data and could capture non-linearities. These features of the model are important due to the incomplete understanding of the biological relationship between bioimpedance and BGL and the strength of that relationship.
Model Performance
The model performance was evaluated on the test set, a randomized 20% of the total adjusted-CGM dataset. The estimated BGL from the model had a MARD of 17.9%, with 67% of estimations in zone A, 32% in zone B, and 1% in zone C on a PEG plot (Figure 6a). An equivalent PEG plot for the test set is shown in the supplementary material (Supplementary Figure S2). Performance of the model was also evaluated against SMBG meter data, as it was established in this study that adjusted-CGM data are a close proxy for the SMBG meter dataset (Figure 5b). The model was tested against 20% of SMBG meter data, time matched to the adjusted-CGM data used to test the model. The estimated BGL from the model had a MARD of 21.9%, with 56% of estimations in zone A, 42% in zone B, and 2% in zone C on a PEG plot (Figure 6b). The increase in MARD of 4% when compared against the adjusted-CGM dataset may reflect the remaining discrepancy between the adjusted-CGM and SMBG meter data. This discrepancy remains because the model was only trained on adjusted-CGM data and not SMBG meter data (due to the smaller SMBG meter dataset).
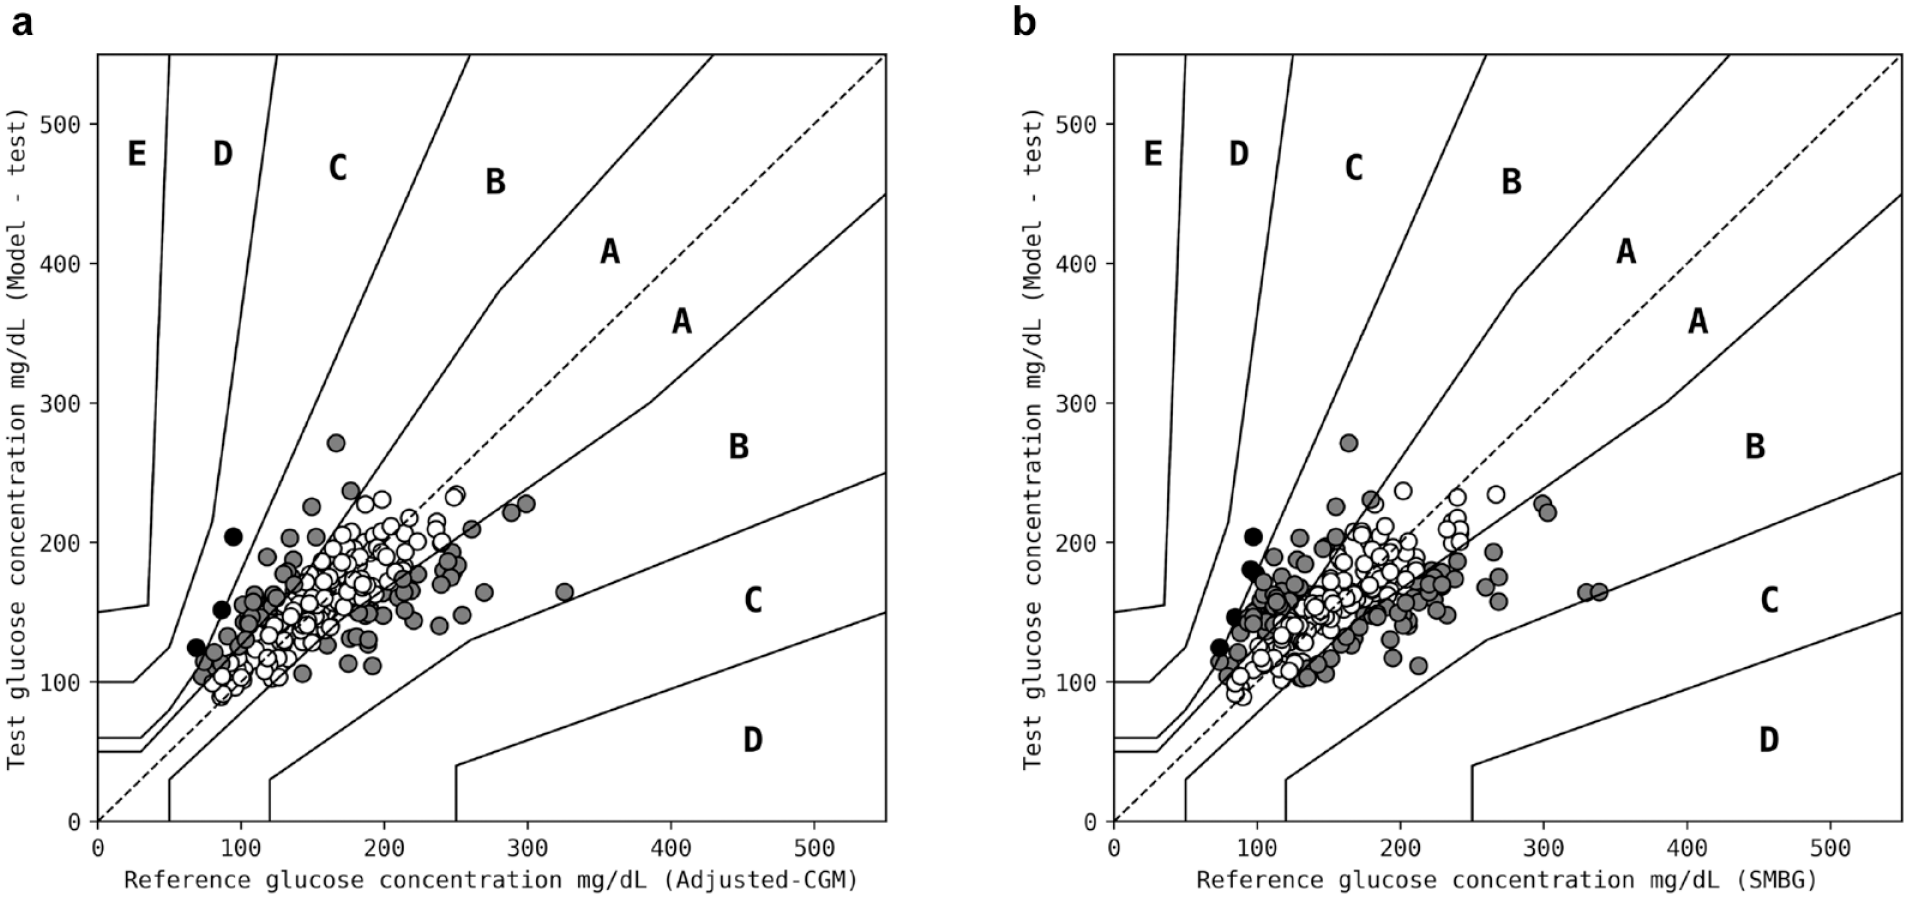
Parkes error grid plots output from the model for (a) adjusted-CGM test data, where the model had a MARD of 17.9% and 67% of estimations in zone A, 32% in zone B, and 1% in zone C; and (b) SMBG meter test data, where the model had a MARD of 21.9% and 56% of estimations in zone A, 42% in zone B, and 2% in zone C. Datapoints in zones A, B, and C are colored white, gray, and black, respectively. Abbreviations: CGM, continuous glucose monitoring system; MARD, Mean Absolute Relative Difference; SMBG, self-monitoring blood glucose.
The required accuracy of SMBG meters for clinical use is defined by the International Organization for Standardization (ISO15197:2013). There is a requirement for 99% of data to fall within zones A and B on a PEG plot which was met by the model when tested against the adjusted-CGM data, and was missed by 1% when tested against the SMBG meters (Table 1). Mean Absolute Relative Difference is the most common metric used for CGM evaluation. A MARD of 10% has been suggested as the recommended accuracy of CGMs for safe use when making insulin-dosing decisions. 40 Mean Absolute Relative Differences of 11.5%, 13.2%, and 16.6% have been determined in studies using the same CGM used in this study.41-43 Other commercially available CGMs have reported MARDs in the range 10.8% to 21.4%. 41 The MARD of 17.9% generated with the prototype NI-CGM when testing against adjusted-CGM data is in the same range seen with other devices, although they were compared against more accurate reference BGLs.
Performance of the Model Developed in This Study When Tested Against Adjusted-CGM Data and SMBG Meter Data.
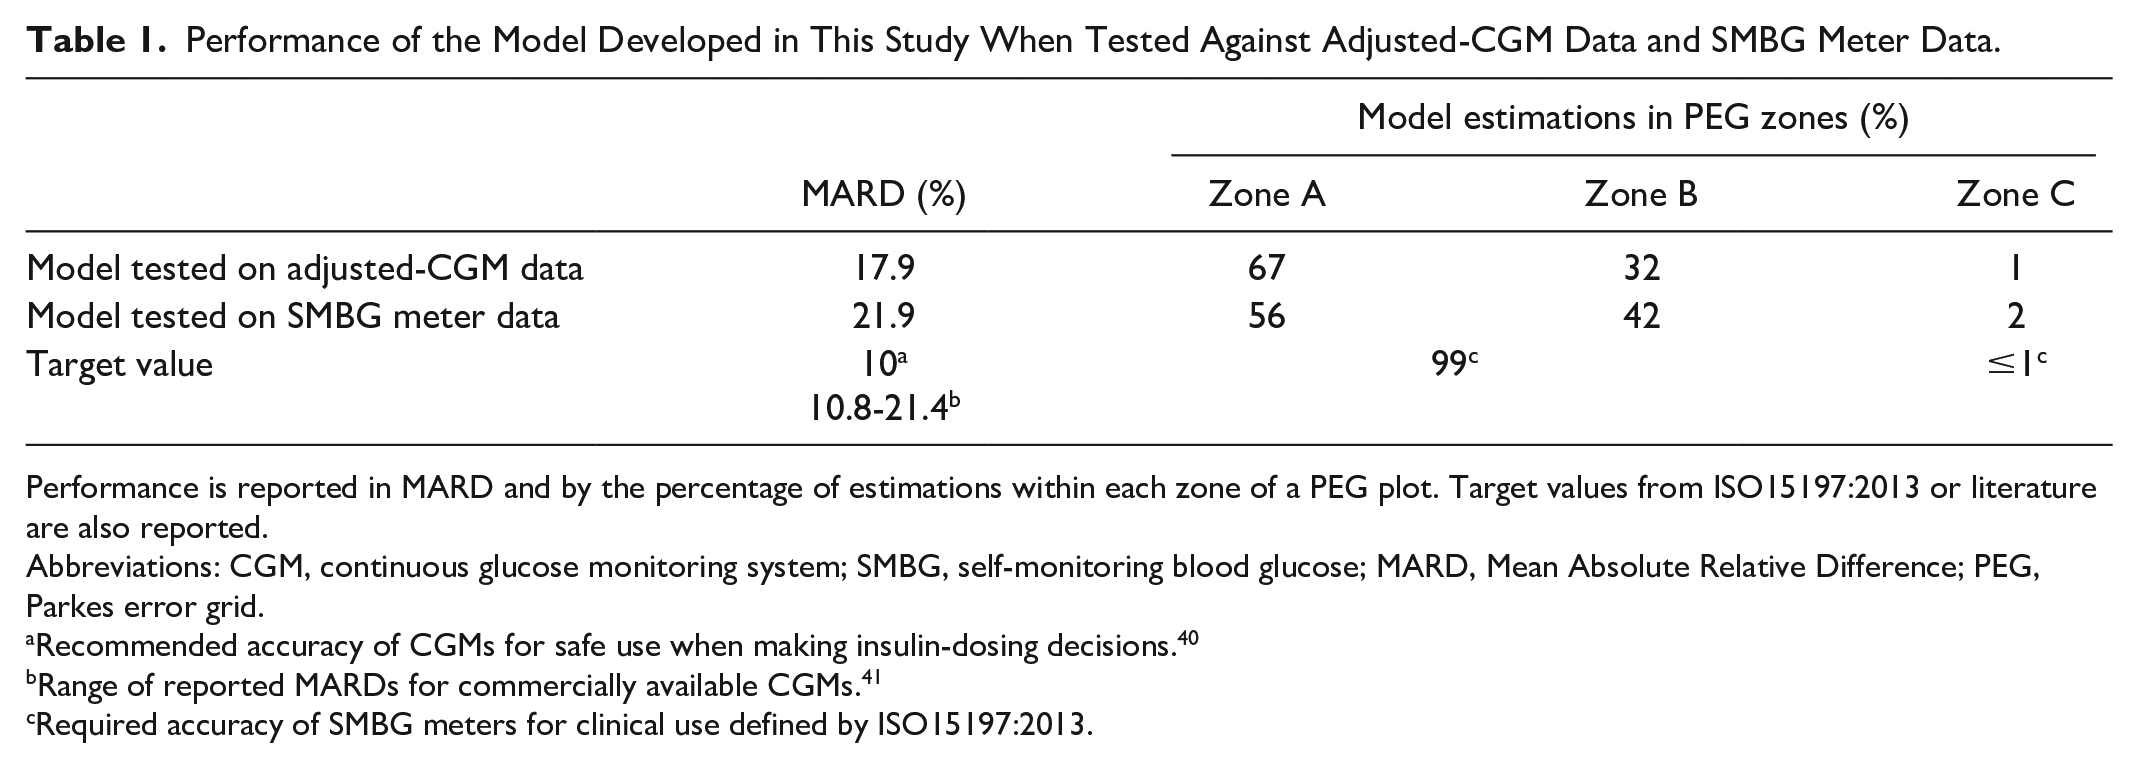
Performance is reported in MARD and by the percentage of estimations within each zone of a PEG plot. Target values from ISO15197:2013 or literature are also reported.
Abbreviations: CGM, continuous glucose monitoring system; SMBG, self-monitoring blood glucose; MARD, Mean Absolute Relative Difference; PEG, Parkes error grid.
Recommended accuracy of CGMs for safe use when making insulin-dosing decisions. 40
Range of reported MARDs for commercially available CGMs. 41
Required accuracy of SMBG meters for clinical use defined by ISO15197:2013.
Although the prototype NI-CGM was designed to minimize inherent variability in recorded bioimpedance, factors other than changes in BGL may influence this dataset. Deconvoluting these other factors could enhance model performance when estimating BGL. Skin temperature and movement data were recorded during all prototype NI-CGM measurements and enabled the entire dataset to be subsampled. Data with high and low temperatures or high maximum and mean movement were sequentially excluded to determine if temperature or movement had an observable impact on the bioimpedance data. This exclusion based on subsampling did not improve model performance (17.9% MARD to 18.0% or 18.4%, respectively), and thus it was determined that neither temperature nor movement had an observable impact. Other factors which are difficult to identify and control for may still contribute to variability in bioimpedance measurements, including the hydration level of a participant or slightly different locations for NI-CGM placement on the finger. These factors may affect the ease of identification of the relationship between bioimpedance and BGL, resulting in a greater MARD.
Future Work
The promising performance of the model (17.9% MARD; 99% of estimations in PEG zones A and B) provides justification for the continued development of the prototype NI-CGM. Optimization of the prototype NI-CGM will continue as it undergoes miniaturization toward a wearable medical device. Further clinical studies will be conducted throughout this process to collect more data and understand the relationship between bioimpedance and BGL.
The current pool of 14 study participants was suitable for this early-stage validation, whereas additional participants with a broader range of characteristics are needed to strengthen model performance. Participants with diabetes types other than type 2 will be included. While the current study was purely observational to understand whether BGL could be estimated using the prototype NI-CGM in a real-world scenario, active BGL manipulation could be used to broaden the range of BGLs observed which would strengthen the model performance under conditions of hypoglycemia and hyperglycemia.
While using a CGM is practical for data collection in a real-world scenario in the described observational study, this is balanced with reduced accuracy of the CGM compared with a SMBG meter. Additional studies will be conducted where the BGL data used for model training are collected with a more accurate BGL meter such as a YSI 23000 STAT Plus glucose analyzer. This would be expected to improve model performance due to the higher accuracy of the training data but would come with the limitation of a participant being tethered to this system and thus would require a large number of participants attending many onsite sessions for data collection. While the current study had a focus on data quantity, this change would represent a change toward data quality in the ongoing balance between data quantity and data quality. The current study was also conducted over a 14-day study period, limited by the CGM lifetime, but could be extended using such a system.
The model developed in this study was a global model, trained and tested on data from all study participants. There are, however, noted differences in characteristic bioimpedance data per individual. The collection of substantially more data from additional participants in future studies would enable further exploration of personalized models for BGL estimation which may perform better than the described global model.
Conclusion
In this study, a prototype NI-CGM was used to collect bioimpedance data alongside BGL data from an SMBG meter and a CGM. The CGM data were transformed using the SMBG meter data to improve the accuracy of this large dataset, creating an adjusted-CGM dataset. A gradient boosted model developed using this adjusted-CGM dataset was able to successfully estimate BGL with a clinically relevant MARD when evaluating the model. This result demonstrated that continued development of the prototype NI-CGM is warranted, progressing toward a miniaturized wearable while conducting further clinical studies aimed at generating large volumes of accurate BGL data with a broad spread from hypoglycemia to hyperglycemia ranges.
Supplemental Material
sj-docx-1-dst-10.1177_19322968211054110 – Supplemental material for Evaluation of a Continuous Blood Glucose Monitor: A Novel and Non-Invasive Wearable Using Bioimpedance Technology
Supplemental material, sj-docx-1-dst-10.1177_19322968211054110 for Evaluation of a Continuous Blood Glucose Monitor: A Novel and Non-Invasive Wearable Using Bioimpedance Technology by Farid Sanai, Arshman S. Sahid, Jacqueline Huvanandana, Sandra Spoa, Lachlan H. Boyle, Jonathan Hribar, David Ta-Yuan Wang, Benjamin Kwan, Stephen Colagiuri, Shane J. Cox and Thomas J. Telfer in Journal of Diabetes Science and Technology
Footnotes
Abbreviations
BGL, blood glucose level; BMI, body mass index; CGM, continuous glucose monitoring system; Food and Drug Administration (FDA); MARD, mean average relative difference; NI-CGM, non-invasive continuous glucose monitoring system; PEG, Parkes error grid; SMBG, self-monitoring blood glucose.
Declaration of Conflicting Interests
The author(s) declared no potential conflicts of interest with respect to the research, authorship, and/or publication of this article.
Funding
The author(s) disclosed receipt of the following financial support for the research, authorship, and/or publication of this article: This research was funded by Opuz Pty Ltd (Sydney, Australia). The funding source had no involvement in the development of this manuscript.
ORCID iDs
Supplemental Material
Supplemental material for this article is available online.
References
Supplementary Material
Please find the following supplemental material available below.
For Open Access articles published under a Creative Commons License, all supplemental material carries the same license as the article it is associated with.
For non-Open Access articles published, all supplemental material carries a non-exclusive license, and permission requests for re-use of supplemental material or any part of supplemental material shall be sent directly to the copyright owner as specified in the copyright notice associated with the article.