
Abstract
Background:
Critically ill ICU patients frequently experience acute insulin resistance and increased endogenous glucose production, manifesting as stress-induced hyperglycemia and hyperinsulinemia. STAR (Stochastic TARgeted) is a glycemic control protocol, which directly manages inter- and intra- patient variability using model-based insulin sensitivity (SI). The model behind STAR assumes a population constant for endogenous glucose production (EGP), which is not otherwise identifiable.
Objective:
This study analyses the effect of estimating EGP for ICU patients with very low SI (severe insulin resistance) and its impact on identified, model-based insulin sensitivity identification, modeling accuracy, and model-based glycemic clinical control.
Methods:
Using clinical data from 717 STAR patients in 3 independent cohorts (Hungary, New Zealand, and Malaysia), insulin sensitivity, time of insulin resistance, and EGP values are analyzed. A method is presented to estimate EGP in the presence of non-physiologically low SI. Performance is assessed via model accuracy.
Results:
Results show 22%-62% of patients experience 1+ episodes of severe insulin resistance, representing 0.87%-9.00% of hours. Episodes primarily occur in the first 24 h, matching clinical expectations. The Malaysian cohort is most affected. In this subset of hours, constant model-based EGP values can bias identified SI and increase blood glucose (BG) fitting error. Using the EGP estimation method presented in these constrained hours significantly reduced BG fitting errors.
Conclusions:
Patients early in ICU stay may have significantly increased EGP. Increasing modeled EGP in model-based glycemic control can improve control accuracy in these hours. The results provide new insight into the frequency and level of significantly increased EGP in critical illness.
Keywords
Introduction
Low insulin sensitivity, known as insulin resistance, and stress-induced surges in endogenous glucose production (EGP) manifest as stress-induced hyperglycemia in critically ill patients. It occurs primarily early in ICU stay, and is linked to increased morbidity and mortality.1-12 Glycemic control has proven difficult4,13-15 due to the risk of hypoglycemia16-20 and high levels of intra- and inter- patient variability.10,21-31 Thus, safe, effective control has proven elusive, with clinical protocols often lacking patient-specificity and failing to consider inter/intra-patient variability.27-29 There is thus a need for model-based patient-specific glycemic control solutions.3,4,13,32-34
Glycemic control (GC) protocols directly capturing and controlling for patient-specific inter- and intra- patient variability can reduce negative outcomes related to poor control,35-39 as well as provide leading nutrition delivery 40 and economic cost savings.41,42 However, they have been offset by a range of clinical trials using ad-hoc clinical protocols,15,43-46 which could not repeat early successful results.35,47-49 These tradeoffs and issues are reviewed in Chase et al. 50 from a control systems perspective.
The Stochastic TARgeted glucose control (STAR) protocol is an example of a model-based approach,36-38,51 built on the same models used to develop and implement the SPRINT (Specialised Relative Insulin Nutrition Tables) protocol. SPRINT is a predecessor of STAR, a simple paper wheel-based system that modulates both insulin and nutrition treatment inputs based on hourly or 2-hourly blood glucose measurements to gain tight blood glucose control in the 4.0-6.1 mmol/min target band. STAR is the only protocol to reduce organ failure, mortality and hypoglycemia.35,52 Built on the Intensive Control Insulin-Nutrition-Glucose (ICING) model of fundamental Glucose-Insulin system dynamics, 53 STAR directly captures inter- and intra-patient variability,28,54,55 and drives clinically validated virtual patients.4,54,56 It is driven by a model-based patient-specific insulin sensitivity (SI), uniquely identified from clinical data,57,58 whose utility has also been clinically validated.59-64
One of the key elements and potential limitations of model-based glycemic control in general, and the ICING model in particular, is its assumed value for EGP The assumed EGP value53,65 directly impacts the identified value of SI by directly contributing to the net glucose flux balanced by insulin-mediated glucose uptake. However, EGP cannot be measured directly in clinical care, and relies on tracer studies with significant errors in research.66,67 Hence, this value could be in error and, critically, is not identifiable using clinically available data. Thus, significant error in the assumed value due to patient variability would bias identified SI and potentially limit control safety and efficacy.
In the current version of STAR, EGP is an a priori assumed, cohort-based constant, optimizing model performance across the entire cohort in all hours.53,68 However, in the identified SI profile for some patients, there are instances where SI is constrained to a non-negative non-physiological lower limit, which can result in a poor fit to BG measurements, signaling the assumed value of EGP, at least in this case, is insufficient. 68 This SI lower limit is 2 orders of magnitude lower than the clinical range, and when constraint to this level is an indication, the assumed EGP is too low for these patient hours due to surging EGP. This issue typically occurs early in ICU stay and stress-induced hyperglycemia, where such bursts of EGP are common for some patient demographics.2,69-71 Notably, such problems are not unique to model-based control of adult ICU patients. 72
This study uses clinical data from 717 patients using STAR from 3 independent clinical cohorts to formally analyze the impact of the choice of EGP value on identified insulin sensitivity values based on the accuracy of the fit to measured BG data. In particular, when SI is constrained to its lower limit, it is possible to find a higher EGP value leading to a better fit to BG data at a physiological SI value. The time and frequency of these events are important for understanding these cohorts and the physiological stress response, as well as reducing limitations to model-based GC.
Methods
ICING Model
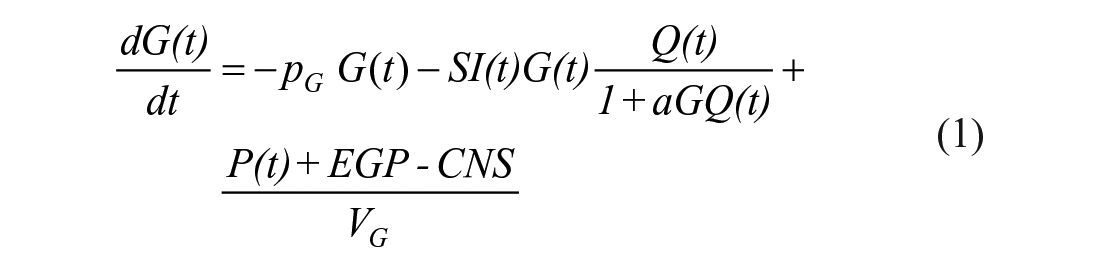
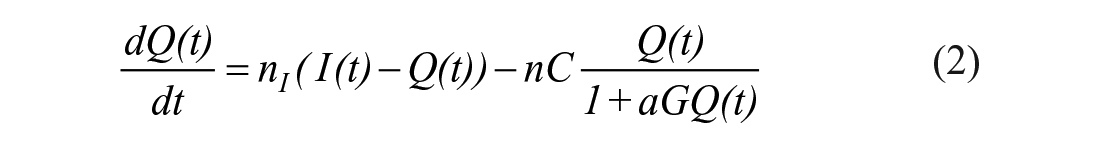
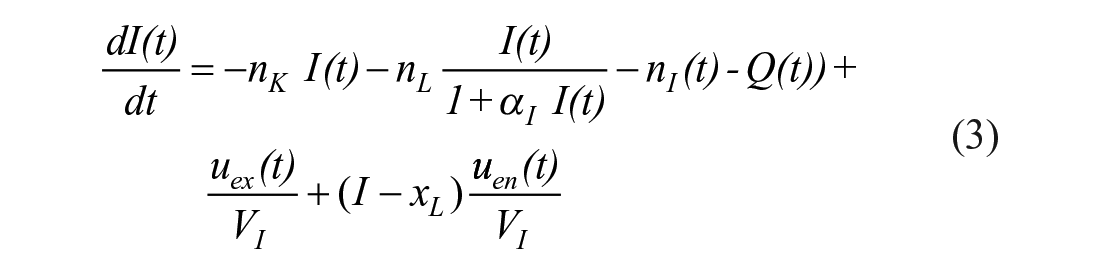
The STAR protocol uses the Intensive Care Insulin-Nutrition-Glucose (ICING) model to simulate the fundamental metabolic dynamics of the insulin/glucose system, 53 and is shown in Figure 1. The equations are defined:
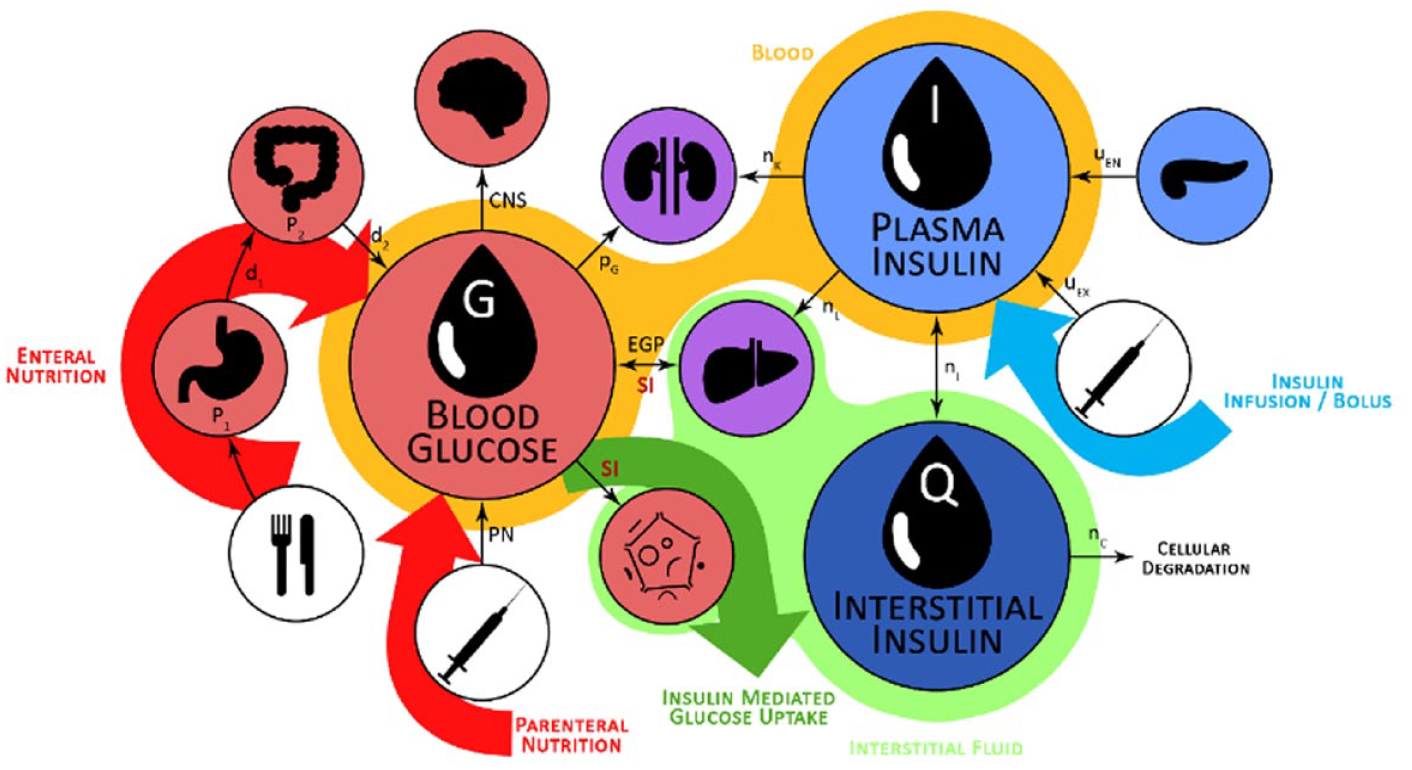
Graphic representation of the insulin/glucose system modeled by ICING. 72


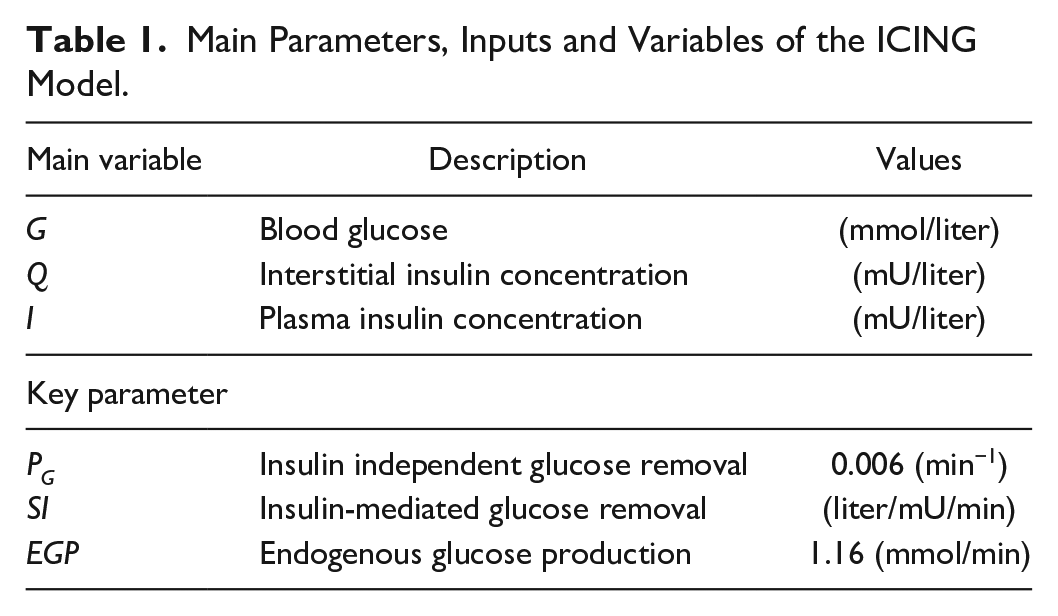
A full list of parameters, inputs, and variables are defined in Lin et al., 53 and Table 1 lists the fundamental variables.
Main Parameters, Inputs and Variables of the ICING Model.
Patient Data and Cohorts
Clinical data in this study were collected from 3 independent cohorts of 717 hyperglycemic critically ill patients from 3 different ICUs. Specifically, 93 patients from Kalman Pandy Hospital, Gyula, Hungary, 216 from the International Islamic University Malaysia Medical Centre, Malaysia, and 408 from Christchurch Hospital, Christchurch, New Zealand. Patients were excluded if their length of glycemic control was less than 10 hours.
New Zealand patients were treated using the STAR glycemic control protocol as a standard of care with BG target range 4.4-8.0 mmol/min and insulin delivered via bolus. 38 Hungarian patients were treated using STAR with the same target range but with continuous insulin infusion. 38 Malaysian patients were treated using STAR, but using a higher target range of 6.0-10.0 mmol/min with continuous insulin infusions. 73
Clinical data contains clinical diagnosis, BG measurements, insulin/nutrition treatments and time. Ethics approval was obtained from each local ethics committee for the analysis of this de-identifiable and anonymized data. The study is a retrospective analysis and there was no impact on care, as STAR is the clinical standard in each ICU.
Model-Based SI
The SI value identified using the ICING model is a whole-body insulin sensitivity incorporating any trade-offs due to the assumed EGP value. It reflects the tradeoff between insulin and glucose inputs and the observed net output flux in BG. 58 Low values indicate greater insulin resistance and the need to either add insulin or reduce nutrition to achieve lower glycemic levels, where insulin saturation can occur at high doses,73-76 necessitating a reduction in nutrition to achieve euglycemia. 40 Given its whole body sensitivity definition, SI also captures changes in the patient state,77-80 response to drug therapy,81,82 and other treatments.83,84
SI is identified hourly, and variability is assessed by the hour-to-hour change in SI levels.30,85 An SI profile over time can be used to create a virtual patient,4,56,86 which has been successfully used to design GC protocols.37,87,88 Virtual trials on cohorts of virtual patients can evaluate GC changes and/or new technologies before clinical use.4,50,89
Clinical data, including current and prior last BG measurement and insulin/nutrition inputs are utilized with ICING model to identify hourly SI values using the integral-based method.53,57,58. In the clinical application, the identified SI value is used to predict future SI using stochastic models, which will also be used for the prediction of future patient blood glucose based on given treatment suggestions, but these stochastic models are not used in this study. Negative SI values are prevented by constraining the identified value to a minimum value of 1e-7 L/mU/min, where the physiological minimum is 1e-5 L/mU/min.
EGP
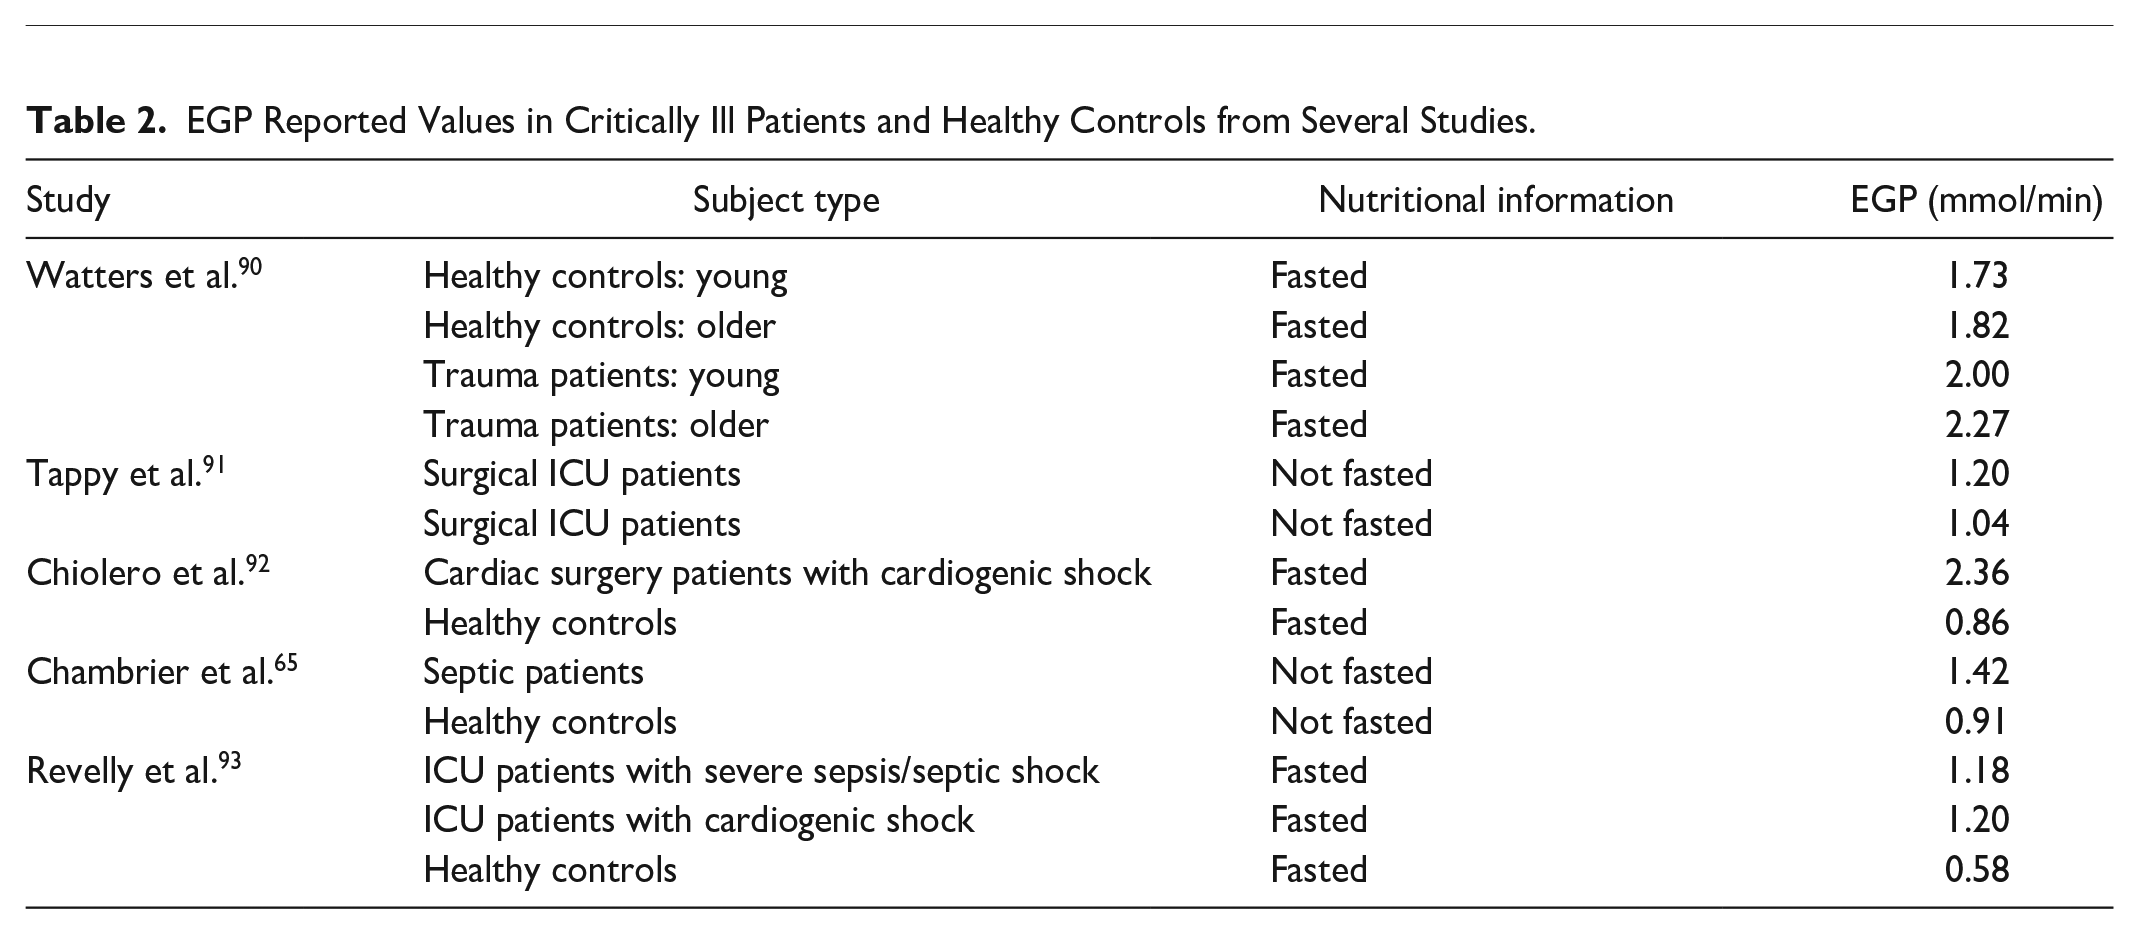
In the context of the physiological system model of equations (1)–(7), EGP represents net endogenous glucose produced, primarily by the liver, to assist in BG regulation. EGP can represent a significant proportion of the glucose appearance in the plasma, particularly in the early stages immediately post insult, and when patients are receiving little exogenous nutrition.2,69-71 Only a few studies have been carried out on critically ill populations to determine EGP, as shown in Table 2, where fasted estimation may be quite high compared to not fasted patients. The overall range in Table 2 is still relatively large, representing the diversity of physiological response. STAR currently sets EGP as a cohort-based constant of 1.16 mmol/min based on Chambrier et al. 65 and optimized over a large cohort. 53 The clinical trial published in the Chambrier’s paper was a prospective study including 5 normal subjects and in 5 patients with severe sepsis hospitalized in an intensive care unit. The 1.16 mmol/min value is the average of the mean EGP value of the 5 normal subjects which was 0.91 mmol/min and the mean EGP value of the 5 ICU patients with severe sepsis which was 1.42 mmol/min.
EGP Reported Values in Critically Ill Patients and Healthy Controls from Several Studies.
Insulin Resistance and Constrained SI
In this study, constrained SI=1e-7 L/mU/min in STAR is used as an indication of insulin resistance. All ICING model parameters except SI are fixed, including EGP, to cohort-based constant values to ensure the model is identifiable. 57 Negative SI values are non-physiological and prevented by a non-negative constraint to SI=1e-7 L/mU/min, which is 100× below its physiologically lower limit of SI=1e-5.53,59,60,94 Constrained SI=1e-7L/mU/min values are thus an indication of insufficient incoming glucose flux to fit the data. Figure 2 shows an example of such a case, where extreme stress response due to the initial insult2,69-71 results in an assumed EGP value potentially low, based on an SI value identified at the lower limit and poor fit to measured blood glucose data. The early discrepancies between the simulated BG and measured BG is due tothe sudden rise in BG level resulting from the stress response likely causing a surge in EGP, which in the model-based estimation results in extremely low identified values of insulin sensitivity. As noted, these surges are common early in the stay for severe sepsis and other severe critical illness. In the case of this particular patient the constant EGP (1.16mmol/min) limits the ability of the STAR model to closely follow the BG dynamics without identifying a negative SI value, where a negative value is a clear indication of an assumed EGP value being too low.
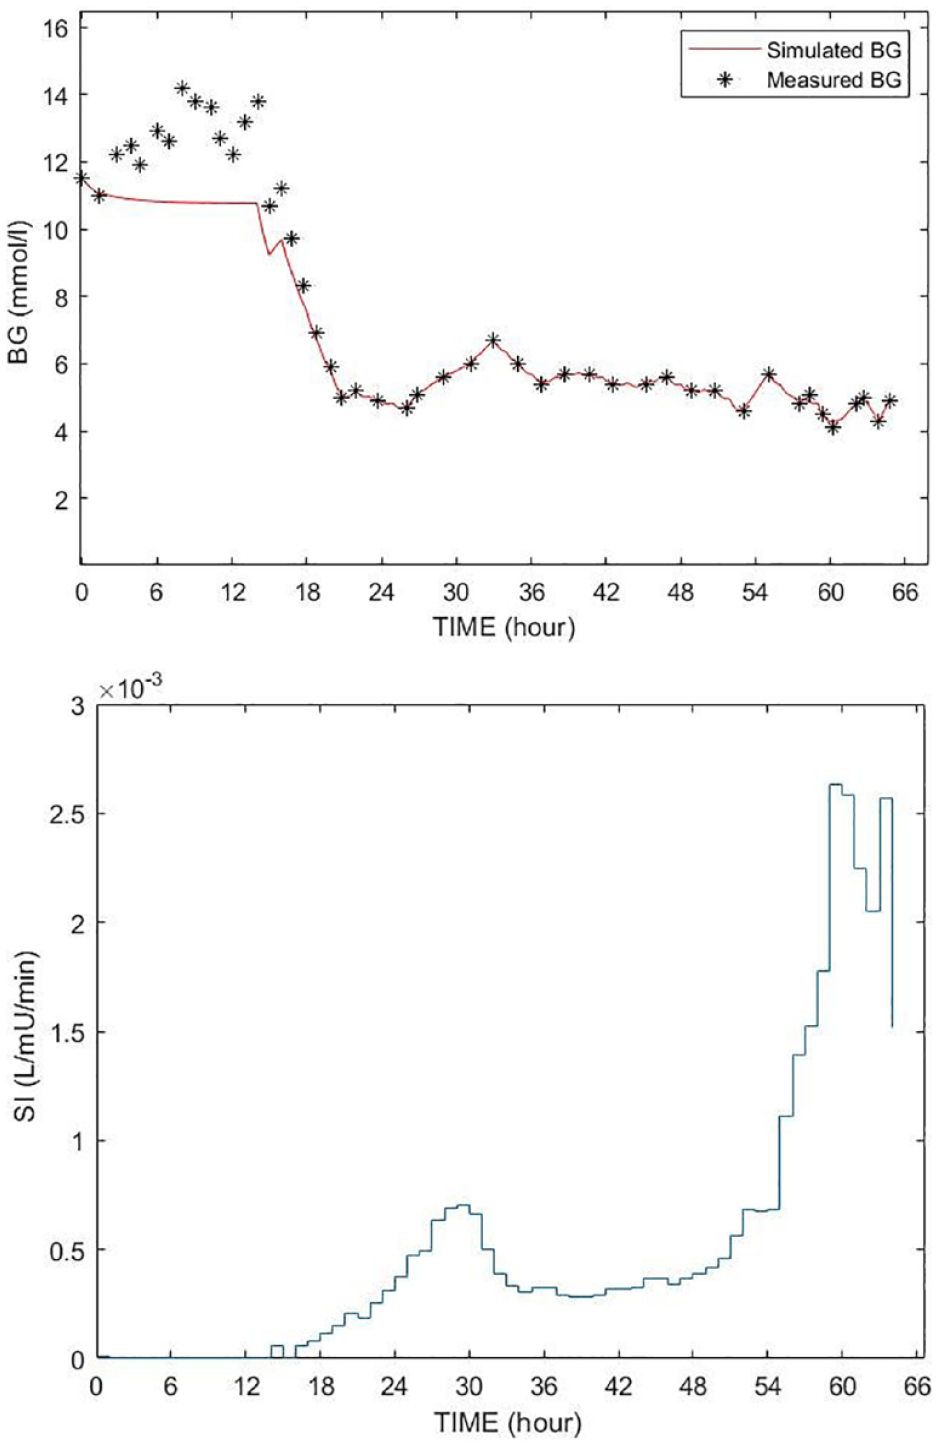
Example of poor BG fitting (top figure) with SI time function (bottom figure). The red curve is the simulated BG using the fixed EGP; the BG measurements are shown by stars (*).
EGP Estimation During Severely Low SI
Parameter estimation is the critical phase of the modeling since this will determine the model fit to the measurement data. The model-based EGP estimation method is developed to adjust the EGP according to the BG concentration and initially identified SI value when it hits the lower constraint limit (see Figure 3). It elevates EGP from this initial value until the model can match the measured blood glucose levels. In particular, the elevated EGP value is identified using a simple least squares method minimizing the squared error between the linear interpolated blood glucose measurements (Gm) and the BG simulated by the ICING model (Gs).
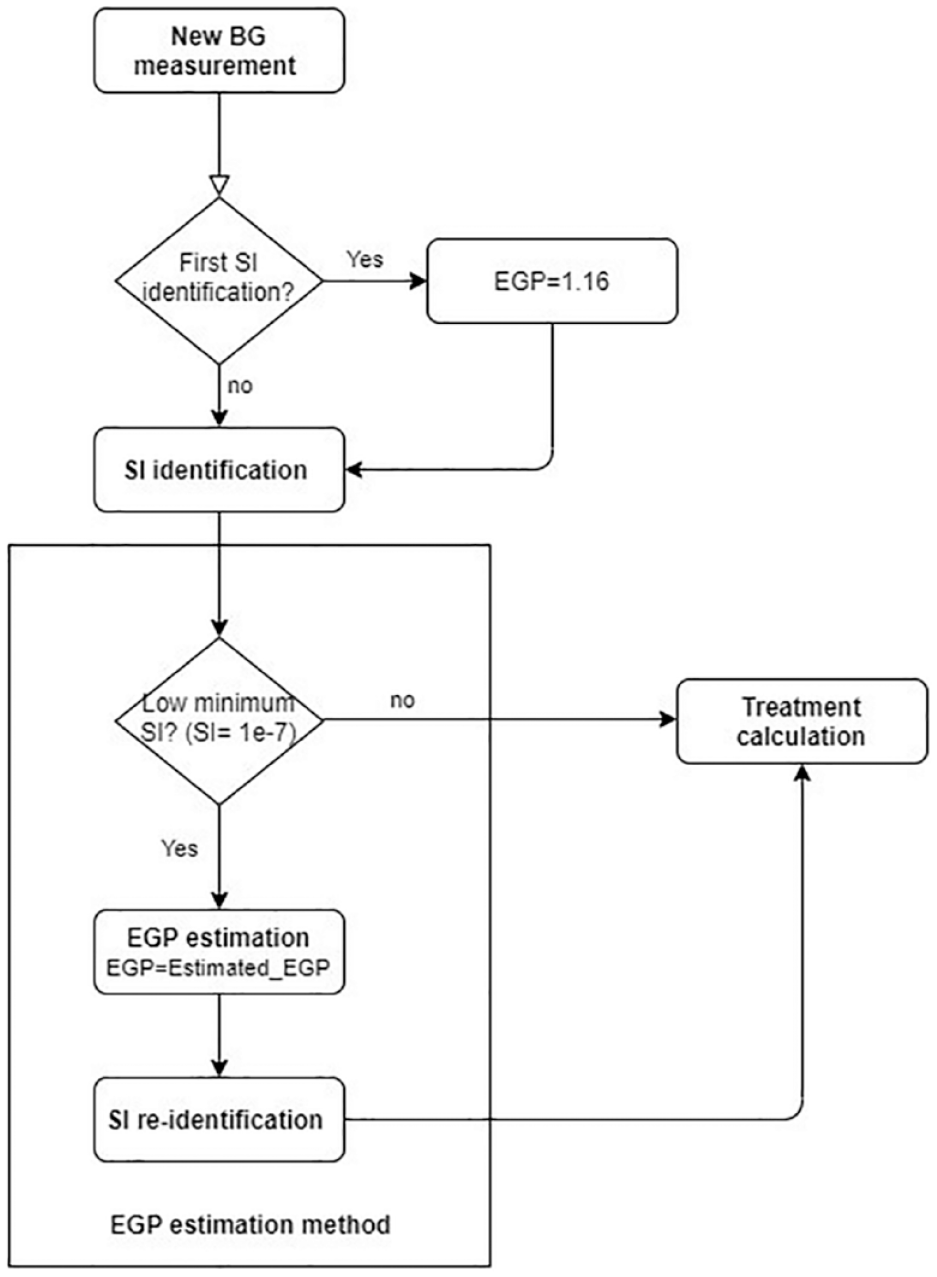
Flowchart of the implementation of the new EGP estimation method embedded into the SI identification process. Treatment calculation includes the selection of the optimal insulin and nutrition intake to be given to the patient according to the original STAR protocol.
The calculation was achieved based on the linear approximation of the not necessarily equidistant in time blood glucose measurements. This estimated EGP is obtained:
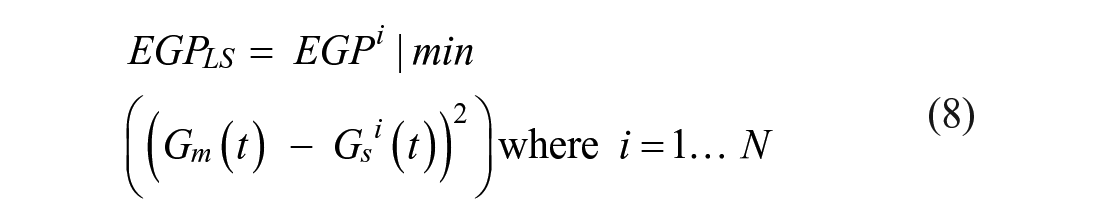
where Gsi(t) is the simulated BG by the model for a given EGP (EGPi), N = 10 and EGPi = [1.25; 1.50; 1.75; 2.00; 2.25; 2.50; 2.75; 3.00; 3.25; 3.50].
The EGP parameter values range is defined as 1.25 < EGP < 3.5 mmol/min with a step value of 0.25 mmol/min, which gives a vector of N = 10 after the initial fixed value of EGP = 1.16 mmol/min. The optimal step size was experimentally determined via convergence analysis until decreasing the step size did not significantly affect the EGP value found, but only increased the calculation time. Since the problem space is small the minimum value can be found by a simple linear search.
This estimation method selects the EGP value minimizing the fitting error in the hour prior to the measurement. Once a new EGP value is identified by the above method, it is used in the model for the remaining patient hours. The EGP estimation method is embedded into the SI identification process of the STAR protocol, as can be seen in Figure 3. The main steps of the method are as follows:
•
•
•
Note that in this particular study, this new EGP value is used for the rest of the patient’s treatment (alternative scenarios are suggested in a previous study, see Anane et al. 95 ). This EGP may change if a new constrained SI occurs, then the method is executed again and the estimated EGP may change.
Analyses
In the first phase, the analysis is done for all patients in all treatment hours. In the second phase, the rest of the analysis is done on the subset of the patients with at least one low minimum SI (constrained SI = 1e-7 L/mU/min). In the first phase, the insulin sensitivity, and the proportion of patients and time of occurrence where EGP is modified based on constrained SI = 1e-7 L/mU/min are reported. In the second phase, distributions of EGP values are reported and compared across cohorts.
More importantly, the identified values of SI are compared for each cohort using SI with the fixed EGP value currently used, and the SI when EGP is estimated with our method, where relatively modest changes would indicate no significant impact on the performance of STAR, but would also alleviate any biases induced in the proportion of hours where EGP was changed. Modeling error between simulated BG and measured BG is analyzed. Median and interquartile range (IQR) of absolute error per cohort and maximum per-patient error (in percentage) are compared in those effected hours only for fixed EGP and estimated EGP.
Results
Distribution of SI Values
Figure 4 shows the distribution of all SI values identified for the 3 cohorts. In particular, a higher proportion (≈ 9%) of these values are close to the minimum SI value (insulin resistance) in the Malaysian and (≈ 4%) New Zealand cohorts compared to the Hungarian cohort with less than 1%. Table 3 shows a high proportion of patients are affected in all cohorts, but relatively low hours in proportion. Thus, ≈22%-62% of all patients are affected, but the number of hours this excessive stress response impacts EGP is <10%. Again, the Hungarian cohort, which had the highest SI values in Figure 4, is least affected, and the Malaysian cohort is most affected.
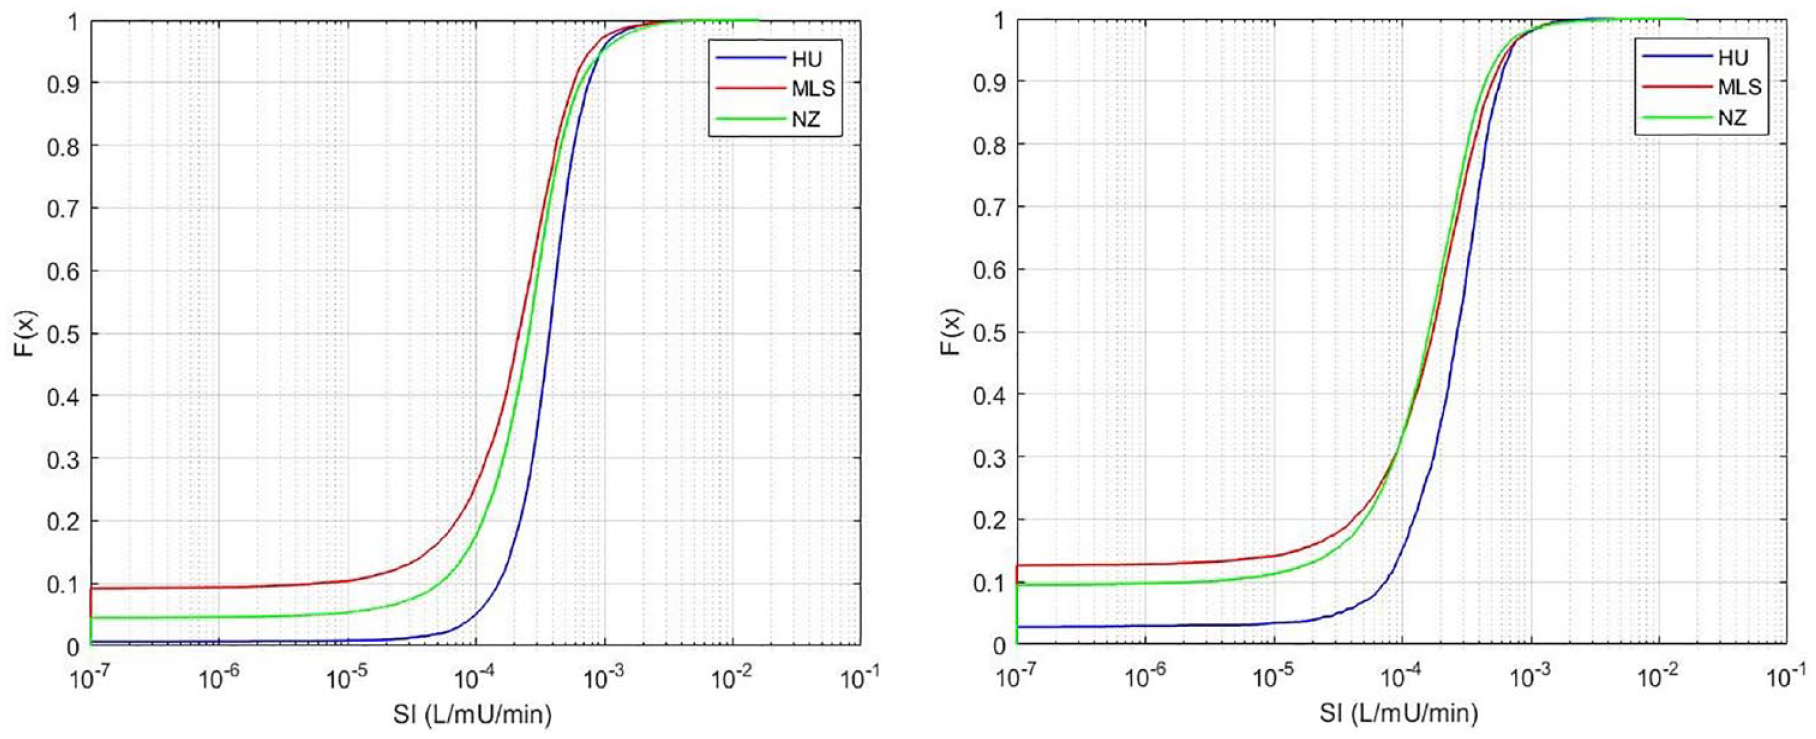
Distribution of identified SI for each cohort using the standard, fixed value for EPG of 1.16 mmol/min. On the left, all patients (N = 717), and on the right, only patients with SI constrained to the minimum value for at least 1 hour (N = 330). The proportion of values at the lower limit of SI = 1e-7 L/mU/min in Table 3 match the starting points in this figure (left). Note that the x-axis is a log scale.
Statistics of Patients Where SI Was Constrained to SI = 1e-7 L/mU/min Using the Standard, Fixed Value for EPG of 1.16 mmol/min.
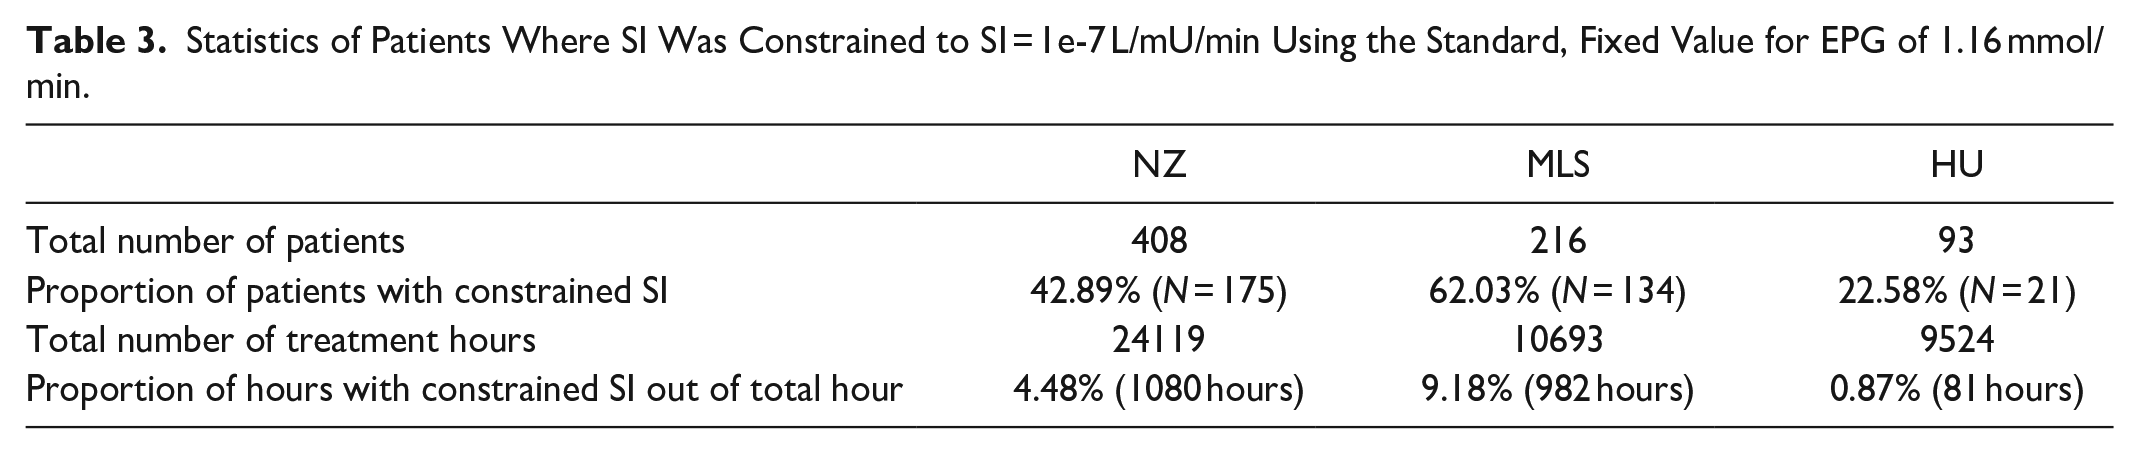
Further analysis considers only patients with constrained SI = 1e-7 L/mU/min values (patients with at least one SI value constrained to the lower minimum limit), which represents 62.03% of Malaysian patients, 42.89% of New Zealand patients and 22.58% of Hungarian patients. Their details are also in Table 3.
SI Distribution with Fixed EGP vs. Estimated EGP
Using the EGP estimation method presented results in a new SI values in the current and remaining treatment hours for those patients in Table 3 who had SI constrained to the minimum value at least once. The resulting SI distribution in Figure 5 is shifted to higher SI values with far fewer low minimum SI values than in Figure 4. Trends across cohorts match those in Figure 4.
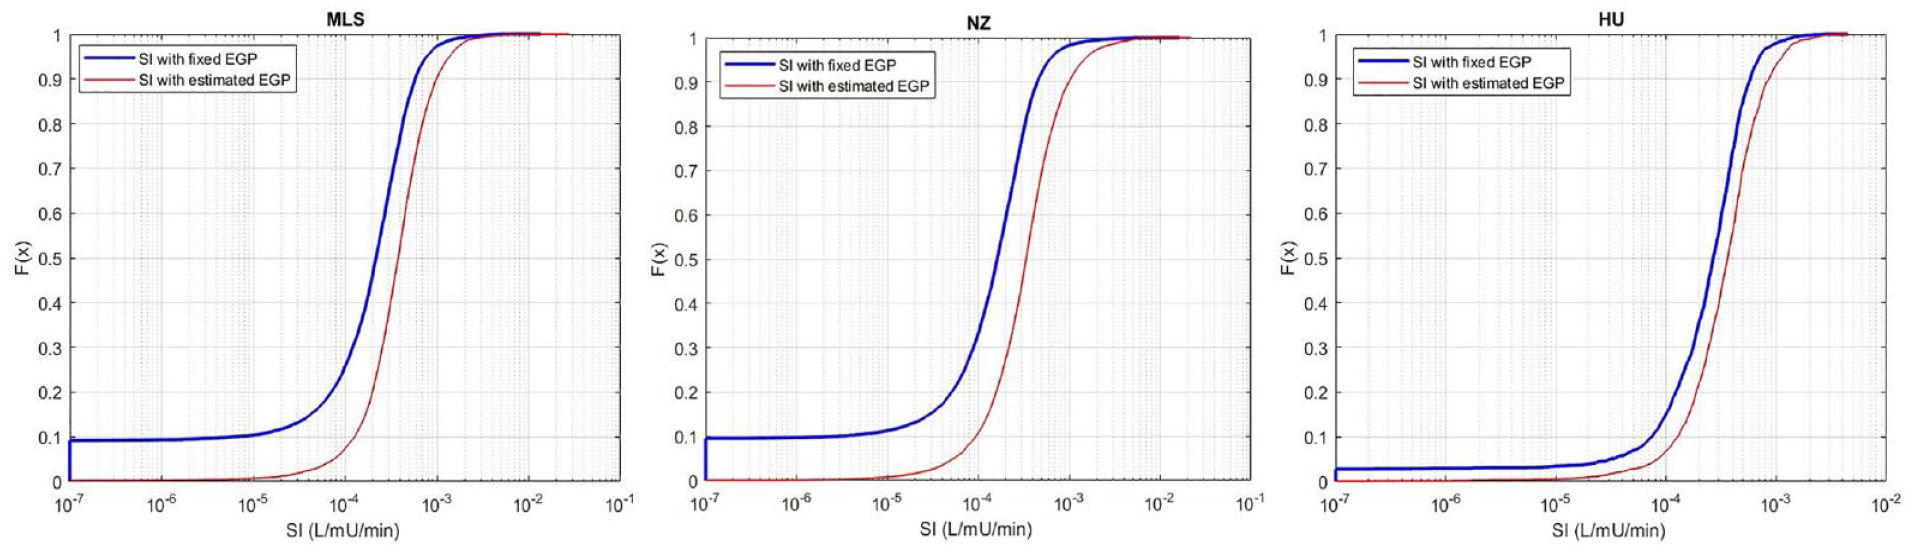
Distribution function of SI values with fixed EGP vs. Estimated EGP for the: (left) Malaysian; (middle) New Zealand; and (right) Hungarian cohorts. Note that the x-axis is a log scale.
Estimated EGP Distribution
Figure 6 shows the new estimated EGP distribution for all hours in Table 3 where SI was constrained using a fixed EGP value, and EGP was thus increased. In ≈80% of these cases, the estimated EGP was between 1.25 and 2 mmol/min. However, fewer differences were seen for almost 20% of cases with EGP values between 2.0 and 3.5 mmol/min, which is the upper value in the estimation method used here, although this choice was arbitrary at 3 times the assumed value. Trends by cohort followed those seen in Figures 4, 5 and Table 3.
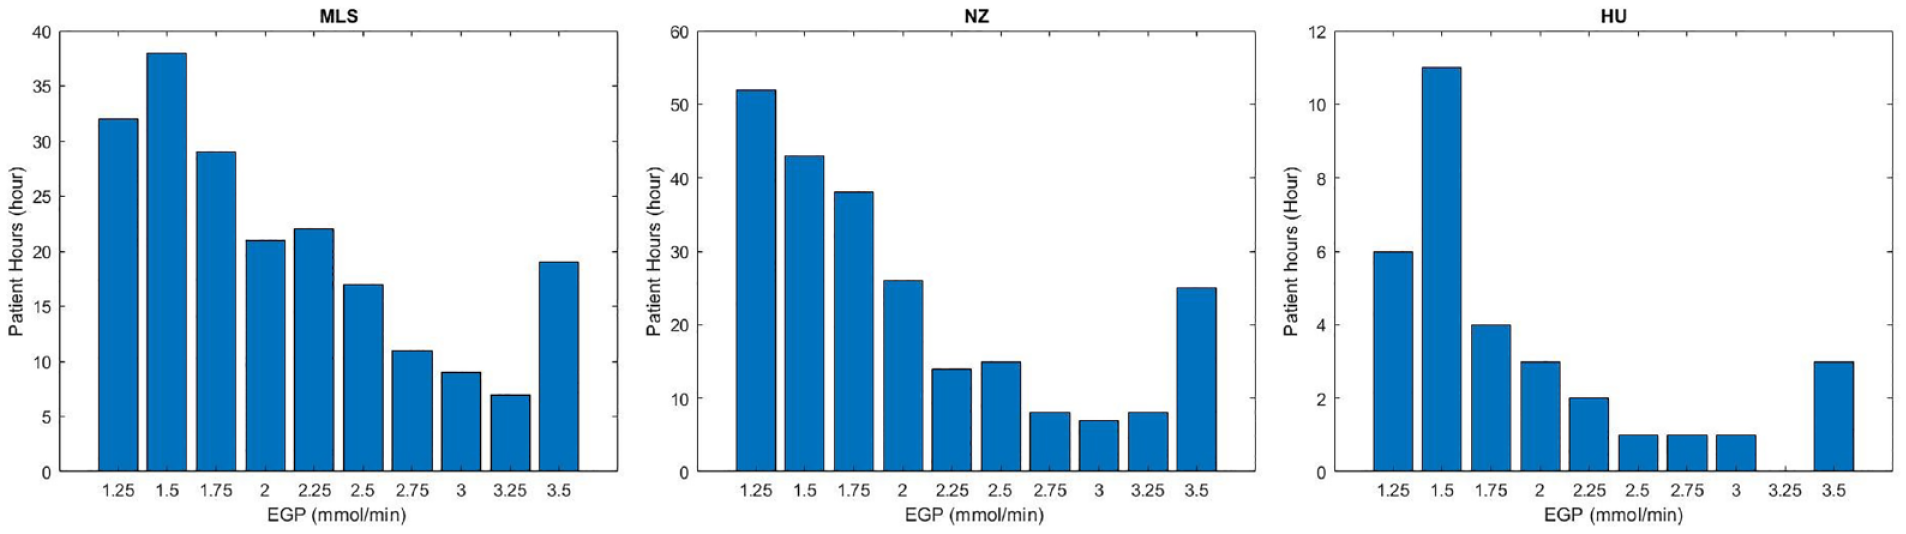
Distribution of the estimated EGP for the 3 cohorts for the hours where it was constrained and the proposed method applied in Table 3. Malaysian (left); New Zealand (middle); and Hungarian (right) cohorts. X is the EGP estimated for each low minimum SI hours, Y is the number of cases when it was changed (low minimum SI hours).
Constrained SI Occurrence
Figure 7 shows the distribution in time of low minimum SI occurrence for the 3 cohorts. Approximately 24%-50% of cases occur in hours 1-24 with 35%-65% in hours 1-48 and 60%-75% within 72 hours. These results include all events, even those lasting only 1 hour, which may also be due to data entry error, significant measurement errors, nutrition stoppage for clinical reasons and/or clinical errors.28,53,55,96 The overall trends for the NZ and Malaysian cohorts are exponential with most episodes arising in the first hours, as expected, given stress response physiology. The Hungarian cohort has relatively very fewer episodes and thus no specific pattern.
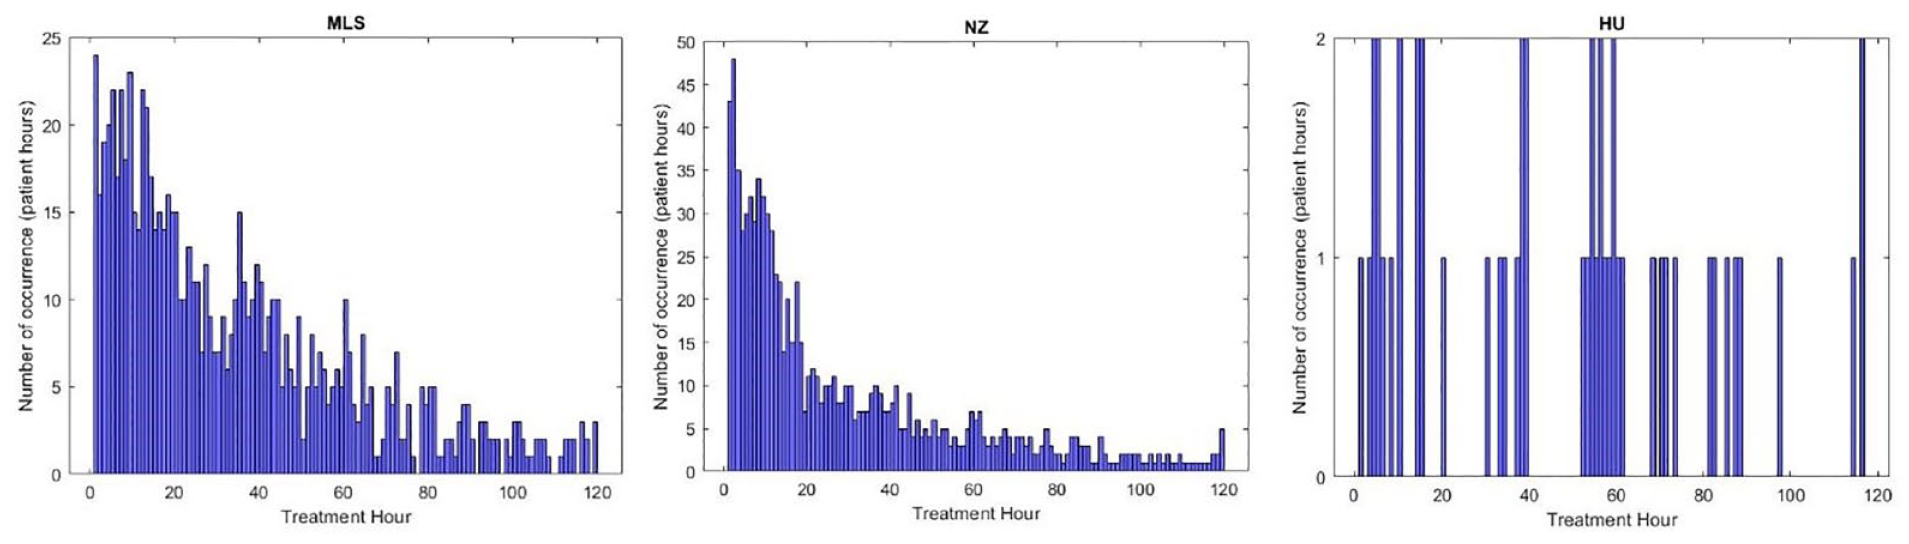
Occurrence in time of low minimum SI for Hungarian, Malaysian and New Zealand cohort (one histogram bin corresponds to 1 hour) Malaysian (left); New Zealand (middle); and Hungarian (right) cohorts.
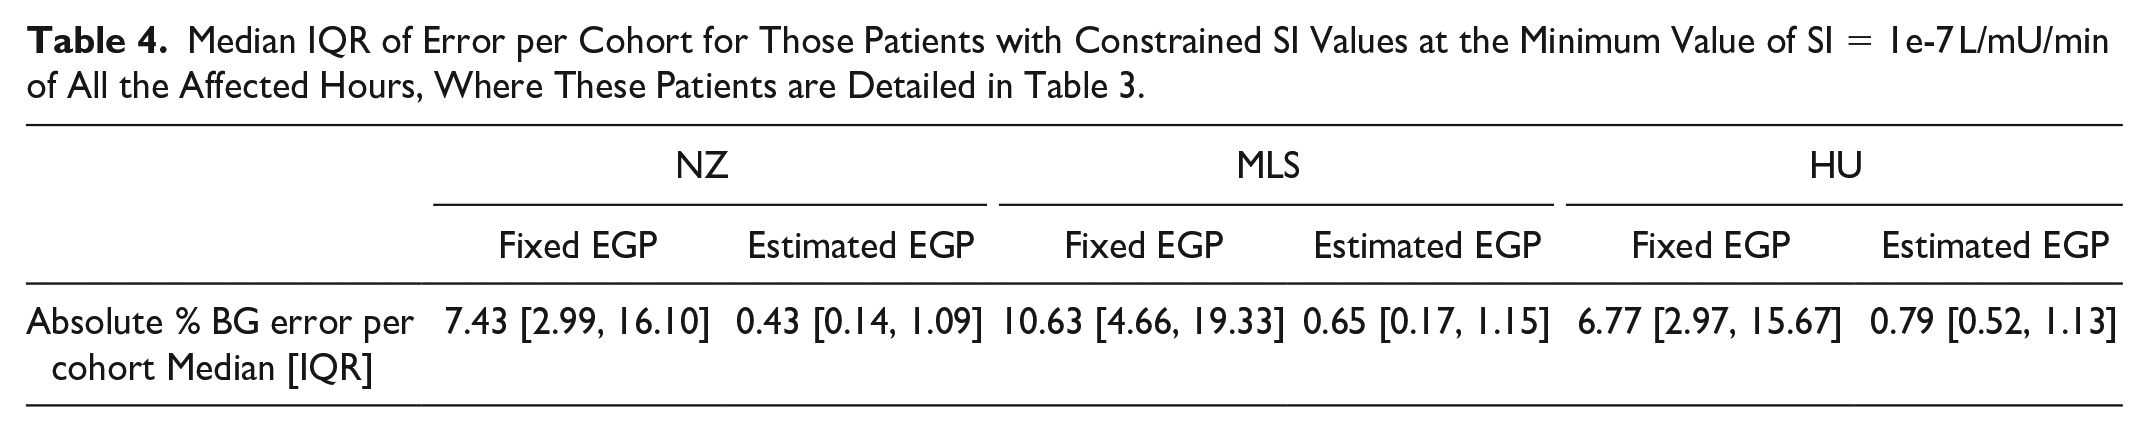
BG Fitting
Figure 8 shows an example of the patient showed in Figure 2 where the estimation method was applied. The simulated BG trajectory with the estimated and increased EGP is more flexible in approaching the blood glucose measurement points and was able to follow the BG dynamics, especially in that critical phases where there was a significant rise in BG levels resulting in a low minimum identified SI value using the fixed assumed value of 1.16 mmol/min. Table 4 shows BG errors per cohort for all patients where EGP was changed. Significant reductions in error in these cases where EGP was modified can be seen in all the 3 cohorts using the proposed method. The greatest reduction was in the Malaysian cohort, which, following all other trends, was the most affected. The Hungarian cohort was least affected. Median errors of 1.47%-1.74% are within measurement errors.
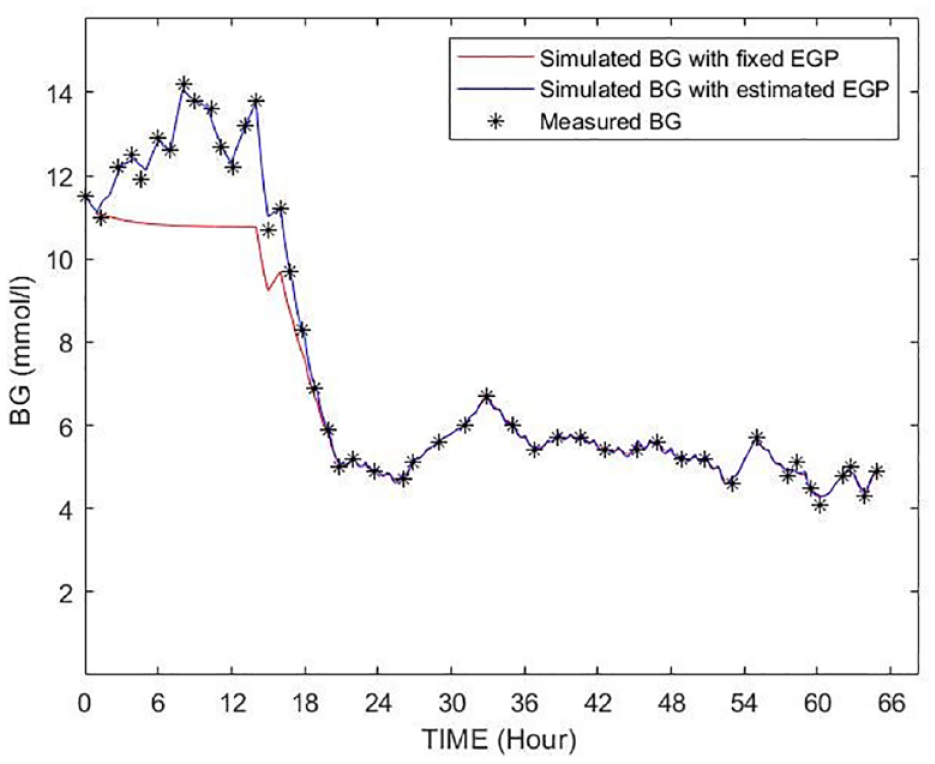
Example for a BG trajectory simulated by using the original EGP/SI values (shown as red) and the identified EGP/SI values (shown as blue) of the patient shown in Figure 2.
Median IQR of Error per Cohort for Those Patients with Constrained SI Values at the Minimum Value of SI = 1e-7 L/mU/min of All the Affected Hours, Where These Patients are Detailed in Table 3.
Discussion
From the distribution of identified SI values for all 3 cohorts, there were significant differences in the proportion of hours where SI was constrained. The Hungarian cohort had the fewest (0.87%). However, considering analysis of the treatment differences, 38 the carbohydrate intake of the Hungarian cohort was significantly higher. Equally, they have the highest identified SI, which would may limit those situations in general, all else equal. These differences may also reflect cohort differences in the incidence of greater complexity and level of critical illness, such as incidence of severe sepsis, in some cohorts, which can occur from the areas and types of patients treated, as well as from treatment selection or treatment failure bias.97,98 The difference in insulin delivery using bolus or continuous infusion has no impact on the estimated insulin sensitivity value, 99 and thus does not affect the results presented. However, no significant cohort-based differences in SI distribution across cohorts have been reported in previous studies. 38
Fasted patients could provide a better estimate than non-fasted patients, as EGP is the only input for fasted patients limiting any bias from data, clinical, or model errors. However, the patients who are not provided with enteral or parenteral nutrition is not consistent across or between cohorts. The number of hours where SI = 1e-7 L/mU/min at the lower limit and there was no enteral or parenteral nutrition given was 0% of affected hours for the HU cohort, 1.38% for the NZ cohort and 1.45% for the MLS cohort. These values make up 16% of the affected hours in the MLS cohort and 31% of hours in the NZ cohort, per Table 3, indicating the impact of having minimal nutrition in the model-based SI identification, a situation placing greater emphasis on the assumed EGP value.72,100
Changes in EGP appear well justified by the time of occurrence. 40%-50% of hours, where EGP is changed, occur in the first 24 hours (Figure 7). This behavior matches clinical expectations and is due to the EGP surge often seen in the first 12-24 hours of stay,2,71,101 particularly in severe sepsis and septic shock patients,2,6,65,68,101-103 all of which match the metabolic variability seen in these first days of stay.26,30 Thus, the timing of the hours where this phenomenon occurs qualitatively matches broad clinical expectations.
Fitting errors in these cases were larger or maximum as in Figure 2, and indicate EGP levels for a few select hours can be extremely high. These values would be well beyond the reported values used to justify the range in the model and the range used here (Table 2). However, they are possible, per the results in Table 2. This study thus shows the wide physiological range encountered in such patients. It is a major result of this analysis, which should be prospectively confirmed.
In this study, increasing EGP in the model not only reduces BG fitting error and allows the model to better follow the measured BG dynamics, but also modifies the distribution of the SI values. These shifts are modest and will not affect the overall performance of STAR or its stochastic models given the relatively low percentage of hours affected in Table 3. However, beneficial impacts may arise for STAR from improved predictions and thus more accurate GC during treatment for those hours affected.
The EGP estimation method starts only when a minimum low SI = 1e-7 L/mU/min is identified and the new estimated EGP is kept until the end of the treatment. A follow up study 104 for different practical application scenarios for estimating EGP considered only the hours affected and other constraints. In contrast, the results presented here are a maximum case for the occurrence and EGP level, where this follow up study is a more conservative estimate. Practically, in real-time implementation, every hour can thus be analyzed and the EGP changed only as needed, starting each time from the assumed value. This approach is not terribly computationally heavy and can be performed well within the 10-30 seconds required to make a treatment decision. Hence, it is not likely to affect compliance or ergonomics. 105
Finally, EGP estimation is an estimated value, which is a limitation of the work. EGP is very difficult and very invasive to measure directly, typically using tracers, and these direct measures can have significant errors.106-108 Thus, the estimated EGP values cannot be more fully validated. Further, the elevated values estimated are minimum estimates based on the criteria used to identify a need to modify the value from the estimated population constant. However, the values found are within measured ranges from a variety of limited independent studies in Table 2, where this study examines a very large number of patients.
Conclusions
The study conducted in the paper was a further confirmation of the wide variability of EGP across ICU patient cohorts. Estimating a low EGP value can cause bias in the identified SI value, which can limit the accuracy of the ICING model and potentially reduce the quality of GC treatment recommendation. In these cases, numbering 1%-10% of possible hours in the 3 cohorts, the model was not able to follow the blood glucose dynamics. Estimating and adjusting EGP to a higher value using the novel methods presented shifted SI for these hours to physiologically realistic values and improved blood glucose fit to measured data. A further major result of this study, beyond the method presented, is the quantification of the potentially very wide range of EGP values in ICU patients, which may slightly exceed prior reports, and remain to be prospectively verified.
Footnotes
Abbreviations
BG, blood glucose; EGP, endogenous glucose production; GC, glycemic control; HU, Hungary;
ICING, intensive control insulin-nutrition-glucose; ICU, intensive care unit; IQR, interquartile range;
MLS, Malaysia; NZ, New Zealand; SI, insulin sensitivity; STAR, stochastic targeted.
Declaration of Conflicting Interests
The author(s) declared no potential conflicts of interest with respect to the research, authorship, and/or publication of this article.
Funding
The author(s) disclosed receipt of the following financial support for the research, authorship, and/or publication of this article: The research was supported by the Hungarian National Scientific Research Foundation, Grant No. K116574 and by the BME-Biotechnology FIKP grant of EMMI (BME FIKP-BIO), the project has received funding from EU H2020 R&I programme (MSCA-RISE-2019 call) under grant agreement #872488 — DCPM.