
Abstract
Background:
Stress-induced hyperglycemia is frequently experienced by critically ill patients and the use of glycemic control (GC) has been shown to improve patient outcomes. For model-based approaches to GC, it is important to understand and quantify model parameter assumptions. This study explores endogenous glucose production (EGP) and the use of a population-based parameter value in the intensive care unit context.
Method:
Hourly insulin sensitivity (SI) was fit to clinical data from 145 patients on the Specialized Relative Insulin and Nutrition Titration GC protocol for at least 24 hours. Constraint of SI at a lower bound was used to explore likely EGP variability due to stress response. Minimum EGP was estimated during times when the model SI was constrained, and time and duration of events were examined.
Results:
Constrained events occur for 1.6% of patient hours. About 70% of constrained events occur in the first 12 hours and most events (~80%) occur when there is no exogenous nutrition given. Enhanced EGP values ranged from 1.16 mmol/min (current population value) to 2.75 mmol/min, with most being below 1.5 mmol/min (21% increase).
Conclusion:
The frequency of constrained events is low and the current population value of 1.16 mmol/min is sufficient for more than 98% of patient hours, however, some patients experience significantly raised EGP probably due to an extreme stress response early in patient stay.
Keywords
Introduction
Critically ill patients frequently experience stress-induced hyperglycemia, regardless of diabetic status.1,2 Hyperglycemia in critically ill patients is a stress response involving the release of counter-regulatory hormones, such as cortisol, glucagon, catecholamines, and also cytokines. 2 Their overall effect is to increase liver gluconeogenesis, and suppress insulin secretion and action. 3 The resulting insulin resistance and hyperglycemia contributes to positive feedback loops of metabolic stress and inflammation.
Hyperglycemia, hypoglycemia, and glycemic variability have all been identified as independent risk factors for increased mortality in critically ill patients4-9 suggesting maintaining euglycemia may be of benefit. Physiological benefits from insulin therapy and reduced blood glucose levels have been shown.10,11 Some studies have shown that glycemic control (GC) in critically ill patients can improve patient outcomes,12-15 but other studies have failed to replicate these outcomes.16-20 However, recent analyses have shown that obtaining patient outcomes requires safe, effective control for virtually all patients, 21 which is rarely achieved.16,17,19,20,22
Glycemic control can be difficult to achieve consistently and effectively due to inter- and intrapatient variability,23,24 which is a function of patient metabolic stress, therapies, and disease progression.25-28 Software-guided control can be better than nurse-directed control 29 or “one size fits all” paper-based protocols, and this is the future direction of GC. 30
Glycemic control can be achieved through the use of physiological models and algorithms, which can directly account for the inter- and intrapatient variability.31,32 The Intensive Control Insulin Nutrition Glucose (ICING) model 33 is one such model, which captures basic metabolic physiology well, and has been used in GC protocols such as Stochastic TARgeted (STAR)34-36 and Specialized Relative Insulin and Nutrition Titration (SPRINT) 15 to provide safe, effective glucose control for the vast majority of patients.15,21,34,37 However, such models are limited by assumptions around dynamics, which are not otherwise easily measured at the bedside. Endogenous glucose production (EGP) is one such critically important dynamic.
Endogenous glucose production can be highly variable and elevated due to stress response 2 and is very difficult and extremely invasive to measure directly, requiring arterial-venous balance or tracer methods. 38 Tracer methods have been shown to be less accurate for infusion durations less than 2.5 hours 39 making measurement highly intensive and time consuming, and thus not feasible for real-time control at the bedside. Many studies have examined EGP in critically ill patients and show high variability in rates.40-45 Attempts have been made to model EGP in critically ill patients, including as a function of plasma insulin 46 ; blood glucose (BG) and insulin 47 ; and BG, insulin, and glucagon. 48 Many of these models fail to capture the complexity of EGP stimulus and suppression in stress hyperglycemia and/or rely on additional blood measures not available at the bedside.
The ICING model currently models EGP as a population constant, where the previous attempts at varying EGP dynamics resulted in unstable BG control dynamics. 49 Typically, modeled EGP error is adsorbed as an offset on SI, and the resulting variability is incorporated into the stochastic modeling approach. For example, if EGP is higher than the population value for a specific patient, the model-generated SI would underestimate the patient’s actual insulin sensitivity, but the variation is captured in the SI term and not the EGP term. In extreme cases, high EGP can result in very low or unphysiologically negative SI (in the unconstrained case), which clearly signals that the EGP population value may be too low for some patient hours.
This study uses the validated ICING model33,34 to assess the impact of EGP in the subcohort of patients with high EGP and resulting very low insulin sensitivity. The aim is to quantify the incidence of persistent high EGP, its time of occurrence, and its progression in critically ill patients, while quantifying a lower bound on the augmented value of EGP in these cases.
Methods
Patient Demographics
Study data are composed of patients on the SPRINT protocol15,50 in Christchurch Hospital intensive care unit (ICU) from June 2011 to May 2015. For this analysis, only patients on the protocol for a minimum of 24 hours and who started the protocol within 12 hours of ICU admission were used. It is important to note that these patient data sets all begin within 12 hours of ICU admission so that timing through the insult is consistent across patients. Demographic data are shown in Table 1. 21
Patient Demographic Data.
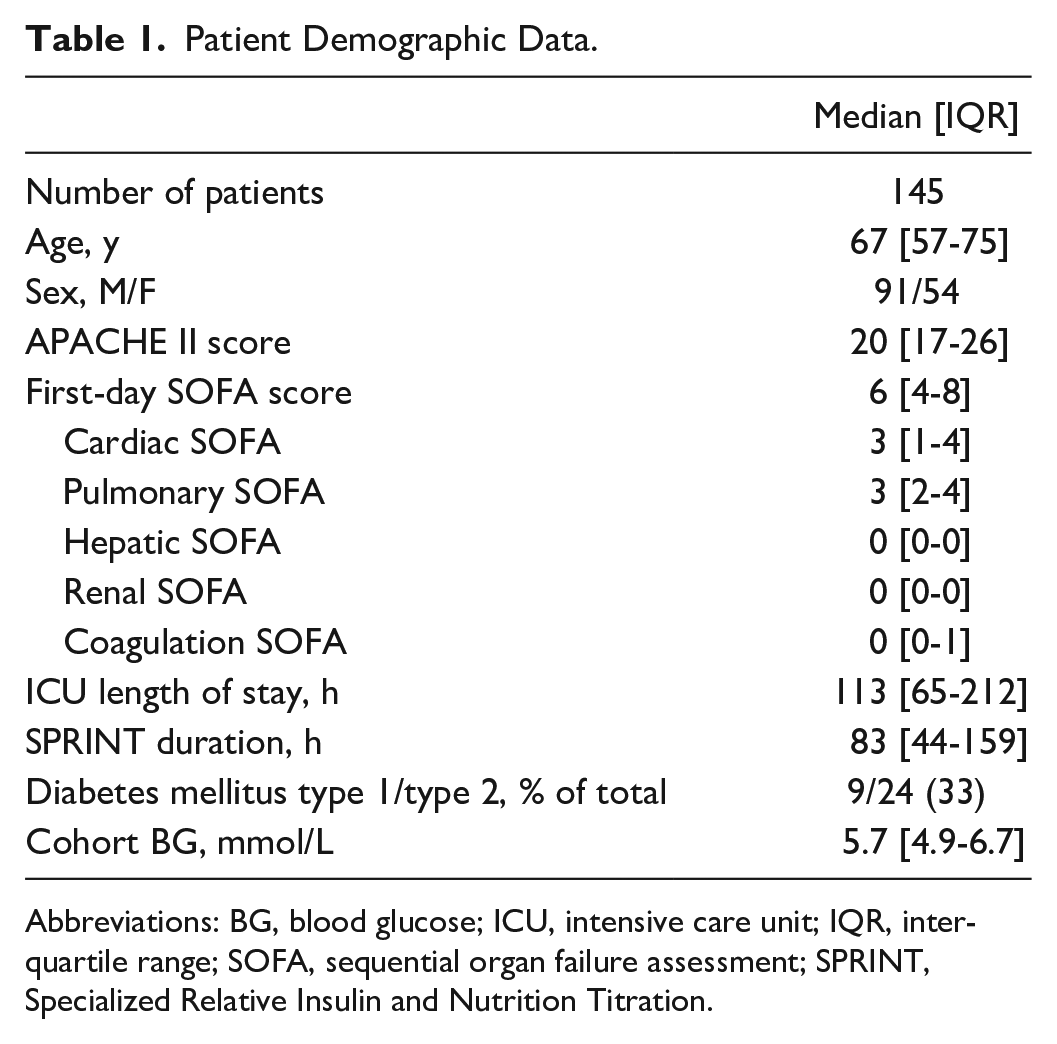
Abbreviations: BG, blood glucose; ICU, intensive care unit; IQR, inter-quartile range; SOFA, sequential organ failure assessment; SPRINT, Specialized Relative Insulin and Nutrition Titration.
Model and SI
The glucose-insulin system dynamics are described by the ICING physiological model defined as 33
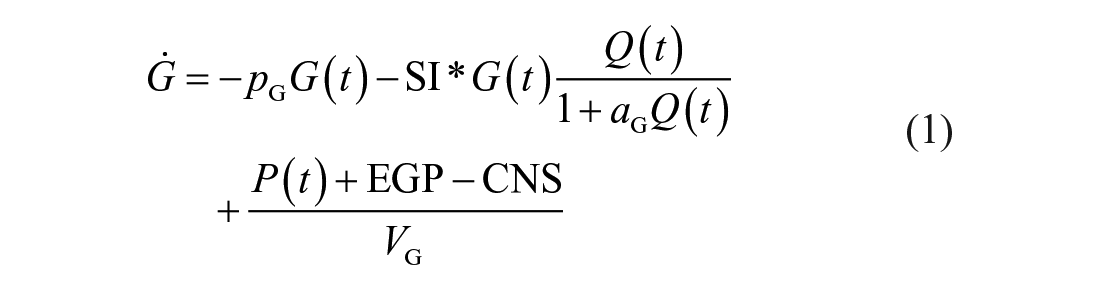
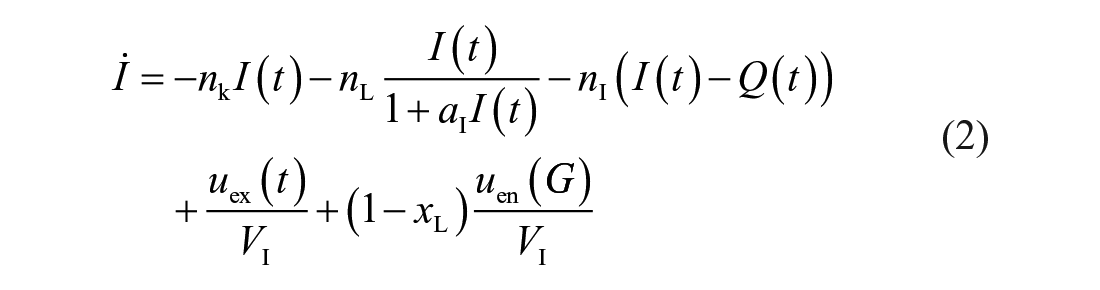
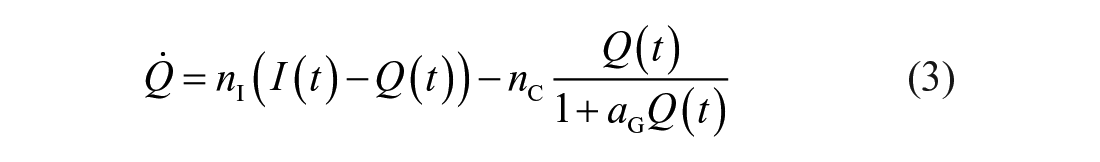
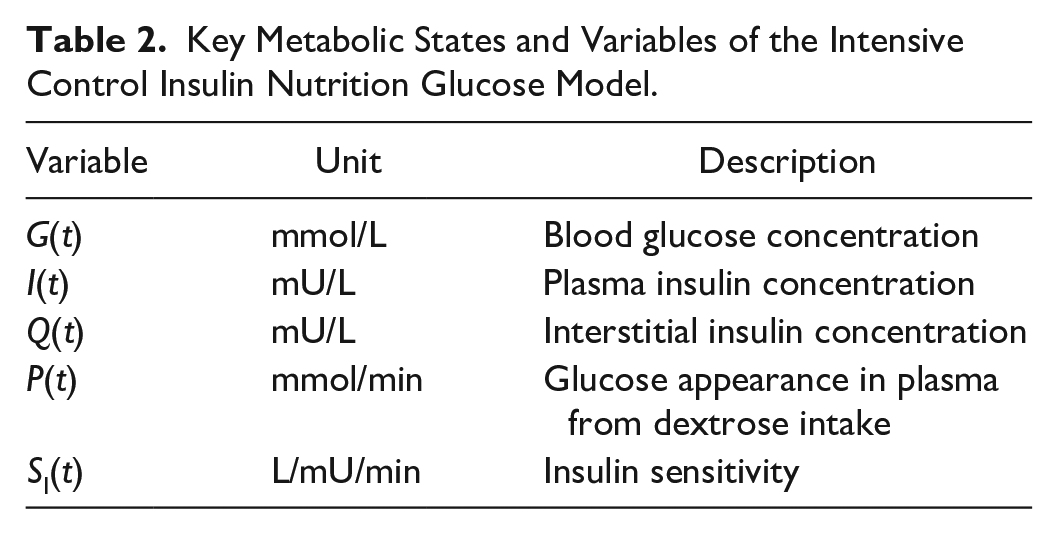
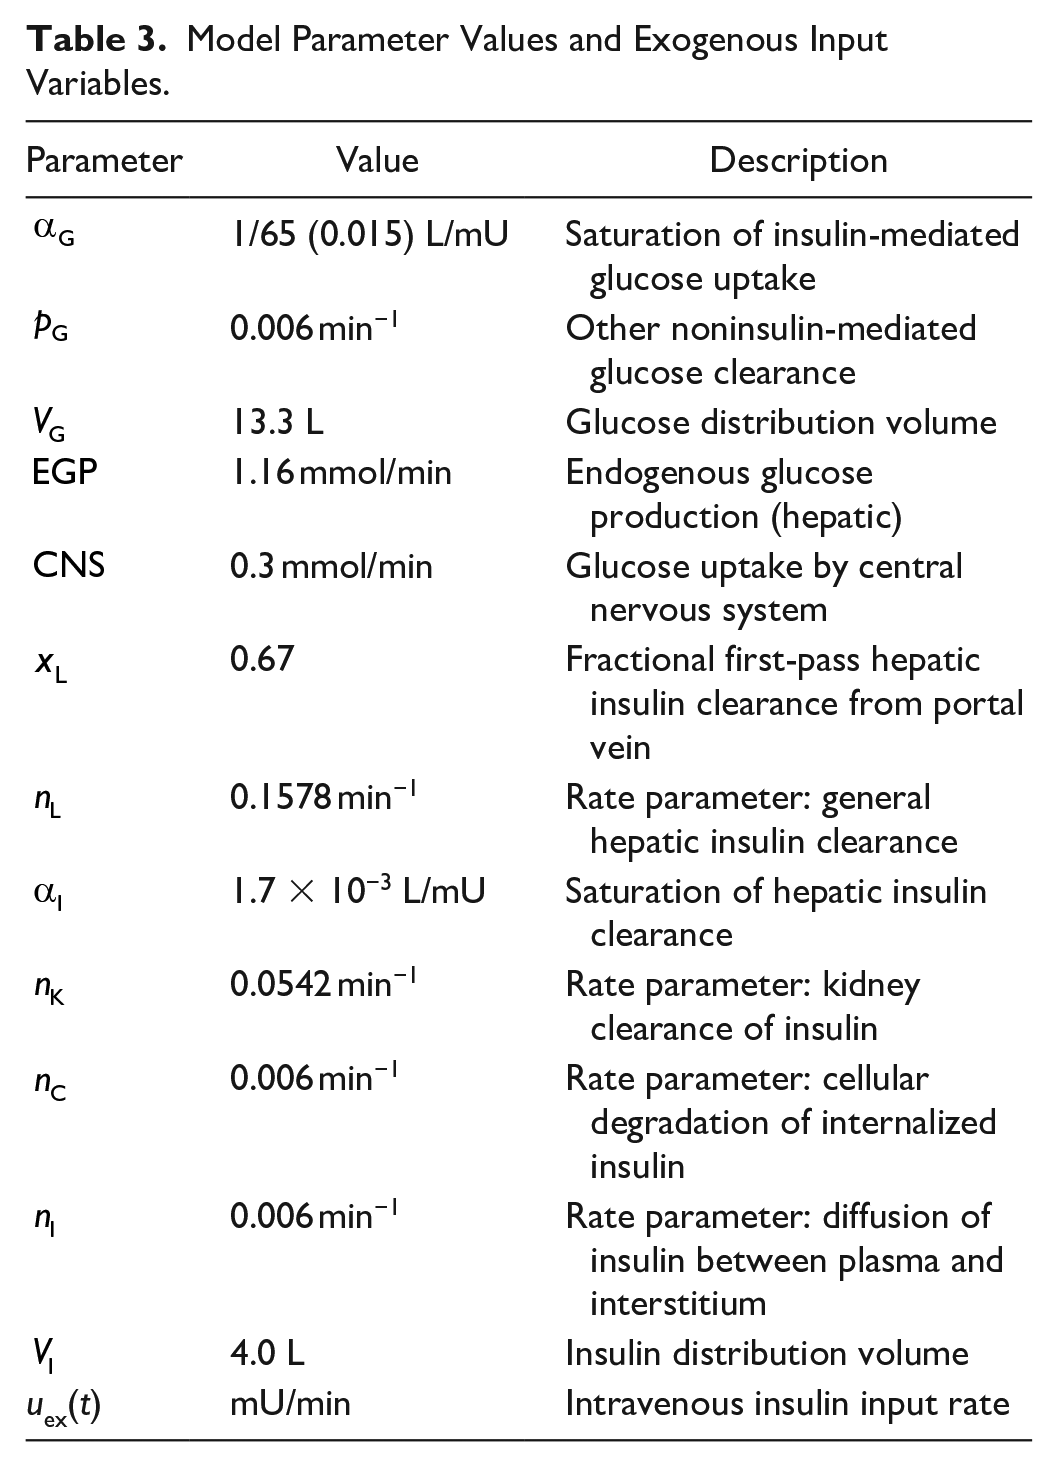
Table 2 shows key variables and Table 3 defines model parameters, rates, and constants. 51 The model is described elsewhere in detail. 33
Key Metabolic States and Variables of the Intensive Control Insulin Nutrition Glucose Model.
Model Parameter Values and Exogenous Input Variables.
Model-based insulin sensitivity (SI) and its relative change captures patient metabolic ability for insulin-mediated glucose uptake. An integral-based fitting method is used to identify hourly insulin sensitivity (SI) values based on clinical measurements of blood glucose, recorded insulin, and glucose administration in an identifiable problem.52,53
Physiological vs Numerical Zero
SI is identified from multiple inputs and is constrained or made to equal a value of 1e−7 L/mU/min 54 if the actual model-generated SI is less than 1e−7 L/mU/min. This is considered a “numerical zero,” as negative SI indicates an unphysiological rise in BG given a dose of insulin. This value has been used in the past to describe a nominal minimum SI value, as it is 100 times lower than clinically observed minimum values.21,25,31,54 However, the distribution of SI values in this study may also identify a higher “physiological zero,” a value representing a minimum insulin sensitivity occurring in critically ill patients. Cumulative distribution functions are used to assess SI distributions and the value below which there is minimal incidence to find an estimate of “physiological zero” for SI.
Calculation of Enhanced EGP
During periods when SI is identified lower than the numerical zero constraint (1e−7 L/mU/min) constraint, or a value below physiological zero (1e−5 L/mU/min), the model SI value can be constrained to the value of physiological zero. At this physiological zero value of SI, a new augmented EGP value could be calculated directly. This new calculated EGP value is a minimum or lower bound estimate of what the elevated EGP value could be at this time.
Using Equation (1), this lower bound estimate for the higher EGP can be calculated for a given hour or longer period:
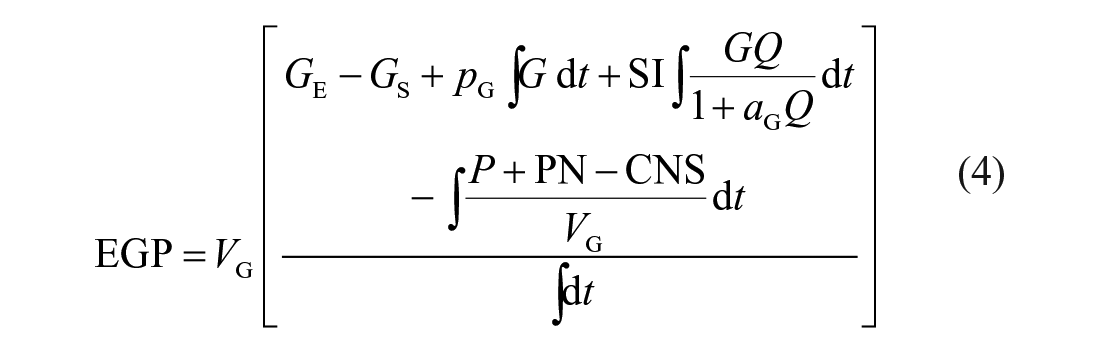
where GE is the end blood glucose concentration (mmol/L), GS is the starting blood glucose concentration (mmol/L), PN is enteral nutrition (mmol/min), and all other parameters are defined previously. Integrals are evaluated over the identified period where SI is constrained at 1e−7 L/mU/min, or the period when SI is below physiological zero.
Importantly, these lower bound EGP values are identified by abnormally low SI values. Values constrained to 1e−7 L/mU/min are clear limit states and the resulting BG error would be due to error in the assumed EGP population value. This approach thus separates clear cases where this value is in error and is thus a minimal estimate of enhanced EGP level and incidence.
Analyses
Patient hours when SI was constrained to numerical zero (1e−7 L/mU/min) are identified, that is, when the model-generated SI was less than 1e−7 L/mU/min and was set equal to 1e−7 L/mU/min. Time of occurrence and length of these events are tabulated, and single one-hour events are excluded in further analysis as they were found to be primarily due to data entry or sensor errors. Hence, all events lasting two or more consecutive hours are evaluated.
Endogenous glucose production can be a significant source of glucose flux and EGP rates may be significantly increased, over the assumed value, due to stress response in the most severely ill or injured ICU patients. Endogenous glucose production values were calculated for SI values of physiological zero as this was identified as a likely minimum SI. The range, time of occurrence, and frequency of these EGP values were evaluated and compared to clinical observations and expectations.
Results
Physiological vs Numerical Zero
Figure 1 shows the cumulative distribution function (CDF) of SI values identified. It can be seen that 99.5% of values are greater than 1e−5 L/mU/min and the maximum value is 7e−3 L/mU/min. There are only 0.73% of values between 1e−7 and 1e−5 L/mU/min with a further 1.6% of values constrained at 1e−7 L/mU/min, excluding one-hour events at this limit. Therefore, 1e−5 L/mU/min is taken as physiological zero and used to calculate minimum EGP values.
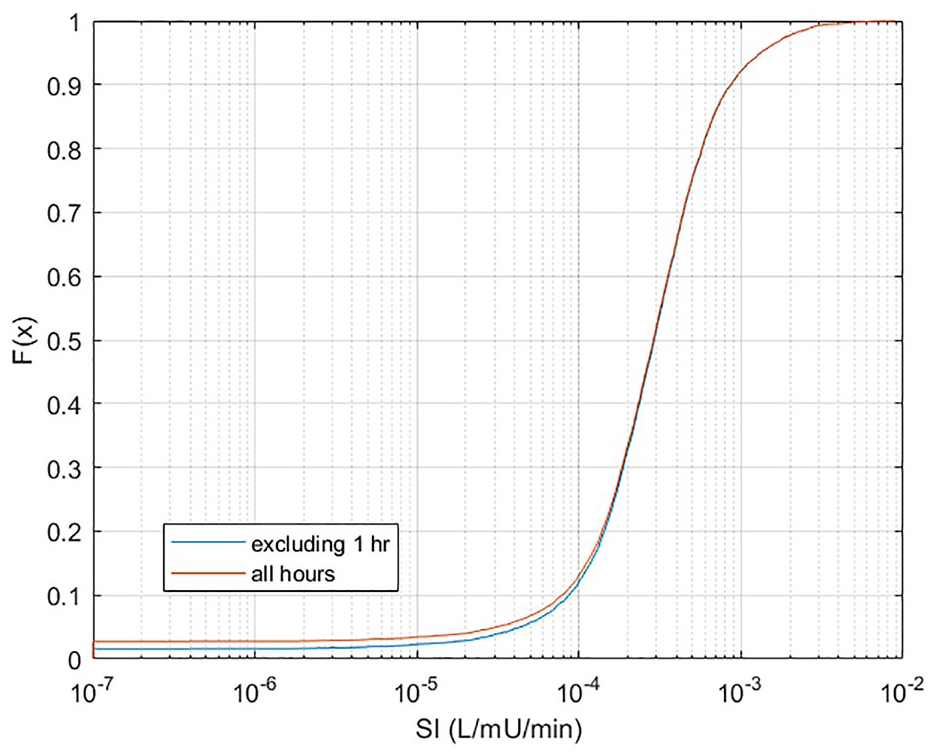
Cumulative distribution function of model-identified SI values for this cohort, with and without one-hour long SI = 1e−7 L/mU/min events. Note x-axis is a log scale.
Incidence of Constrained SI
There were 66 patients (46%) experiencing at least one constrained event (when SI < 1e−7 L/mU/min), comprising 1.6% of patient hours. Numerical zero was used to examine worst-case occurrence of constrained SI. Approximately 70% of constrained values (SI = 1e−7 L/mU/min) occur within the first 12 hours of patient stay and ~80% occur within the first 24 hours, as shown in Figure 2. Figure 2 shows that the incidence is highest in the first zero to six hours (45%-50%), dropping off as insulin therapy and patient stay continue.
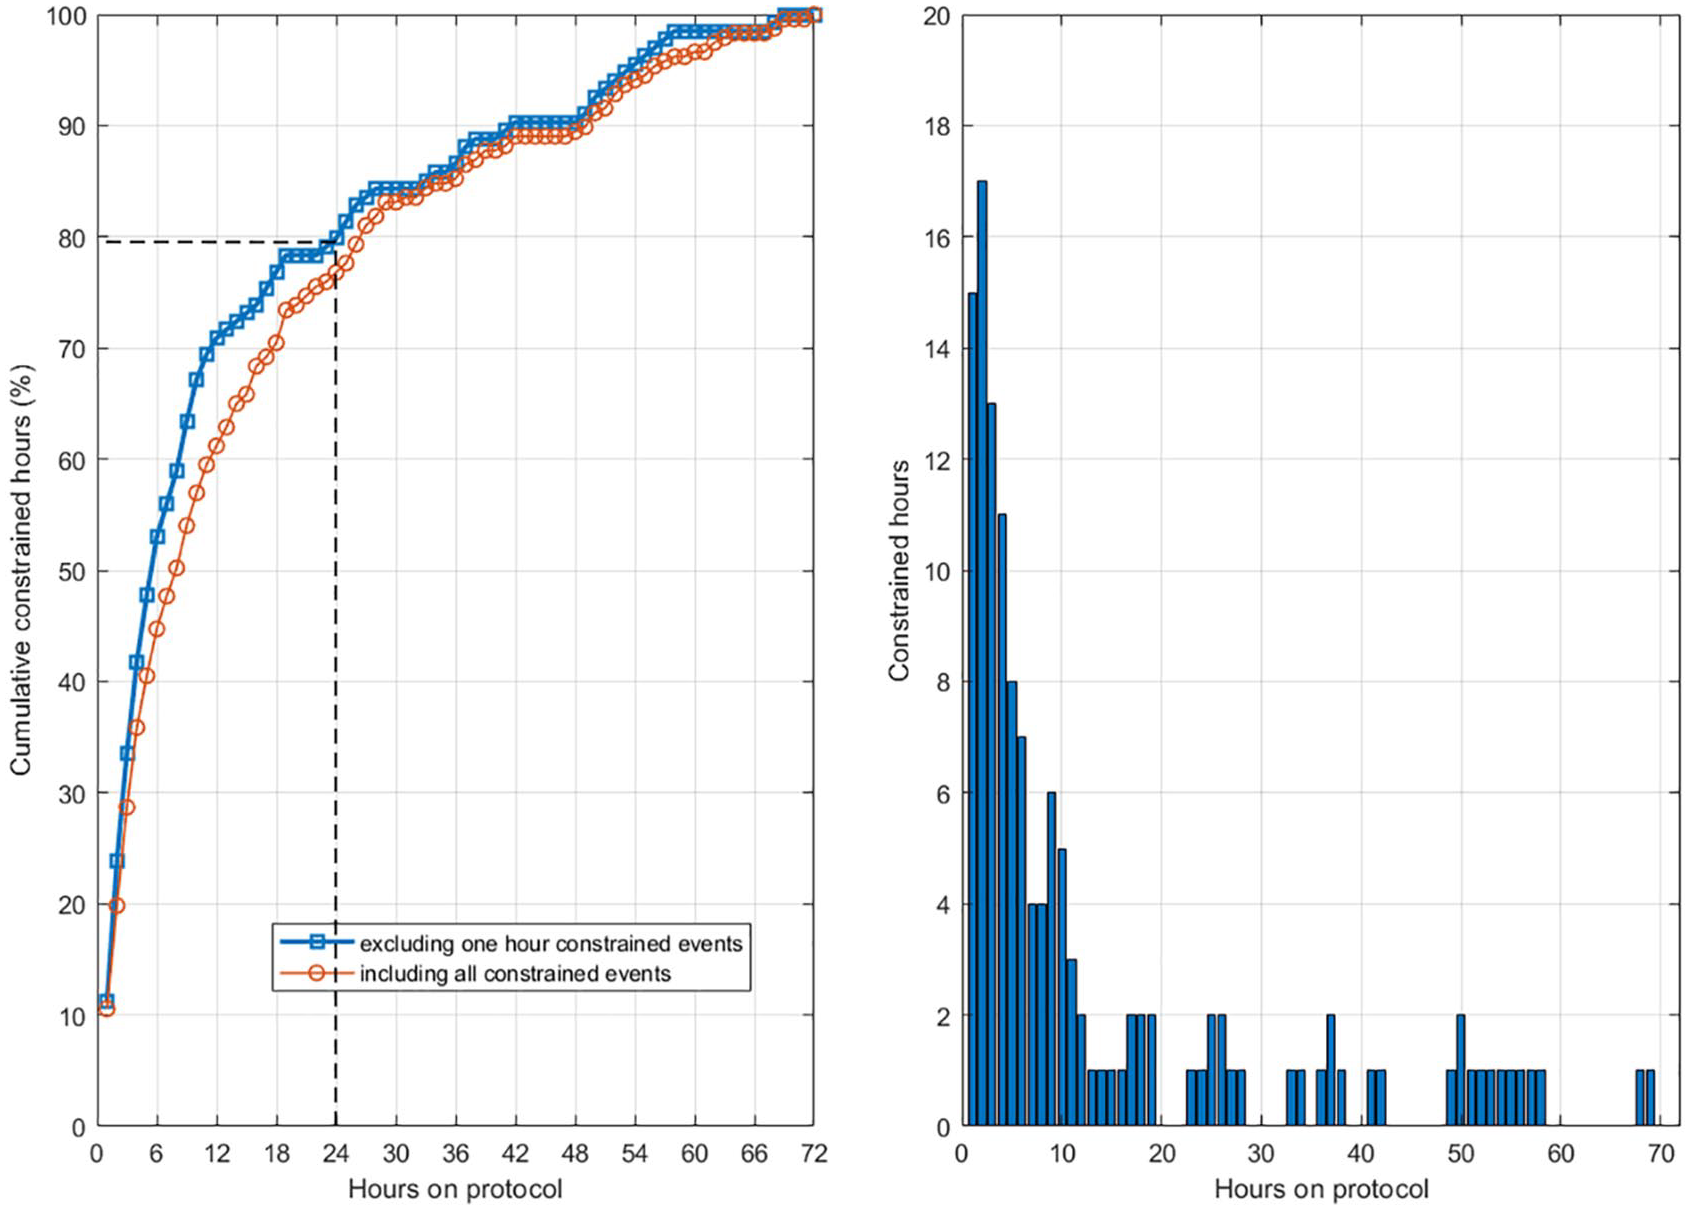
Cumulative distribution of patient hours when SI is constrained to numerical zero at 1e−7 L/mU/min. The y-axis is the cumulative percent of constrained hours. At 24 hours, ~80% of the constrained hours had occurred. The two lines show results with and without one-hour long SI = 1e−7 L/mU/min events. The right-hand plot shows the number of patient hours that are constrained as a function of time the patient was on the protocol.
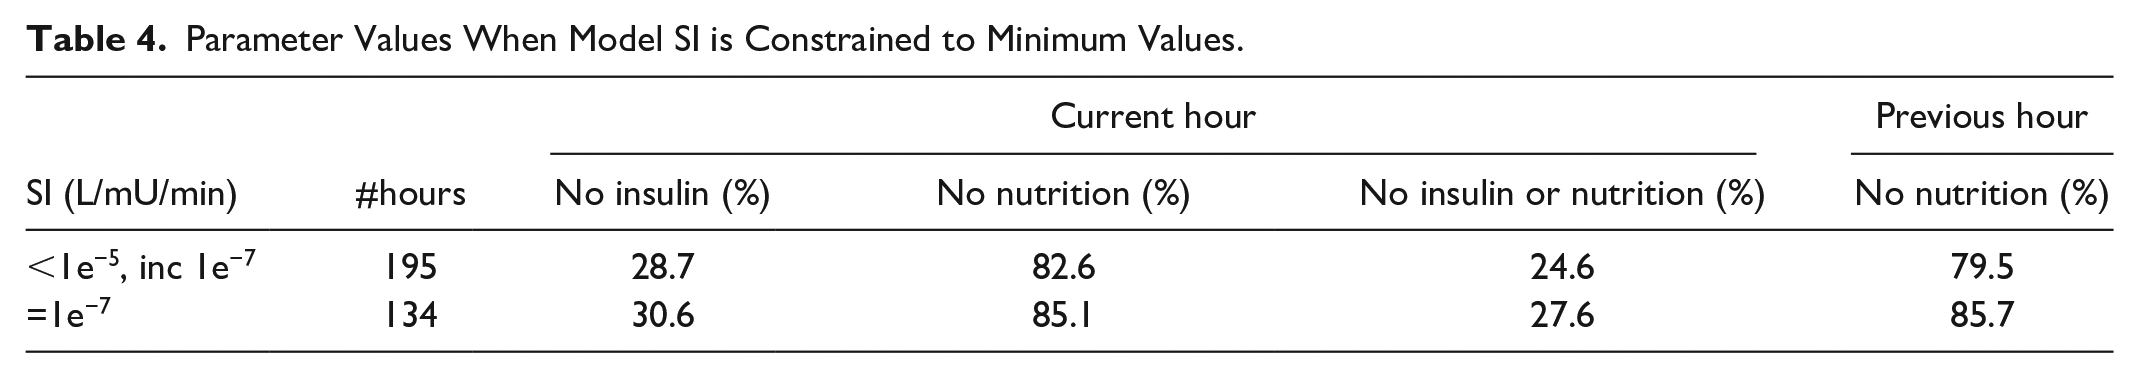
Table 4 shows insulin and dextrose/nutrition values during times when the model is constrained to numerical zero of 1e−7 L/mU/min. More than 80% of occurrences happen when nutrition inputs are zero. This result further suggests that the assumed EGP value is in error. In particular, with no (or low) exogenous nutritional intake, the model relies excessively on this population parameter’s accuracy to represent glucose flux. 55 It thus supports the choice of modifying the EGP parameter value in these cases and this analysis.
Parameter Values When Model SI is Constrained to Minimum Values.
Minimum EGP for Unconstrained SI
Minimum EGP values required for an unconstrained SI value are calculated using the physiological zero value of SI = 1e−5 L/mU/min and are shown in Figure 3. Most such enhanced EGP values are below 1.5 mmol/min, indicating up to a 0.34 mmol/min (21%) minimum increase in EGP over the assumed value of 1.16 mmol/min in Table 3 in these hours. However, 25% of values are above this level, with 5% above 1.8 mmol/min (55% increase).
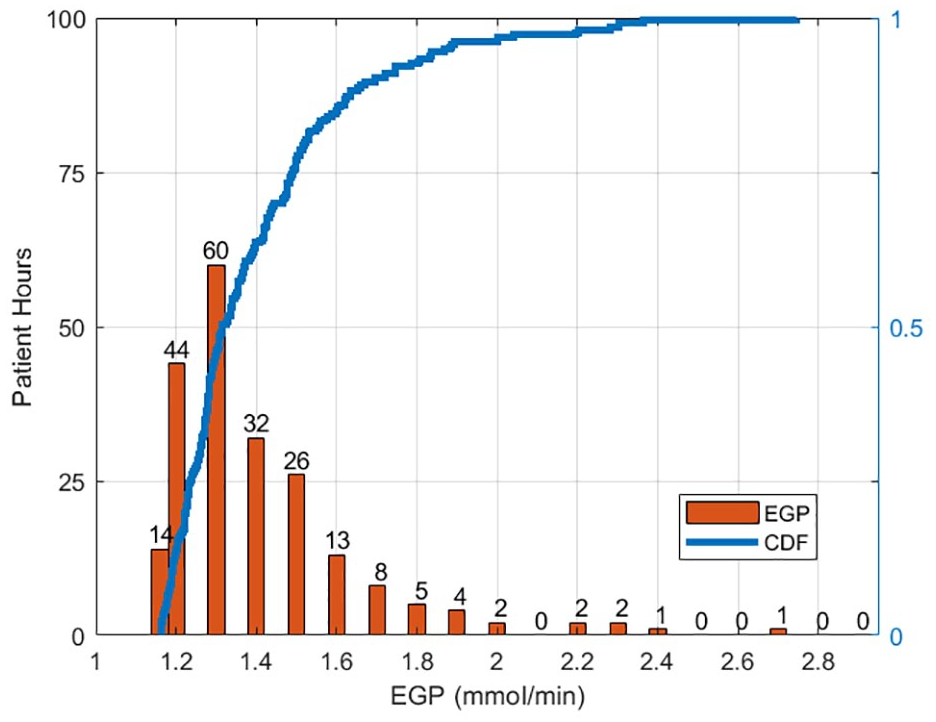
Minimum endogenous glucose production values required for good model fit SI constrained to minimum at physiological zero (1e−5 L/mU/min). The bar chart shows hourly incidence of minimum endogenous glucose production values (left), while the solid line charts the cumulative distribution for all hours (right).
Discussion
A model-based approach was used to evaluate periods of extremely low and constrained SI values of critically ill patients, likely indicating elevated levels of EGP. The incidence and concurrent parameter values during these events were also analyzed. The range of SI values in Figure 1 shows that 1e−5 L/mU/min can be thought of as “physiological zero,” which is 100 times lower than a typical individual with type 2 diabetes56,57 and captures the insulin resistance seen during stress response in critically ill patients. The release of catecholamines and glucagon promotes gluconeogenesis and glycogenolysis, and thus high endogenous glucose production despite high BG and plasma insulin concentrations which would normally downregulate liver sugar formation. 58
The release of stress hormones occurs most significantly at the onset of critical illness or trauma and can cause an increase in EGP. Increased rates of EGP can cause the model-generated SI to be (unphysiologically) below zero. These are extreme events when EGP is much higher than the constant population value used in the model. Less extreme events are not currently detectable, as the error in the model would be shown in the SI term (as long as it was above the constrained minimum).
The SI parameter in the mathematical model has shown physiological relevance in a range of clinical cases and interventions, as well as in the use for insulin sensitivity testing vs the gold standard euglycemic clamp.26,28,50,56,57,59-61 The constrained events are model dependent, and it is the fact that the model output requires constraints to be physiologically relevant that indicates the model is not adequately explaining the physiology in a small number of patient hours, which in turn opens the opportunity here to assess the (minimum difference) in EGP necessary to address that issue. Thus, it is possible in these identified cases to extend the model to make physiological inferences. In this case, deviation from behavior in a well-validated model is useful for identifying patients with unique (or more unique) needs or metabolism.
The timing of events was analyzed because it was expected to see a greater frequency of constrained events during the beginning of patient stay as the patient would be more likely to display a stress response and increased EGP values that would constrain the model. Constrained events are not limited to the start of patient stay, as patient deterioration can occur at any point, but it would be expected if the patient recently had surgery or suffered trauma as the reason for admission into the ICU.
Most of the constrained events (79.9%) occur in the first 24 hours on the protocol, which aligns with clinical observations of the initial stress response in critically ill patients.1,2,25,62 This outcome is clearly evident in Figure 3 and suggests that the model is able to identify the presence of extreme stress response (as increased EGP) in the SI value identified and resulting error in fitted BG.
During stress response, EGP can increase significantly and variably2,49,63 and partly contribute to the increased variability of insulin sensitivity in the initial stage of critical illness. 25 Glucose flux in Equation (1) is affected by EGP, and although the constant value of 1.16 mmol/min 33 used is suitable for most patients, some patients require adjustment of EGP, especially early in the stay when EGP can be significantly elevated as evidenced in Figure 2. The range of 1.16 to 2.75 mmol/min found in this study is within other published ranges of trauma patients41,43,64 and reflects a minimum EGP production as it is calculated based on a low, constrained SI value.
Although other parameters can affect the incidence of low SI through parameter trade-off, the most likely parameter in this case is EGP because of the known physiological response, and because 80% of occurrences happen when there is no exogenous nutrition being administered, as shown in Table 4. In general, excluding enhanced EGP, the only other source of glucose to keep BG elevated throughout a patient’s stay is the much greater rate of appearance from exogenous sources. Thus, model error in the case of low to no exogenous nutritional input is most likely due to this EGP parameter choice.
More specifically, the vast majority of patients and hours are fed at rates higher than the EGP term, thus minimizing this possible error. An implication of this outcome is that there may be patients with low but unconstrained SI, above physiological zero, who in reality have both higher EGP and higher peripheral SI. At this stage, there is no known way to identify these patients at the bedside without added data or intervention, making implementation of variable EGP based on bedside measures infeasible at this time, especially as it can rise or fall over time in the wide range found.
There can be error in identified SI in both directions from the population value chosen for EGP. The fact EGP is not directly identifiable from clinical data, without added tracer studies, renders this problem intractable, where a choice of value must be made. The population value used (Table 3) is higher than those for normal, healthy individuals and lower than possible for sepsis patients. 44 Thus, it is a compromise value, and as patients become well, it is likely too high and they are likely not going to need insulin or GC, whereas, as shown in the results and Figure 2, it is likely too low for some patients very early in stay and shortly after the initial insult.
There are a range of conditions that may also impact EGP including type 1 diabetes 65 and Addison’s disease 66 that would decrease EGP and type II diabetes and those on SGLT-2 inhibitors 67 would have increased EGP. This particular study did not investigate those factors in large part because we do not know of any large ICU patient data set with measurements of glucagon and counter-regulatory hormones, among those needed to precisely identify these issues. In addition, the data regarding patient demographics in Christchurch do not include prior conditions, indicative, for example, of alcoholism. Thus, the data density to get at these very interesting questions is not available for this study. In most of these cases, decreased EGP production would occur, while increased EGP production is the focus of this study. However, the results presented would justify trying to obtain such a data set to add greater precision to the overall sources of error in this well-validated and clinically used model in order to improve accuracy of care.
Endogenous glucose production and SI trade off in the model, and as the true EGP level in individual patients cannot be measured at the bedside, this analysis represents a relative exploration of changes in EGP. Identifying a joint or related set of EGP and SI values would add significant constraint to the system, which would not be valid unless there was a known functional relationship between SI and EGP, which currently is not known. Currently, identifying SI leads to a value including any error in EGP thus accounting for and effectively “changing” EGP, as well. A known value of EGP would thus add significant precision to the identified SI value. However, this value is variable over patients and time, showing significant intra- and interpatient variability,40-43,63,64,68 which creates the difficulty this research tries to mitigate for cases of extreme differences in EGP value leading to a nonphysiological SI value, which is, in turn, the added piece of data necessary to identify a minimum difference in EGP.
Data used in the analysis consisted of a mixed cohort from a single center population. Data from different clinical locations and population cohorts could increase the generalizability of the results seen in this analysis. However, the model used in this analysis has been proven both clinically and analytically33,34,69 in a range of clinical contexts.
Conclusion
Constrained events occurred most often in the first 12 hours of care, and this could reflect heightened EGP as part of the inflammation response that would be more likely at the beginning of patient stay in the ICU. Calculated EGP values showed that 95% of the values had up to a 55% increase from the population value of 1.16 mmol/min, with most being below 21% increase. The frequency of constrained events makes up less than 2% of patient hours, making the current population value sufficient; however, some patients experience significantly raised EGP probably due to an extreme stress response early in patient stay.
Footnotes
Declaration of Conflicting Interests
The author(s) declared no potential conflicts of interest with respect to the research, authorship, and/or publication of this article.
Funding
The author(s) disclosed receipt of the following financial support for the research, authorship, and/or publication of this article: The authors are supported by New Zealand National Science for Technology & Innovation Challenge (#CRS-53-2019) and MedTech Core (TEC, #370571).