
Abstract
Background:
Flash glucose monitoring (FGM) systems can reduce glycemic variability and facilitate blood glucose management within the target range. However, in critically ill patients, only small (n < 30) studies have examined the accuracy of FGM and none have assessed the stability of FGM accuracy. We evaluated the accuracy and stability of FGM in critically ill patients.
Method:
This was a single-center, retrospective observational study. We included a total of 116 critically ill patients who underwent FGM for glycemic control. The accuracy of FGM was assessed as follows using blood gas glucose values as a reference: (1) numerical accuracy using the mean absolute relative difference, (2) clinical accuracy using consensus error grid analysis, and (3) stability of accuracy assessing 14-day trends in consensus error grid distribution.
Results:
FGM sensors remained in situ for a median of 6 [4, 11] days. We compared 2014 pairs of measurements between the sensor and blood gas analysis. Glucose values from the sensor were consistently lower, with a mean absolute relative difference of 13.8% (±16.0%), than those from blood gas analysis. Consensus error grid analysis demonstrated 99.4% of the readings to be in a clinically acceptable accuracy zone. The accuracy of FGM was stable across the 14 days after device insertion.
Conclusions:
FGM had acceptable reliability and accuracy to arterial blood gas analysis in critically ill patients. In addition, the accuracy of FGM persisted for at least 14 days. Our study promotes the potential usefulness of FGM for glycemic monitoring in critically ill patients.
Keywords
Introduction
In critically ill patients, endogenous factors (eg, increased stress hormones and insulin resistance) and exogenous factors (eg, catecholamine, insulin, and nutrition) dynamically affect blood glucose levels. 1 Hyperglycemia causes increased oxidative stress, activation of inflammatory response pathways, and impaired immune function.2,3 Hypoglycemia causes seizures and arrhythmias, with an increasing risk of mortality.4,5 Observational studies reported the importance of not only preventing hyper/hypoglycemia, but also of reducing glycemic variability6,7 because greater glycemic variability may be associated with higher mortality even if blood glucose levels are within the target range. 8 However, it is difficult to measure actual glycemic variability using a blood glucose test (eg, blood gas, portable meters) in the clinical setting.
The continuous glucose monitoring system has the potential to reduce glycemic variability and make it easier to achieve blood glucose levels. 9 To date, many continuous glucose monitoring devices with invasiveness to functionality have been used to measure the blood glucose levels of patients.10-12 In the intensive care unit (ICU), subcutaneous continuous glucose monitoring devices are attractive in terms of invasiveness and device cost. In addition, there is a newer subcutaneous blood glucose monitoring device called Flash Glucose Monitoring (FGM), which is a hybrid of regular blood glucose monitoring and continuous glucose monitoring. Thus, the FGM provides both individual blood glucose values (like regular blood glucose monitoring) and trend information (like continuous glucose monitoring).
Although this innovative device may be helpful for optimal glucose management, only small (n < 30) studies have examined the accuracy of FGM in critically ill patients.13-15 In addition, no studies have evaluated whether the accuracy of FGM persists for up to 14 days in critically ill patients. To address this knowledge gap, we evaluated the accuracy and stability of subcutaneous FGM in critically ill patients.
Methods
Study Design and Setting
This was a retrospective observational study using data from the Hitachi General Hospital between November 1, 2019 and March 31, 2020. Hitachi General Hospital is a tertiary Emergency and Critical Care Center, which serves a population of approximately 3 million people. There are 27,000 annual emergency department visits. The Hitachi General Hospital has 18-beds ICU and 6-beds cardiac care unit. Of the 18 ICU beds, 8 have a 2:1 patient/nurse ratio and the remaining 10 have a 4:1 patient/nurse ratio. The ICU physicians manage all critically ill patients (both intrinsic and extrinsic) except for patients after cardiovascular surgery. The ICU physicians input clinical information into the ICU database, which automatically updates the patients' medical charts. The study protocol was approved by the ethics committee of Hitachi General Hospital (2017-95). The need for informed consent was waived based on the retrospective design.
Study Population
In the ICU of Hitachi General Hospital, the FGM device, FreeStyle Libre (Abbott Diabetes Care, Alameda, CA, USA), 16 has been used for patients with difficulty in glycemic control with an arterial line such as those requiring continuous insulin infusion under direction of the intensivist. The FGM device was not fitted for patients who were (1) aged <20 years or (2) expected to leave the ICU within 48 hours.
Glycemic Control in the ICU
In the ICU, the staff routinely collects blood gas every 8 hours (3 times per day) in patients with arterial lines. The sensor of FGM was inserted on the back of the upper arm within 48 hours after ICU admission. The factory-calibrated FGM sensor does not require additional calibrations and can be used up to 14 days. The system measures the current interstitial glucose level every minute and records the data automatically every 15 minutes. All blood glucose values were measured using a blood gas analyzer (ABL90 FLEX, Radiometer, CPH, DK). Insulin was usually administered as a continuous infusion at a 1 U/mL concentration using a syringe pump with a target glucose range of 70 to 180 mg/dL. Although the adjustment of the insulin dose and its timing is at the intensivist’s discretion, the standard protocol of glycemic control in the ICU (Supplemental Figure S1) is as follows: (1) start continuous IV insulin when blood glucose is >180 mg/dL (for patients receiving continuous nutrition), (2) discontinue IV insulin when blood glucose decreases to <100 mg/dL, and (3) IV dextrose when blood glucose decreases to ≤70 mg/dL. The dose of insulin infusion was adjusted based on blood glucose levels from blood gas analysis, not only on the value of FGM.
Data Collection
Among the glucose levels with FGM automatically stored every 15 minutes, we used the value at the time closest to the time when blood gas was actually collected. We extracted information on patient demographics (age, sex, body mass index [BMI]), patient severity (acute physiology and chronic health evaluation [APACHE]-2 score and sequential organ failure assessment [SOFA] score), and disease category. The APACHE-2 and SOFA scores were calculated based on vital signs and blood test results measured on ICU admission. Using the measured blood gas glucose values, the mean blood glucose, glycemic variability, and time in range of 70 to 180 mg/dL were calculated. In addition, we extracted information on the duration of continuous renal replacement therapy, mechanical ventilation, extracorporeal membrane oxygenation, length of ICU and hospital stay, and in-hospital mortality.
Statistical Analysis
Summary statistics were used to describe the characteristics of the study participants. Results are expressed as percentages for categorical variables, mean and standard deviation (±SD) for continuous normally distributed variables, and median and interquartile range (IQR) for continuous non-normally distributed variables. Missing data were observed in 2.6% for height and weight, but there were no missing glucose data. As the dynamic range of glucose levels with FGM is 40 to 500 mg/dL, outliers are displayed as “High” or “Low.” In this study, we replaced “High” with “500 mg/dL” and “Low” with “40 mg/dL” for the FGM data.
We assessed the accuracy and stability of the subcutaneous FGM system as follows: (1) numerical accuracy using values of FGM and blood gas analysis data, (2) clinical accuracy to assess whether the measurement error was clinically acceptable, and (3) stability of accuracy. In addition, we repeated these analyses after stratifying by (i) the presence of comorbid diabetes or (ii) catecholamine use as sensitivity analysis. A two-sided P-value of <.05 was considered significant. Statistical analyses were performed using R version 4.0.2. (The R Foundation for Statistical Computing).
Numerical accuracy
First, Pearson correlation coefficients were calculated between FGM and blood gas analysis data to examine the correlation. Second, we examined numerical accuracy by calculating the mean absolute relative difference (MARD). MARD is a benchmark for the accuracy of testing methods (ie, FGM in this study). While there is no definite consensus for the interpretation of MARD, we have interpreted MARD according to the previous studies as follows.13,17 A value <14% represents acceptable accuracy, a value between 14% and 18% represents intermediate accuracy, and a value >18% represents low accuracy. The MARD is calculated using the following formula using the FGM and blood gas analysis values measured at the same time.
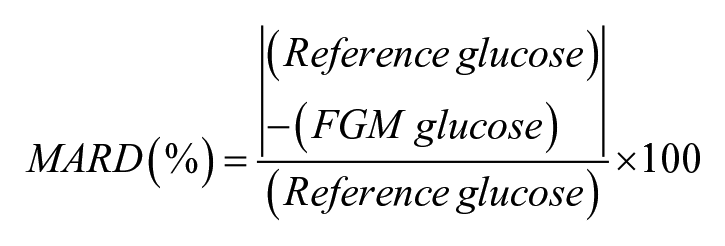
Third, we evaluated systematic errors in blood glucose levels between FGM and blood gas analysis using Bland-Altman analysis. 18 The Bland-Altman analysis is one of the methods to examine whether the measurements are contaminated with systematic errors. It is a method for visually checking the presence and extent of systematic errors (fixed and proportional errors) in these measurements by creating a scatter plot of the differences between 2 paired measurements on the y-axis and the mean of the 2 paired measurements on the x-axis. In addition, the Kruskal-Wallis test was used to assess the proportional error. Based on the reference blood glucose level, pairs of glucose data were divided into 3 groups (Below target [<70 mg/dL], Within target [70-180 mg/dL], and Above target [>180 mg/dL]), and the differences in MARD values were compared for each group.
Clinical accuracy
We assessed whether the measurement error was clinically acceptable in the following error grid analyses. Consensus error grid (CEG) 19 and surveillance error grid (SEG) 20 analyses were used to assess the magnitude of clinical risk due to inaccurate data obtained using FGM. The CEG analysis plots paired glucose samples in 5 different zones (A, B, C, D, and, E). Zone A represents glucose values that do not deviate by more than 20% from the reference. Zone B values are outside zone A and are not expected to harm the patient when clinical care is considered. Zone C values can result in overcorrection of acceptable blood glucose values, which may lead to hypoglycemia or hyperglycemia. Zones D and E represent a dangerous failure to treat zone. Zones C, D, and E are potentially dangerous. In short, more values in zones A and B indicates higher the clinical accuracy of the testing method (ie, FGM in this study). The values of zones A and B must be greater than 99% in order for the testing method to be clinically accurate. SEG analysis performs detailed risk categorization and scores the risks, enabling more granular risk assessment than traditional CEG analysis.
Stability of accuracy
The stability of the accuracy of FGM was assessed. The numerical accuracy was assessed by the MARD values and the clinical accuracy by the results of the CEG analysis. The MARD values and the percentage of each zone in the CEG analysis were analyzed day by day over 14 days.
Results
Patients Characteristics
From November 2019 through March 2020, there were consecutive 282 patients admitted to the ICU. Of these, we excluded 3 children under the age of 20, 128 patients expected to leave ICU within 48 hours, and 35 patients did not need continuous insulin therapy, and the remaining 116 patients were fitted with FGM devices. In total, 116 patients with 2014 pairs of blood gas and FGM data were eligible for the primary analysis (Figure 1).
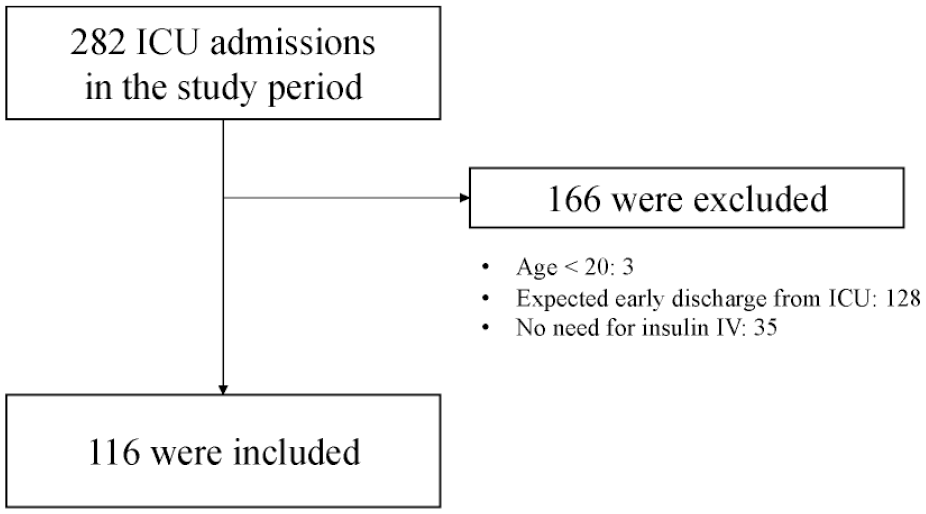
Study flow.
Characteristics of the 116 study patients are shown in Table 1. The median age was 73 years, 62% were male, and the median BMI was 21.6. The median HbA1c on admission was 5.9%, 3 patients had type 1 diabetes, 49 patients had type 2 diabetes, and the remaining 64 patients did not have diabetes. Six patients had an HbA1c on admission higher than 6.5% despite not having been diagnosed with diabetes before admission. The median APACHE-2 and SOFA scores on admission were 19 and 7, respectively.
Characteristics of Critically Ill Patients Managed by Flash Glucose Monitoring.
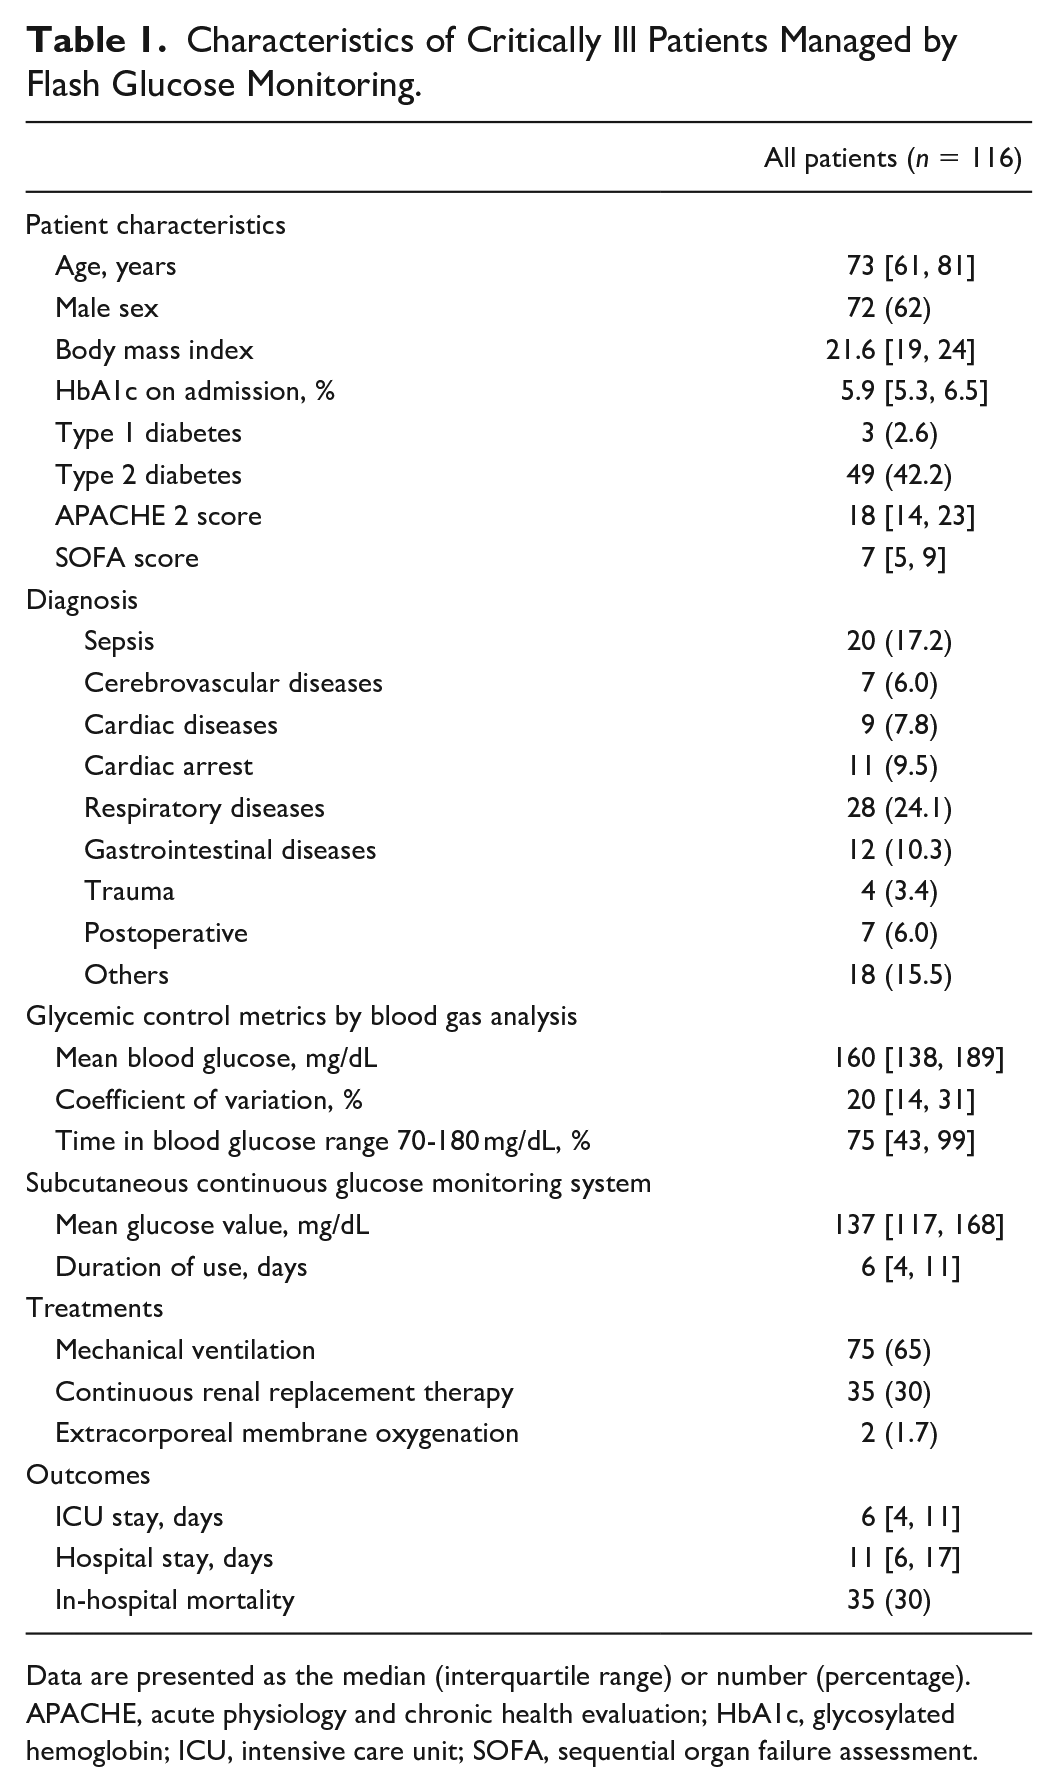
Data are presented as the median (interquartile range) or number (percentage).
APACHE, acute physiology and chronic health evaluation; HbA1c, glycosylated hemoglobin; ICU, intensive care unit; SOFA, sequential organ failure assessment.
Blood glucose-related parameters measured using the blood gas analyzer included a mean blood glucose of 160 mg/dL, median coefficient of variation of 20%, and median time in a blood glucose range of 70-180 mg/dL of 75%. The mean blood glucose measured by FGM was 137 mg/dL.
All FGM sensors functioned well and no patient has had to replace the sensor due to sensor failure or detachment. In addition, there were no adverse events, such as bleeding, skin irritation, or patient complaints, due to the sensor attachment.
Numerical Accuracy
The accuracy of the FGM data is shown in Table 2. The glucose values of FGM correlated well with the reference glucose values measured by blood gas analysis (Pearson’s correlation coefficient was 0.92, with a slope of 0.99 and an intercept of −19.0 mg/dL). The MARD was 16.2%, which represents intermediate accuracy. The Bland-Altman plot (Figure 2) visually indicates the systematic (fixed) errors in the values of FGM. The glucose levels measured by FGM were likely to be lower than actual blood glucose levels (the mean %error was −13.8%). The plot also indicated that %error was often negative at lower glucose levels, whereas the %error was often positive at higher glucose levels. The accuracy of FGM significantly improved with higher reference glucose values (MARD, 20% for the target range of <70 mg/dL, 15% for that of 70-180 mg/dL, and 10% for that of >180 mg/dL; Table 3 and Figure 3).
Accuracy of Flash Glucose Monitoring for Blood Gas Analyzers.
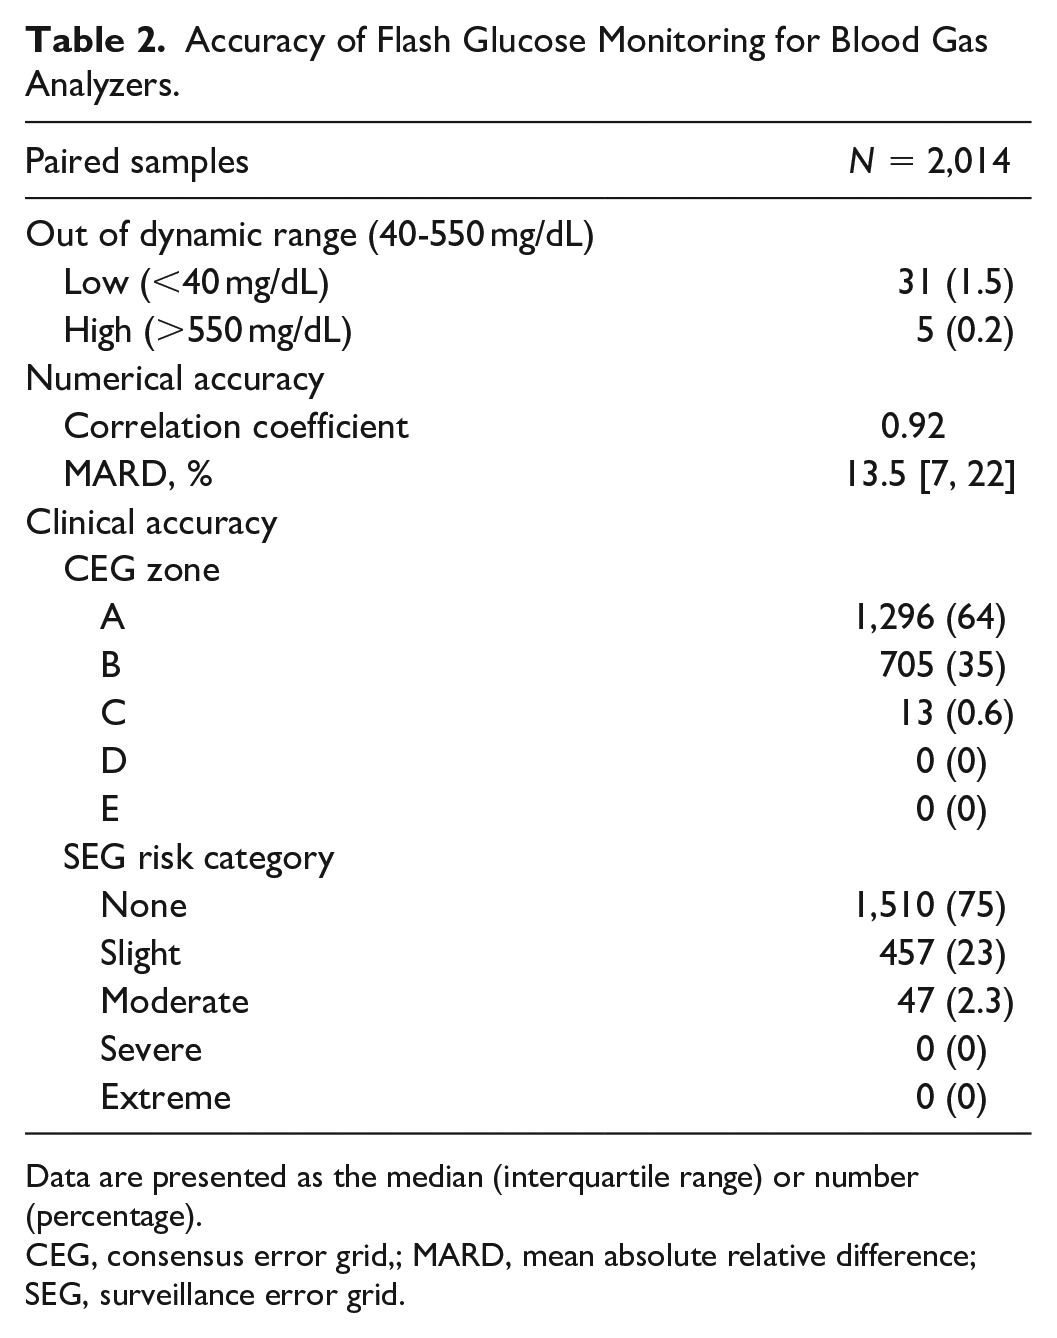
Data are presented as the median (interquartile range) or number (percentage).
CEG, consensus error grid,; MARD, mean absolute relative difference; SEG, surveillance error grid.
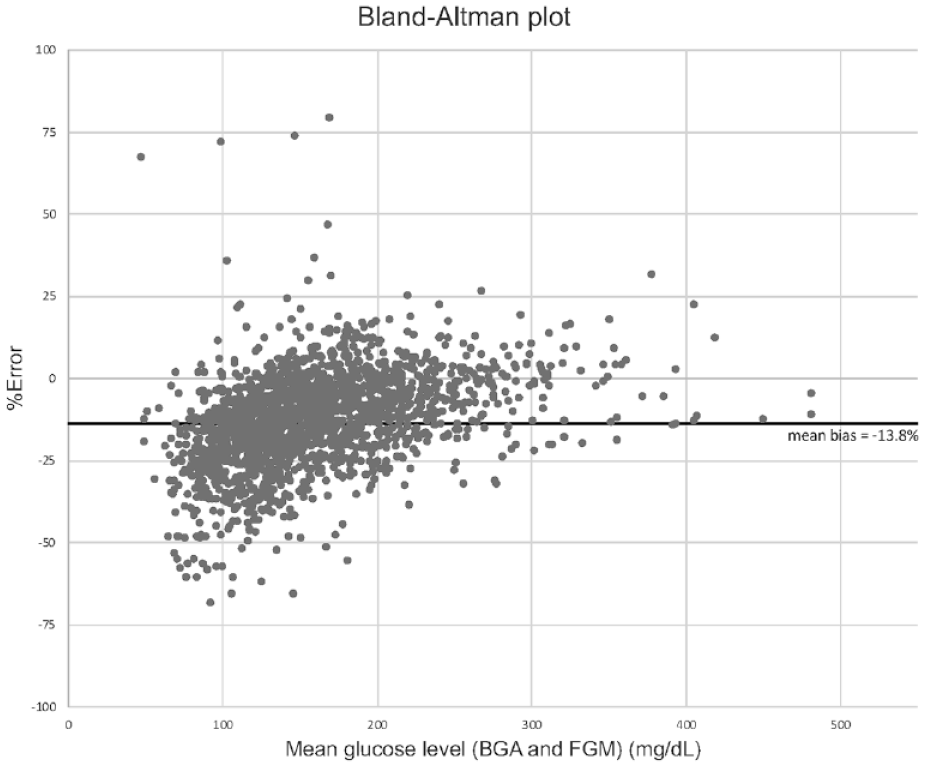
Bland-Altman plot of the agreement between glucose values in flash glucose monitoring and blood gas analysis. The Bland-Altman plot was created with the difference between the 2 measurements (flash glucose monitoring and blood gas analysis) plotted on the y-axis in % and the mean of the 2 glucose measurements plotted on the x-axis to visualize the presence and extent of systematic errors in those measurements.
Accuracy of Flash Glucose Monitoring According to the Reference Blood Glucose Ranges.
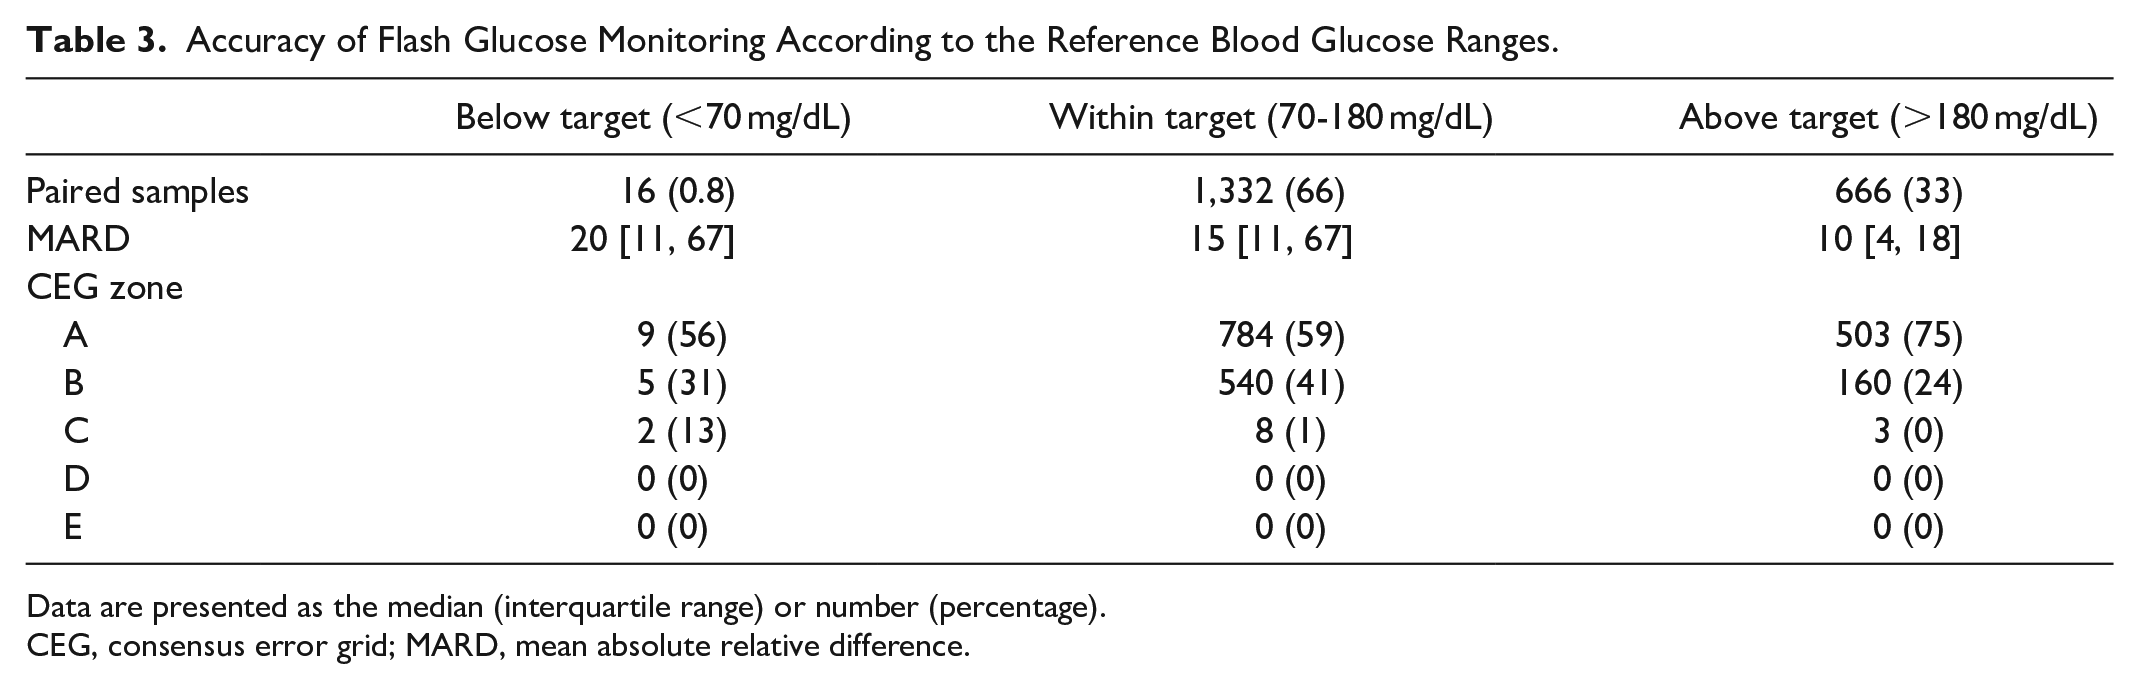
Data are presented as the median (interquartile range) or number (percentage).
CEG, consensus error grid; MARD, mean absolute relative difference.
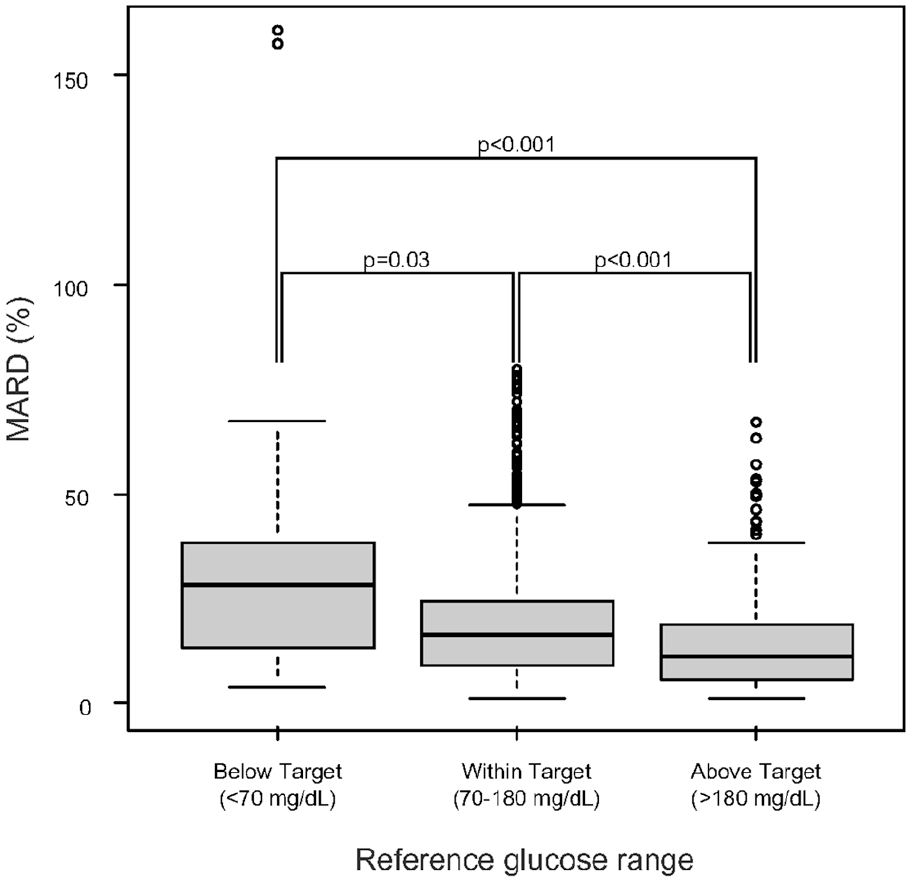
Association between mean absolute relative difference and blood glucose ranges. Comparison of the accuracy of flash glucose monitoring against blood gas analysis in different blood glucose ranges. The accuracy (assessed by MARD) was significantly lower below the target range (hypoglycemic range) and significantly higher above the target range (hyperglycemic range). This was in consistent with the Bland-Altman plot.
Clinical Accuracy
The clinical accuracy evaluating by CEG and SEG analyses is shown in Figure 4. The CEG analysis revealed the clinical accuracy to be sufficient because 99.4% of the paired samples were in zone A (64.4%) or B (35.0%). The SEG analysis revealed 2.3% of the paired samples (n = 47) to be within the category of moderate risk, and none within the category of severe or extreme.
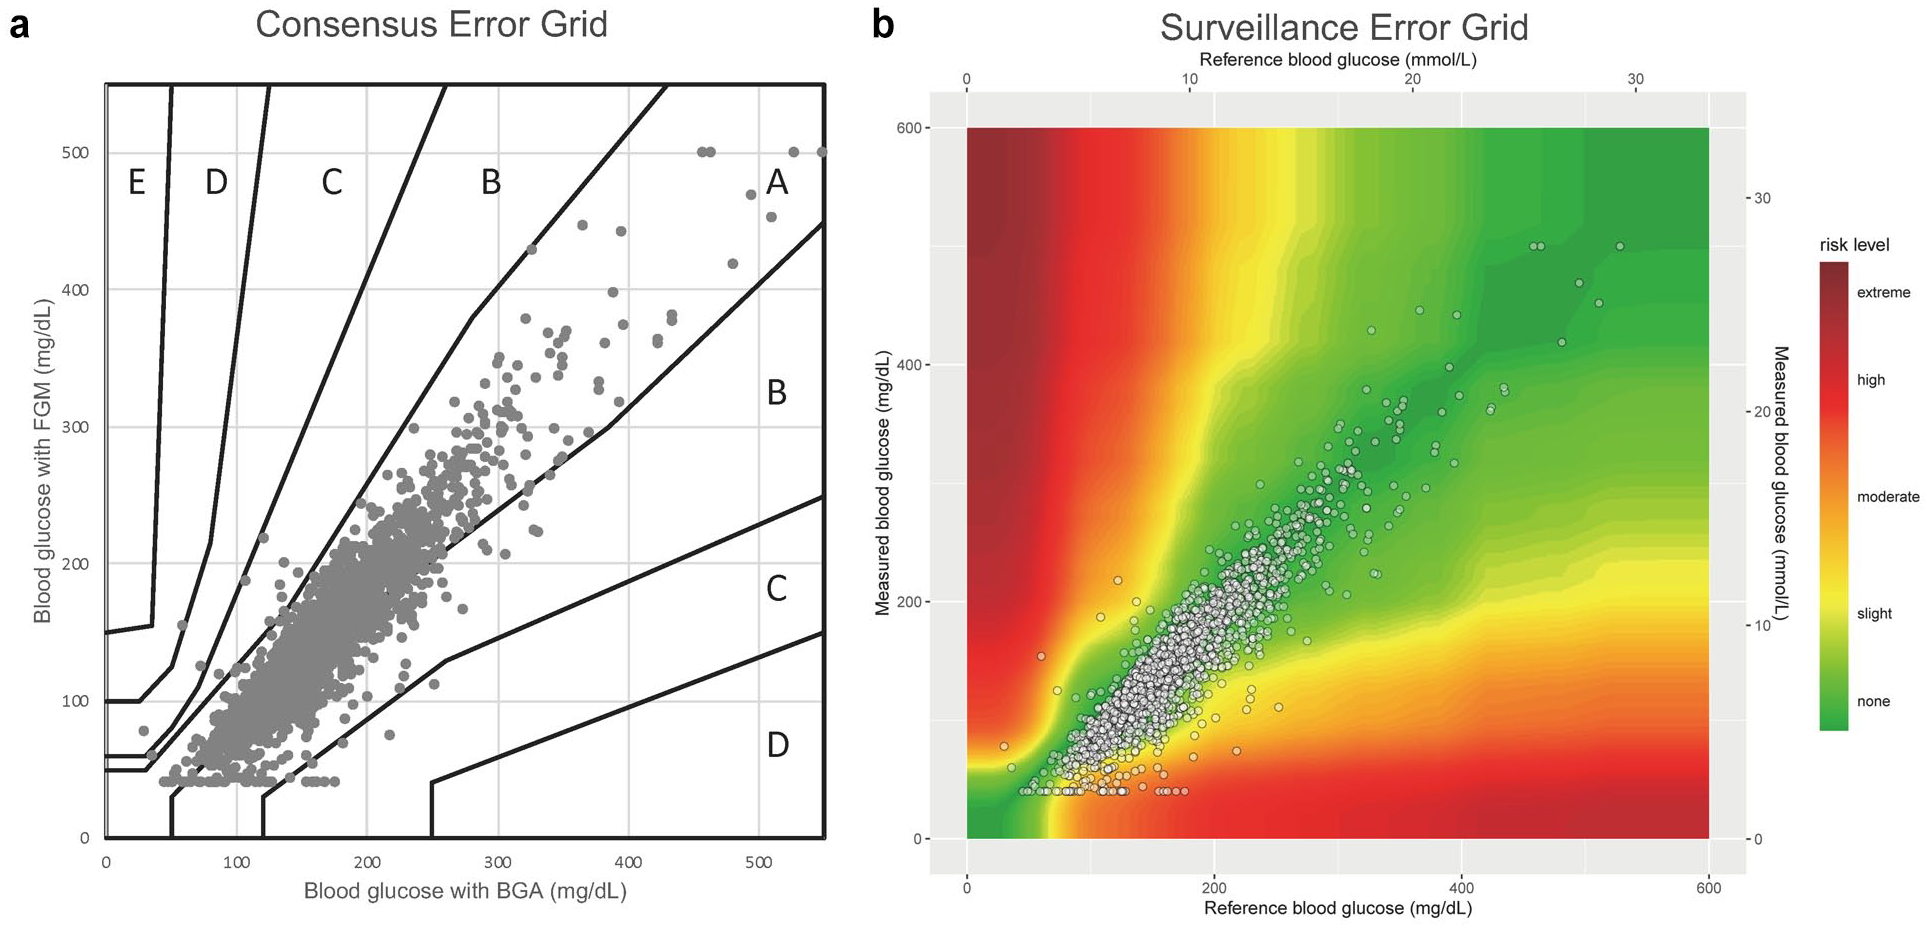
Consensus error grid and surveillance error grid analysis. (a) The consensus error grid analysis against BGA (2,014 measurements) showed that 64% and 35% of glucose levels measured using the FGM fell into zones A and B, respectively. (b) Similarly, in the surveillance error grid analysis performed using SEG software (https://www.diabetestechnology.org/seg/) for BGA, 98% of the glucose levels measured using FGM fell into the “None” or “Slight” risk categories. These results support the accuracy of FGM against blood gas analysis.
Stability of Accuracy
The clinical accuracy of FGM was stable across the 14 days after implementation (Table 4). Clinically acceptable accuracy in the CEG analysis (ie, zones A and B were >99%) was found in most of the 14 days (Figure 5). The numerical accuracy assessed by MARD remained at approximately 14% over time and was mostly intermediate. However, the percentage of CEG zone A alone gradually decreased after day 10 (Table 4 and Figure 5).
Accuracy of Flash Glucose Monitoring in Day-to-Day Aanalysis.
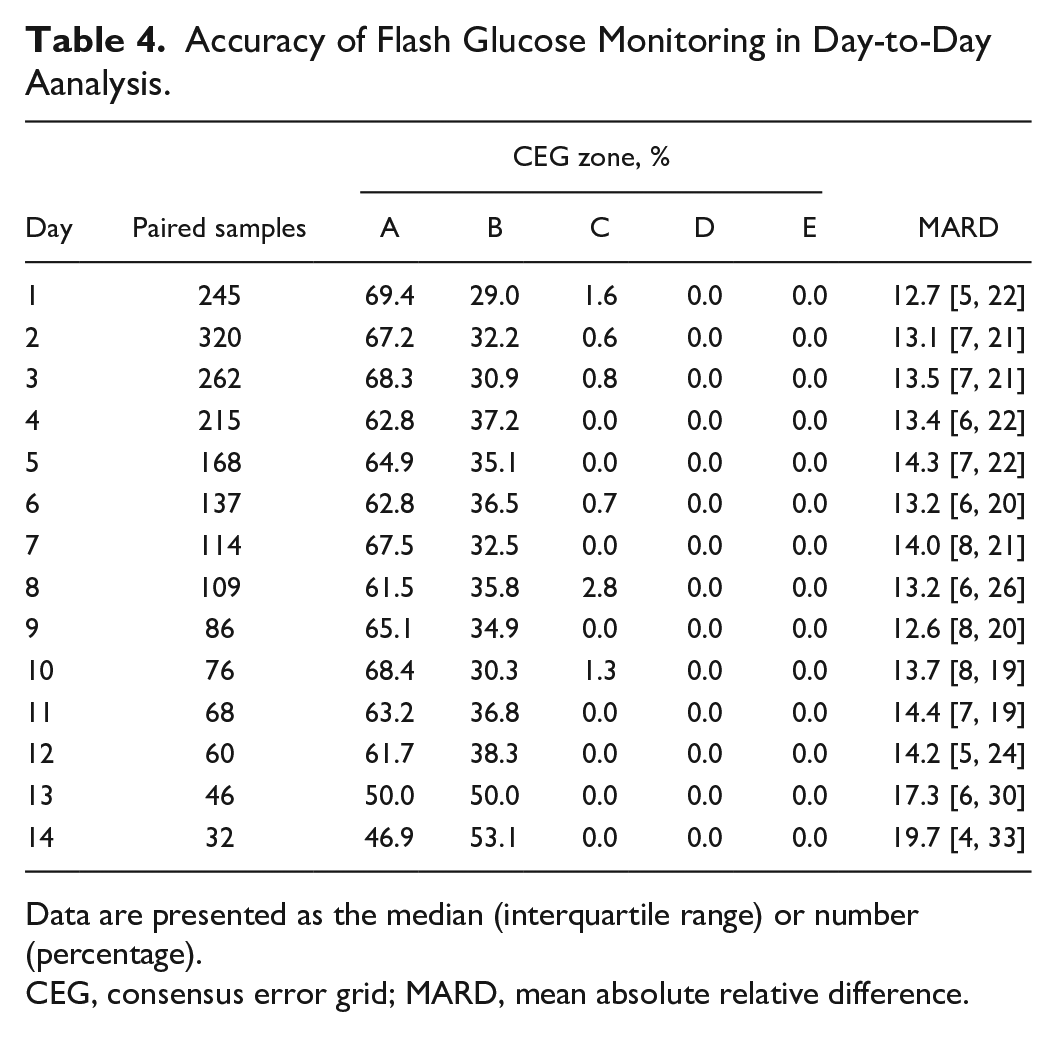
Data are presented as the median (interquartile range) or number (percentage).
CEG, consensus error grid; MARD, mean absolute relative difference.
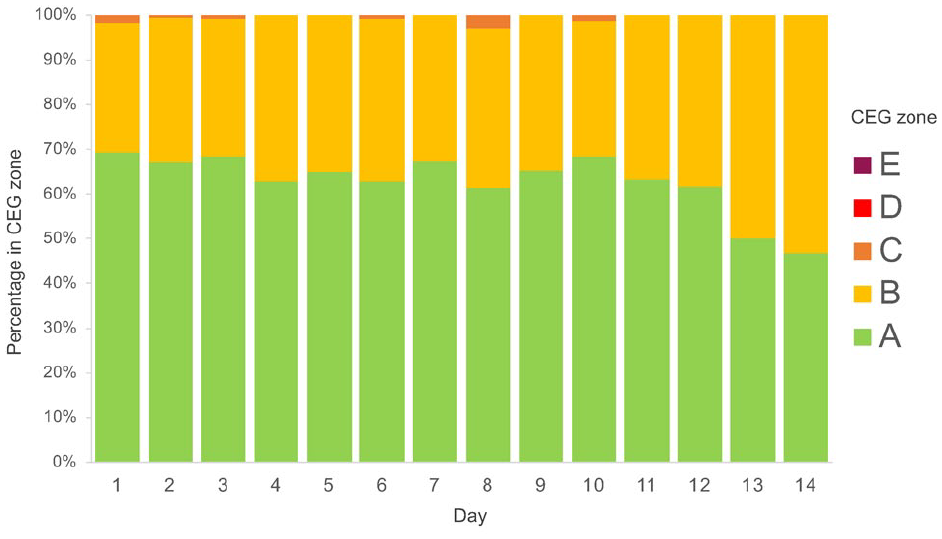
Stability of accuracy across 14 days of flash glucose monitoring. Most of the totals in zones A (green) and B (yellow) in consensus error grid analysis were above 99% for 14 days, demonstrating that the accuracy of flash glucose monitoring against blood gas analysis was not impaired for 14 days.
Sensitivity Analysis
We repeated these analyses with the stratification by the presence of (i) diabetes or (ii) catecholamine use. In the sensitivity analysis stratified by the presence of comorbid diabetes, patients with diabetes had lower MARDs and a greater proportion of zone A in the CEG analysis (Supplemental Table S1). Seventy-two patients (62%) received catecholamines during their ICU stay. There was no difference in MARD in the catecholamine group compared to the non-catecholamine group (15% [9%-21%] vs. 14% [8%-18%], P = .19; Supplemental Table S2).
Discussion
In this study, we demonstrated FGM to have high reliability and moderate accuracy compared with arterial blood gas analysis in critically ill patients. Furthermore, the clinical accuracy of FGM remained 14 days after implementation.
FGM had high reliability and acceptable accuracy in critically ill patients. In this study, the numerical accuracy of FGM was intermediate, with a MARD of 16.2%, similar to the results of previous studies in critical care and surgical ICUs (MARD, 12%-14% in adult patients and 13% in children).13-15 In addition, more than 99% of the CEG analyses were in zone A or B, which is acceptable for clinical accuracy and comparable with the previous findings (eg, approximately 98%-99%).13,14 In the sensitivity analysis, the MARD of patients with diabetes was lower than that of patients without diabetes. Also, there was no difference in MARD between patients with and without catecholamine use, consistent with previous studies.21,22 The observed clinical accuracy of FGM improves current evidence by using the data of a larger sample size than previous studies and including patients with different diseases with and without diabetes. In addition, our findings based on a Japanese ICU were consistent with the previous study that included obese patients (median body weight 106 kg) and patients with higher glucose levels (median blood glucose 235.8 mg/dL), 13 suggesting that FGM can be implemented in different patient populations.
FGM was more likely to give modest lower glucose levels than the blood gas test. This suggests that glycemic control using FGM can lead to prolonged hyperglycemia, but avoids hypoglycemia. Although avoiding hypoglycemia is preferrable, the MARD was high in the lower reference glucose values; therefore, hypoglycemia should be evaluated using blood gas test or other tools. The reasons why blood glucose levels with FGM are estimated to be low are multifactorial. One of the important mechanisms is that glucose transfer from intravascular areas to the interstitium and glucose consumption by interstitial cells result in physiological lower glucose levels measured by FGM than actual blood glucose levels.23,24
The clinical accuracy of FGM was consistent during the 14 days of use. To our knowledge, there is no study on the durability of FGM in ICUs. A previous study of outpatients with diabetes reported no change in the consistency between the glucose level measured by FGM and the reference glucose level each day after sensor fitting over 14 days. 16 Although there was a gradual decline in the percentage of zone A alone in the CEG analysis after day 10, the clinically acceptable accuracy of FGM remained 14 days in critically ill patients because the percentage of zone A or B in the CEG analysis was higher than 99% throughout most of the 14 days. Although our study should facilitate the use of FGM for glucose management in the ICU, further studies are needed to evaluate the accuracy of another new FGM device re-fitted after day 14 in patients who have been in the ICU for more than 14 days.
The current study demonstrated the potential ability of FGM for optimal glycemic control in critically ill patients. The target blood glucose range has been conventionally assessed based on evaluating the mortality rate of patients managed in each target range. However, the direct comparison of mortality rate across target ranges requires caution because blood glucose levels were not well managed within the target range in multiple studies. Indeed, in previous studies of glycemic control, the mean time in the targeted blood glucose range for each group was as low as 30-40%. 4 As such, increasing the frequency of blood glucose monitoring increases the TIR because it increases the opportunity to adjust blood glucose levels. 9 From this perspective, FGM should be useful in managing blood glucose in critically ill patients.
Potential Limitations
This study has several potential limitations. First, the number of paired samples differed from patient to patient. Thus, there may have been sampling bias due to the multiple samples from a patient. Second, we did not compare FGM with the blood glucose measurements in a central laboratory. We used the values measured by the blood gas analyzer as a reference for blood glucose because the results were available within a few minutes in the ICU. However, the blood gas analyzer is the most reliable of all methods that give immediate results in the ICU. Lastly, as we excluded patients expected to be discharged early from the ICU or with no need for glycemic control with insulin infusion, the results may not generalizable to all ICU patients, but the accuracy of FGM may be not affected by patients with mild disease or no difficulty in glycemic control.
Conclusions
In critically ill patients, FGM had comparable reliability and acceptable accuracy to arterial blood gas analysis irrespective of the diabetic status. In addition, the accuracy of the FGM lasted for at least 14 days. Our study suggests FGM may be useful for optimal glycemic monitoring in critically ill patients.
Supplemental Material
sj-pdf-1-dst-10.1177_19322968211017203 – Supplemental material for Accuracy and Stability of a Subcutaneous Flash Glucose Monitoring System in Critically Ill Patients
Supplemental material, sj-pdf-1-dst-10.1177_19322968211017203 for Accuracy and Stability of a Subcutaneous Flash Glucose Monitoring System in Critically Ill Patients by Hiromu Naraba, Tadahiro Goto, Mitsuhiro Tokuda, Tomohiro Sonoo, Hidehiko Nakano, Yuji Takahashi, Hideki Hashimoto and Kensuke Nakamura in Journal of Diabetes Science and Technology
Supplemental Material
sj-pdf-2-dst-10.1177_19322968211017203 – Supplemental material for Accuracy and Stability of a Subcutaneous Flash Glucose Monitoring System in Critically Ill Patients
Supplemental material, sj-pdf-2-dst-10.1177_19322968211017203 for Accuracy and Stability of a Subcutaneous Flash Glucose Monitoring System in Critically Ill Patients by Hiromu Naraba, Tadahiro Goto, Mitsuhiro Tokuda, Tomohiro Sonoo, Hidehiko Nakano, Yuji Takahashi, Hideki Hashimoto and Kensuke Nakamura in Journal of Diabetes Science and Technology
Supplemental Material
sj-pdf-3-dst-10.1177_19322968211017203 – Supplemental material for Accuracy and Stability of a Subcutaneous Flash Glucose Monitoring System in Critically Ill Patients
Supplemental material, sj-pdf-3-dst-10.1177_19322968211017203 for Accuracy and Stability of a Subcutaneous Flash Glucose Monitoring System in Critically Ill Patients by Hiromu Naraba, Tadahiro Goto, Mitsuhiro Tokuda, Tomohiro Sonoo, Hidehiko Nakano, Yuji Takahashi, Hideki Hashimoto and Kensuke Nakamura in Journal of Diabetes Science and Technology
Footnotes
Abbreviations
APACHE, acute physiology and chronic health evaluation; BMI, Bbody mass index; CEG, consensus error grid; CI, confidence interval; FGM, flash glucose monitoring; HbA1c, glycosylated hemoglobin; ICU, intensive care unit; IQR, interquartile range; MARD, mean absolute relative difference; SD, standard deviation; SEG, surveillance error grid; SOFA, sequential organ failure assessment.
Declaration of Conflicting Interests
The author(s) declared no potential conflicts of interest with respect to the research, authorship, and/or publication of this article.
Funding
The author(s) received no financial support for the research, authorship, and/or publication of this article.
Supplemental Material
Supplemental material for this article is available online.
References
Supplementary Material
Please find the following supplemental material available below.
For Open Access articles published under a Creative Commons License, all supplemental material carries the same license as the article it is associated with.
For non-Open Access articles published, all supplemental material carries a non-exclusive license, and permission requests for re-use of supplemental material or any part of supplemental material shall be sent directly to the copyright owner as specified in the copyright notice associated with the article.