
Abstract
Background and Objective:
Delayed gastric emptying is a substantial challenge for people with diabetes, affecting quality of life and blood glucose regulation. The complication is underdiagnosed, and current diagnostic tests are expensive or time consuming or have modest accuracy. The assessment of glycemic variations has potential use in gastroparesis screening. The aim of this study was to investigate the differences in glycemic variability between type 1 diabetes patients with gastroparesis and without a diagnosis of gastroparesis and the potential for using a classification model to differentiate between groups.
Methods:
Continuous glucose monitoring (CGM) from 425 patients with diabetes was included in the analytic cohort, including 16 patients with a diagnosis of gastroparesis and 409 without a known gastroparesis diagnosis. Sixteen features (9 daytime features and 7 nighttime features) describing glucose dynamics were extracted to assess differences between patients with and without a diagnosis of gastroparesis. A logistic regression model was trained using forward selection and cross-validation.
Results:
In total, 3 features were included in the model utilizing forward selection of features and cross-validation: mean absolute glucose (MAG), span, and standard deviation during the night. The Receiver operating characteristic (ROC) AUC for the classification model was 0.76.
Conclusions:
Gastroparesis seems to have an impact on glucose variability, especially during the night. Moreover, CGM could possibly be used as a part of the screening process for delayed gastric emptying, but more studies are needed to determine a realistic accuracy.
Introduction
The association between delayed gastric emptying and diabetes was initially described over 75 years ago. 1 Gastroparesis is characterized by delayed gastric emptying in the absence of mechanical obstruction of the stomach. The fundamental symptoms of gastroparesis comprise postprandial fullness, nausea, vomiting, and bloating. 2 Although diabetic gastroparesis has not been linked directly with increased mortality, 3 gastroparesis is a complication of diabetes that has a major impact on quality of life and can impair glycemic control.2-5 The pathophysiology of gastroparesis is complex and multifactorial but involves a connection to neuropathy, as it affects the vagus nerve, and is also associated with increased HbA1c, hormonal changes and acute hyperglycemia, which also contribute to motor dysfunction.5,6
The prevalence of gastroparesis is not clear, but studies have reported that up to 50% of people with diabetes have delayed gastric emptying. 4 However, a population-based study published in 2020 reported a much lower prevalence of gastroparesis in patients with type 1 and type 2 diabetes, with 4.6% and 1.3%, respectively. 7 The confirmation of gastroparesis with diagnostic tests is low, which indicates a potential underdiagnosis of gastroparesis as a complication of diabetes. Diagnosing gastroparesis in patients with diabetes is key to initiating treatment and to better facilitating research in this field. Current diagnostic tests are expensive and time consuming or have modest accuracy. 2 Scintigraphy with 15-minute scanning intervals for 4 hours post-food intake is considered the “gold standard” test. In practice, a simplified approach involving hourly scans is often used. 8 Compared to the “gold standard,” this approach has a sensitivity and specificity of 93% and 62%, respectively. 9 There is a need for new screening approaches that are inexpensive and easy to conduct.
Continuous glucose monitoring (CGM) has advanced as an important part of type 1 diabetes management. 10 Over the years, few studies have investigated CGM as a potential, simple method to diagnose people with gastroparesis. The approach involves administering a test meal to the subjects and subsequently analyzing the postprandial patterns.1,11 Although changes in glucose levels between patients with and without gastroparesis have been reported, the association has not been strong enough for the direct use of CGM in a diagnostic setting. However, research in this field is sparse, and it is evident that delayed gastric emptying could have a substantial impact on glucose variability, especially in insulin-treated people with diabetes.
Our hypothesis is that CGM during daily living could be used to obtain valuable information about gastric emptying. We know from earlier studies that the patterns from physiological signals are often influenced by multiple factors, which makes it difficult to identify differences by eye.12-14 Machine learning has the potential to systematically assess these patterns and could be used for the classification of different physiological conditions.15-17 Therefore, the aim of this study was to investigate the difference in glycemic variability between type 1 diabetes patients with and without a diagnosis of gastroparesis and the potential for using a classification model to differentiate between subject groups.
Methods and Materials
This study adhered to the recommended standards described by the “Transparent Reporting of a Multivariable Prediction Model for Individual Prognosis or Diagnosis” (TRIPOD). 18
Data Sources
The cohort for this study was combined from 2 studies on type 1 diabetes patients who participated in the REPLACE-BG trial and the T1D Exchange Severe Hypoglycemia in Older Adults with Type 1 Diabetes Study. The results were initially published by Aleppo et al. and Weinstock et al., respectively.10,19
For the REPLACE-BG trial, the study design was a parallel group, multicenter randomized clinical trial. The objective of the study was to assess whether the routine use of CGM without blood glucose validation could be safe and effective. The inclusion/exclusion criteria for the study were adults with type 1 diabetes who were using an insulin pump, patients with an HbA1c level <8.5% and without hypoglycemia unawareness and a history of severe hypoglycemia. A total of 225 patients with type 1 diabetes were enrolled and equipped with a Dexcom G4 CGM for up to 6 months. The average wear time of CGM were 6.7 (0.5) and 6.8 (0.4) days/week in the CGM-only and CGM+BGM groups. The participants had a mean age of 44 years (±14), a duration of diabetes of 23 years (±12), and a BMI of 27.7 (±4.1).
The T1D Exchange Severe Hypoglycemia in Older Adults with Type 1 Diabetes Study had a 14-day case-control design and included 201 type 1 diabetes patients with and without a history of severe hypoglycemia. The participants were monitored with a Dexcom Seven Plus CGM. The cohort had a mean age of 68.6 years (±6.4), a duration of diabetes of 40.5 years (±11.6), and a BMI of 26.9 (±5.0).
In the present study, we used the CGM data from all enrolled patients to extract glycemic variability patterns. Patients were included if they had at least 2 days of full CGM. Records on the diagnosis of gastroparesis were obtained from the study questionnaire on diagnoses and complications.
Outcome
To investigate whether glycemic patterns in a heterogeneous group of type 1 diabetes patients could be an alternative route to the diagnosis of gastroparesis, the primary outcome was the binary classification of patients as either with or without a diagnosis of gastroparesis based on the features extracted from the patients’ CGM during the time they were enrolled in the trials. The secondary outcome was to assess the discriminatory ability of the separate features.
Feature Extraction
Features were extracted from the CGM as potential predictors of gastroparesis. Several features, previously described in the literature, for quantifying glycemic variability were calculated for each whole day (24 h) of CGM and each night (6 h) separately. We did not have data on bedtime, so the night calculations were performed on the data obtained between 12 a.m. to 6 a.m. The nature of blood glucose is subject to a relatively large intrasubject variability between days, and the focus of this study was to investigate the intersubject variability; therefore, for each subject, each feature type was calculated as the average of the given type over several days of CGM to produce more robust features for intersubject classification. The following describes the calculations used to extract features from the CGM.
Mean, standard deviation, max, min, and difference
The means, standard deviations, maximum, minimum and difference between maximum and minimum values were calculated for the whole day and night periods.
Mean absolute glucose
The mean absolute glucose (MAG)
20
is the average measurement-to-measurement fluctuation in glucose.

Mean amplitude of glycemic excursions
The mean amplitude of glycemic excursions (MAGE)
21
is calculated as the mean height of glucose excursion (greater than one standard deviation).

Continuous overlapping net glycemic action
Continuous overlapping net glycemic action (CONGA)
22
is calculated by determining the difference between values at different intervals (typically 1 hour apart, CONGA1).

Glycemic Risk Assessment in Diabetes Equation
The Glycemic Risk Assessment in Diabetes Equation (GRADE)
23
summarizes the degree of risk associated with a glucose profile, where

Classification Approach
To classify patients into 2 classes (nongastroparesis and gastroparesis), we used a logistic regression model. Potential predictive features were included in the model using a forward selection approach with leave-one-out cross-validation, such that samples from the same subject were not used for both validation and training of the algorithm at the same time. This method minimizes overfitting and ensures a more accurate estimate of the generalizability of the algorithm to an independent data set.
All data processing was performed using custom analysis software developed in MATLAB® R2020b (MathWorks, Natick, MA, USA).
Statistical Assessment
To assess the classification model performance, the ROC area under the curve (AUC) was used to evaluate the model. Sensitivity and specificity are 2 components that measure the inherent validity of a diagnostic test for dichotomous outcomes such as in our study. ROC is the plot that depicts the trade-off between the sensitivity and (1-specificity). AUC is an effective method for assessing the general performance of a diagnostic test. 24 We used classical statistics to test differences in single features between the 2 classes. Statistical comparisons were considered significant when the P value was <.05/n (Bonferroni corrected).
Results
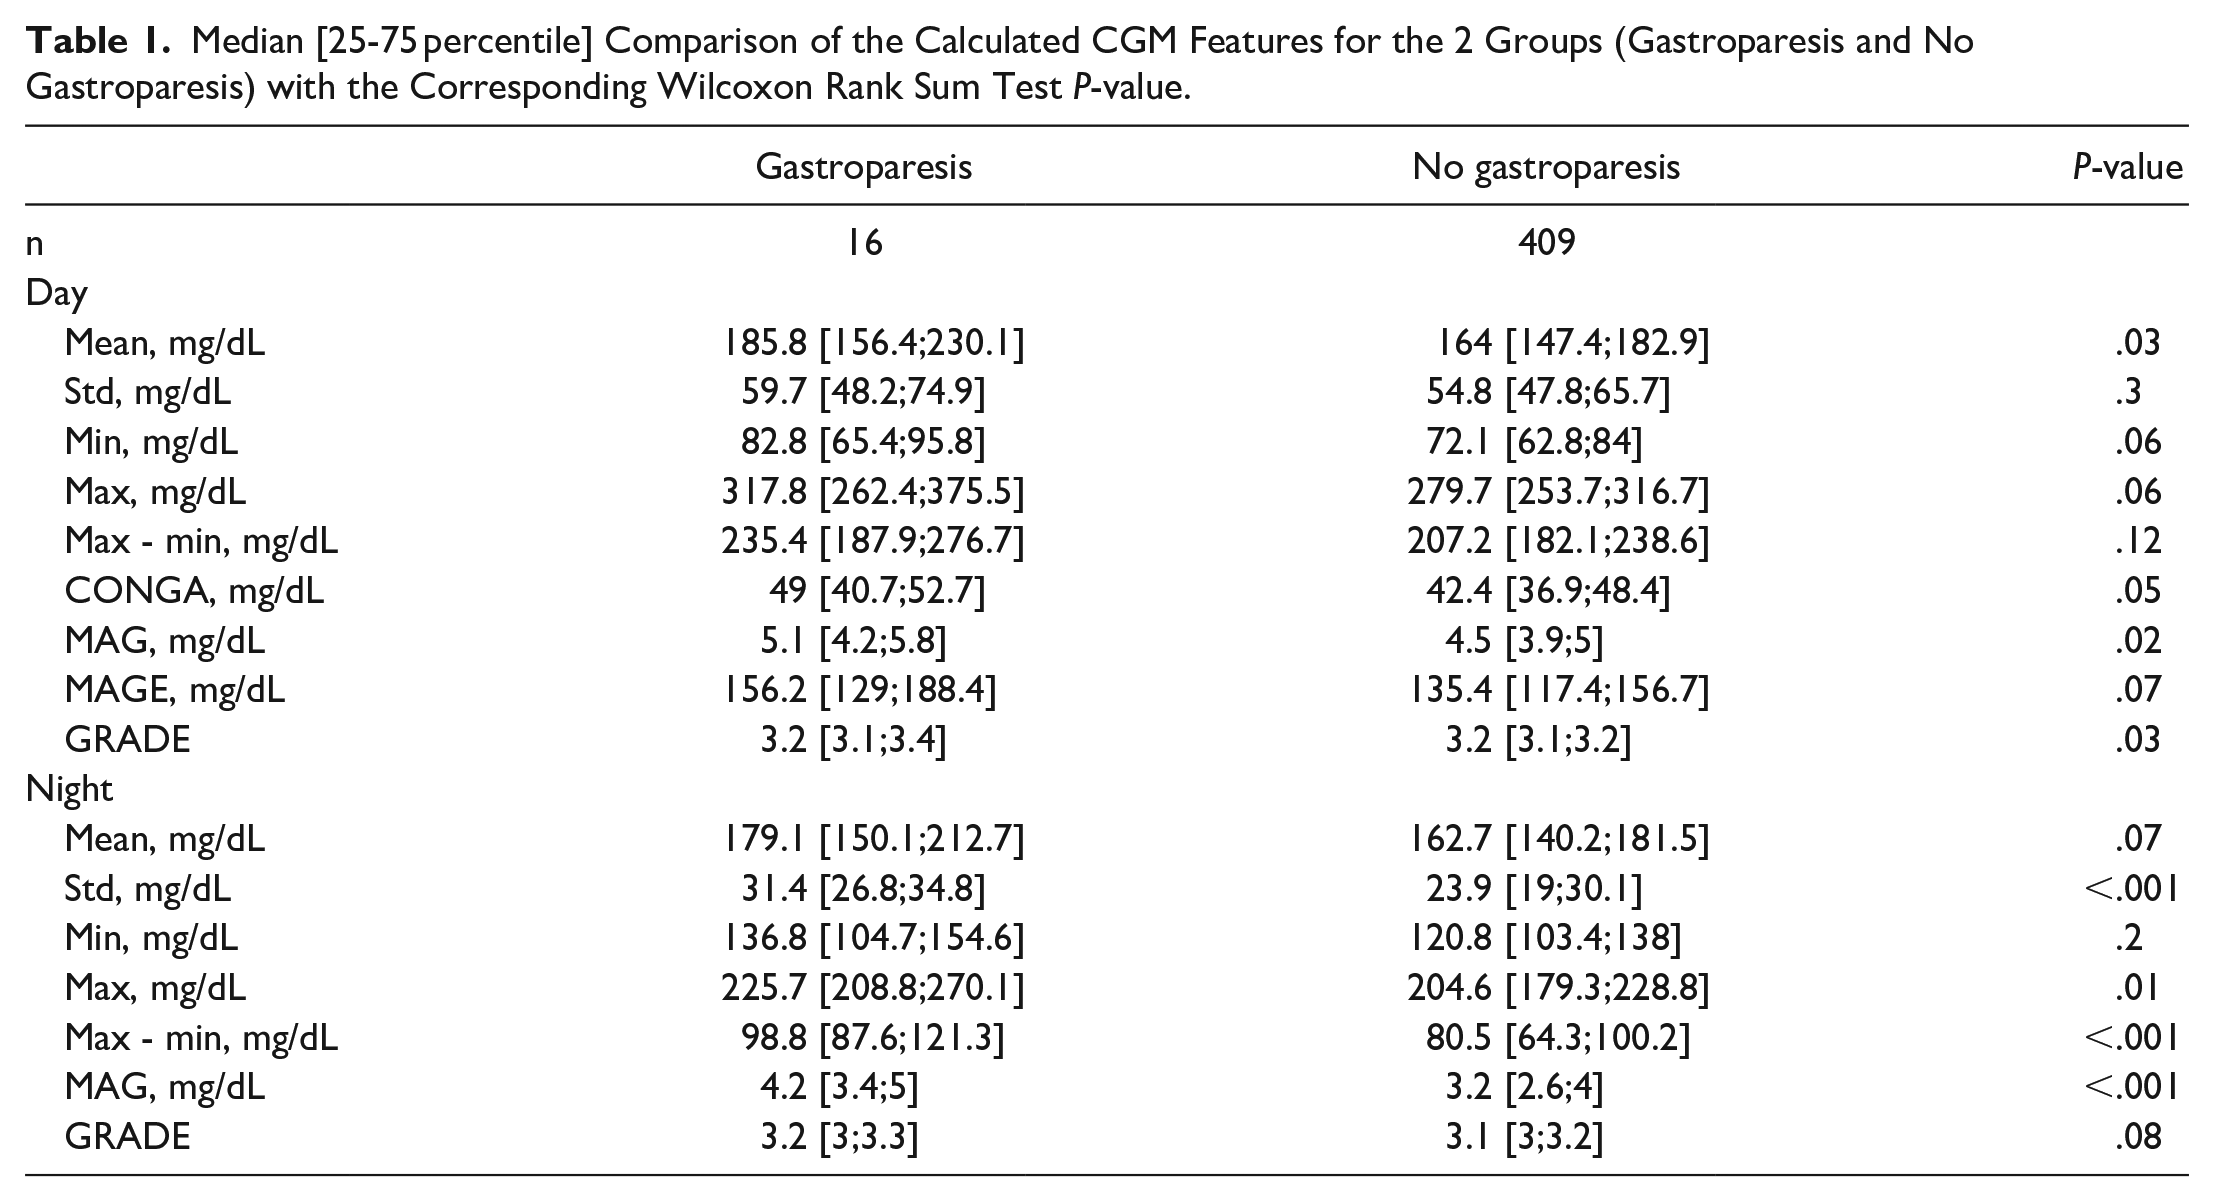
A total of 425 patients with diabetes were included in the analytic cohort, including 16 with diagnosed gastroparesis and 409 without a diagnosis of gastroparesis. Nine whole-day features and 7 night features were extracted from the CGM profiles for each patient. As described in the data source section, the cohort was a heterogeneous mix of patients spanning from young to old and from good to poor glycemic control with hypoglycemic unawareness. A comparison of the extracted features from each group is presented in Table 1. The overall median value of the whole-day features for the group with gastroparesis was higher than that for the group without a diagnosis of gastroparesis. However, after Bonferroni correction, these differences were not statistically significant. Assessing the extracted features obtained during the night showed the same general tendencies, but for several of the night features, these differences were statistically significant. The standard deviation (std) was higher for the gastroparesis group, with a median of 31.4 [26.8;34.8],than for the group without a diagnosis of gastroparesis, 23.9 [19;30.1] (P < .001). The difference between the highest and lowest CGM values (max-min) was higher for the gastroparesis group, with a median of 98.8 [87.6;121.3], than for the group without a diagnosis of gastroparesis 80.5 [64.3;100.2] (P < .001). Moreover, the mean absolute glucose (MAG) was also higher for the gastroparesis group, with a median of 4.2 [3.4;5], than for the group without a diagnosis of gastroparesis 3.2 [2.6;4] (P < .001). The feature plot for MAG (night)/max-min (night) is presented in Figure 1. All of these features indicate that glycemic patterns during the night, where the glucose profile is less impacted by eating patterns and physical activity, could hold information on glycemic disturbances in patients with gastroparesis.
Median [25-75 percentile] Comparison of the Calculated CGM Features for the 2 Groups (Gastroparesis and No Gastroparesis) with the Corresponding Wilcoxon Rank Sum Test P-value.
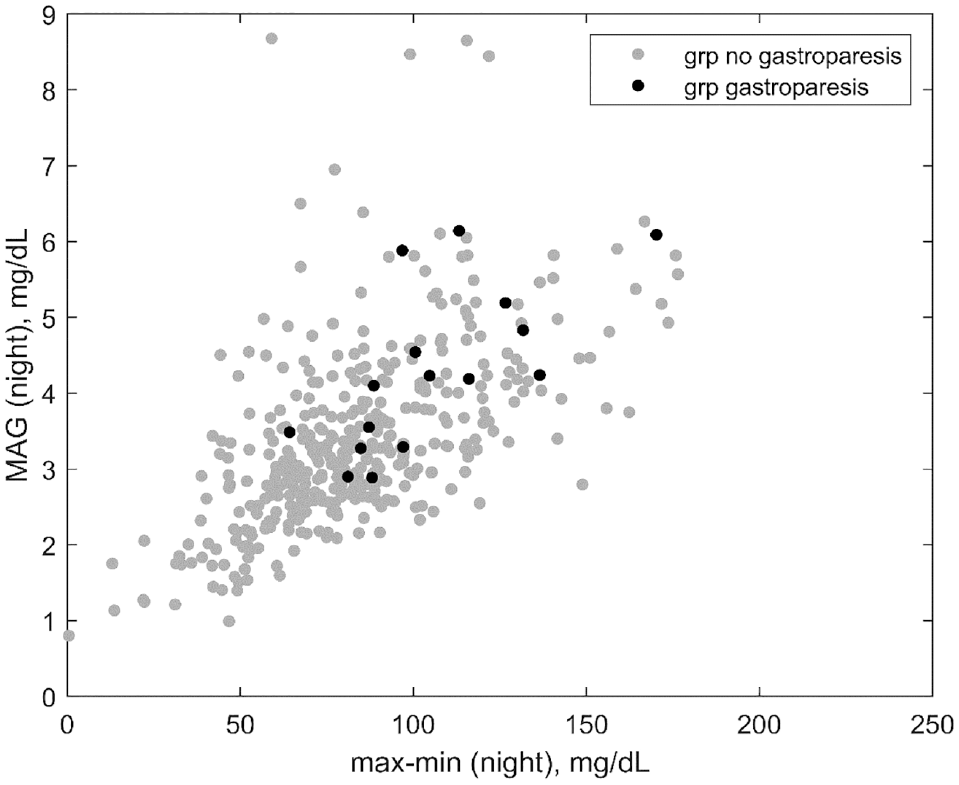
Feature plot of MAG (night) and max-min (night) values between groups with and without gastroparesis.
Classification
A logistic regression classification model was constructed to predict patients with and without a diagnosis of gastroparesis based on the features from the glycemic patterns. In total, 3 features were included in the forward selection of features using cross-validation: MAG (night), max-min (night) and std (night). The ROC AUC for the classification model was 0.76, and the ROC curve is presented in Figure 2.
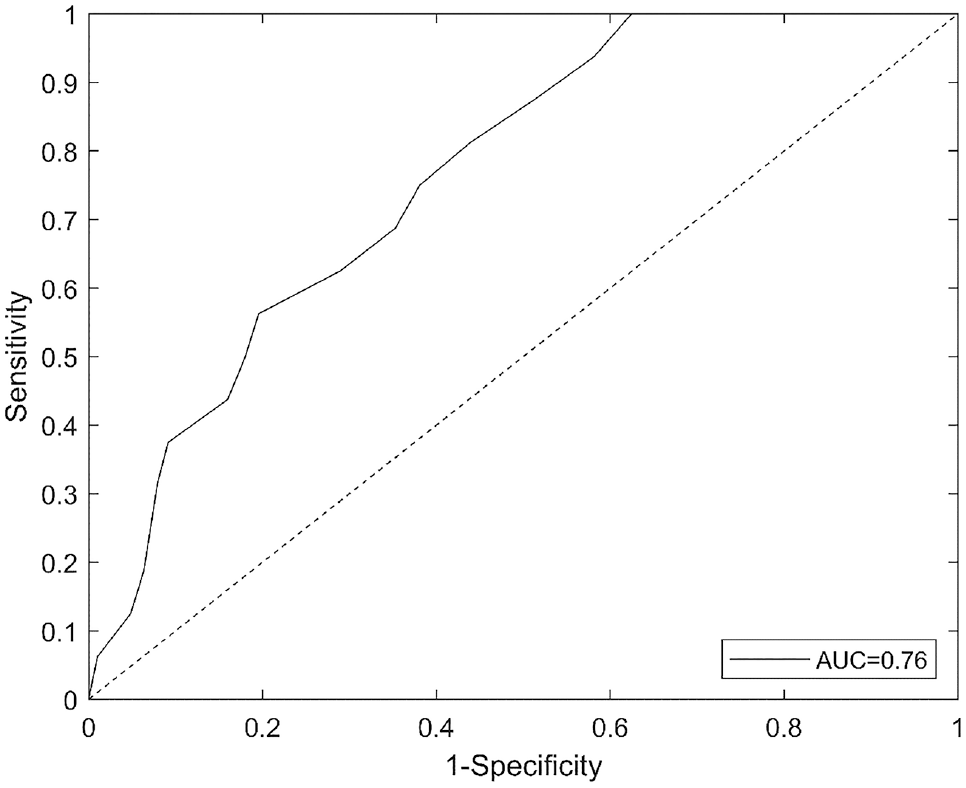
The ROC curve for the prediction model, demonstrating a cross-validated AUC of 0.76.
Discussion
In this study, we investigated the difference in glycemic patterns between patients with and without a diagnosis of gastroparesis. The results showed that especially during the night, gastroparesis could have a substantial impact on glycemic variability. Features related both to large swings in blood glucose and to small, rapid changes were affected. Although glucose control during nighttime is more pronounced than during daytime, there is no reason to believe glycemic variability is not affected during daytime as well. The explanation could simply be that glucose metabolism is more complex during daytime due to eating patterns, stress and physical activity. The results showed that the general trend of glucose patterns was more extreme during the day for the group with gastroparesis. However, the number of observed patients with gastroparesis was relatively small, and the lack of significant differences could be due to the lack of power.
Moreover, we also investigated the potential of using these features from glycemic variability to construct a proof-of-concept classification model that could be used in the screening of gastroparesis. The results showed that it is possible to distinguish between groups to a certain extent but, in our cohort, not without a relatively large overlap, which could mean a high proportion of false positives. Additionally, several factors limit our approach, which could indicate that a classification model based on CGM could perform significantly better in a more realistic setup. First, the group of patients with gastroparesis had already been diagnosed and were receiving treatment for gastroparesis, which could mean that the effect on glucose was reduced. This should be seen as counter to the setup where one would use such a classification model to screen for gastroparesis. Second, the group without a diagnosis of gastroparesis was assigned based on the absence of a diagnosis. It is likely that a proportion of patients in this group had delayed gastric emptying or even gastroparesis, which would reduce the observed differences between groups. An interesting research design for future work could be to include patients suspected of gastroparesis but without diagnosis, monitor them with CGM for several days and use Scintigraphy or alternativ 13C octanoate breath tests for diagnosing gastroparesis. This would enable us to determine a more realistic result on how CGM could be used to classify patients with gastroparesis.
Ramzan et al. 11 investigated glucose profiles from 24 patients with and without diabetic gastroparesis after a test meal. They found that compared with nongastroparetic patients with diabetes, gastroparetic patients with diabetes had a prolonged postprandial hyperglycemic profile. However, this study, to our knowledge, is the first report that differences in glucose variability can be observed from CGM obtained during free living. A few others have investigated the potential of using CGM in assessing diabetic gastroparesis; 25 however, this is an underexposed field of research, and there is a need for more knowledge on the relationship between gastroparesis and the effect on glucose variability.
Findings from this study have several clinical implications. High glycemic variability could be associated with a higher incidence of gastroparesis; therefore, assessing glycemic variability patterns from CGM could in some cases lead the clinician to initiate assessment of the patient’s gastric symptoms. In patients with poor glycemic control, clinicians could suspect that delayed gastric emptying could have an impact that adds to the complexity and potential needs to be targeted. However, little is known about how delayed gastric emptying impacts glycemic control during free living, and more studies are needed.
Conclusion
Gastroparesis seems to have an impact on glucose variability during the night. Moreover, CGM could potentially be used as a part of the screening process for delayed gastric emptying, but more studies are needed to determine a realistic accuracy.
Supplemental Material
sj-pdf-1-dst-10.1177_19322968211015206 – Supplemental material for Classification of Gastroparesis from Glycemic Variability in Type 1 Diabetes: A Proof-of-Concept Study
Supplemental material, sj-pdf-1-dst-10.1177_19322968211015206 for Classification of Gastroparesis from Glycemic Variability in Type 1 Diabetes: A Proof-of-Concept Study by Simon Lebech Cichosz and Ole Hejlesen in Journal of Diabetes Science and Technology
Footnotes
Acknowledgements
N/A
Abbreviations
AUC, area under the curve; BMI, body mass index; CGM, continuous glucose monitoring; CONGA, Continuous overlapping net glycemic action; GRADE, glycemic risk assessment in diabetes equation; MAG, mean absolute glucose; MAGE, mean amplitude of glycemic excursions; ROC, Receiver operating characteristic; T1D, type 1 diabetes; TRIPOD, transparent reporting of a multivariable prediction model for individual prognosis or diagnosis.
Declaration of Conflicting Interests
The author(s) declared no potential conflicts of interest with respect to the research, authorship, and/or publication of this article.
Funding
The author(s) received no financial support for the research, authorship, and/or publication of this article.
Disclaimer
The source of the data is the T1D Exchange, but the analyses, content and conclusions presented herein are solely the responsibility of the authors and have not been reviewed or approved by the T1D Exchange.
Supplemental Material
Supplemental material for this article is available online.
References
Supplementary Material
Please find the following supplemental material available below.
For Open Access articles published under a Creative Commons License, all supplemental material carries the same license as the article it is associated with.
For non-Open Access articles published, all supplemental material carries a non-exclusive license, and permission requests for re-use of supplemental material or any part of supplemental material shall be sent directly to the copyright owner as specified in the copyright notice associated with the article.