
Abstract
Background
Skin intrinsic fluorescent (SIF) scores are indirect measures of advanced glycation end-products (AGEs). SIF scores are cross-sectionally associated with type 1 diabetes (T1D) complications such as increased albumin excretion rate (AER), coronary artery calcification (CAC) and neuropathy. We assessed predictors of SIF score change in those with T1D.
Methods
Data from the 30-year longitudinal Epidemiology of Diabetes Complications (EDC) study of childhood-onset T1D were used to assess AGEs measured with a SIF score produced by the SCOUT DS® device. SIF scores were assessed twice in 83 participants: between 2007-08 and again between 2010-14. Regression analyses were used to assess independent predictors of SIF score change
Results
At baseline, mean age was 47.9 ± 6.9 years, diabetes duration was 36.7 ± 6.4 years, and median glycosylated hemoglobin (HbA1c) was 7.1 (interquartile range: 6.5, 8.5). During a mean follow-up of 5.2 ± 0.9 years, mean change in SIF score was 2.9 ± 2.8 arbitrary units. In multivariable linear regression models, log HbA1c (P < 0.001), log estimated glomerular filtration rate (eGFR) (P < 0.001), overt nephropathy (defined as AER ≥ 200 µg/min, P = 0.06), and multiple daily insulin shots/pump use (MDI) exposure years (P = 0.02) were independent predictors of SIF score change.
Conclusions
Increases in SIF score over 5 years were related to increased glycemic levels and decreased kidney function (eGFR). MDI and glomerular damage were related to a decreased SIF score. This is one of the first studies with repeated SIF assessments in T1D and provides unique, albeit preliminary, insight about these associations.
Keywords
Introduction
Type 1 diabetes (T1D) prevalence is increasing in the United States, affecting more children and adults each year.1-3 Today, patients are thought to be living longer due to improved treatment and management. 4 With this increased life expectancy, however, comes the added burden of addressing chronic complications.
Emerging evidence suggests that advanced glycation end-products (AGEs) may contribute to some of these chronic complications in diabetes.5-8 AGEs are a heterogeneous group of compounds which accumulate in plasma and tissues. 9 They are formed as a result of non-enzymatic reactions between reducing sugars and proteins, lipids, or nucleic acids. 10 Although the chemical nature of AGEs has not been fully defined, they are known to be products of glycol-oxidation in ageing and normal metabolic processes. 9 Despite being an essential part of normal physiology, an increased production and accumulation of AGEs may promote cellular damage. 9
There is preliminary evidence from cross-sectional studies of an association between HbA1c and collagen-linked fluorescent AGEs in T1D.11-13 This evidence suggests that increased skin intrinsic fluorescence (SIF) scores are associated with increased albumin excretion rate (AER) (>30 mg/24 hr), 11 coronary artery calcification (CAC),5,11 distal symmetrical polyneuropathy, and autonomic neuropathy. 6 However, because these data were only evaluated at one time point, it is difficult to infer temporal associations.
Historically, accurate and reliable ways to measure type and amount of AGEs included blood and urine samples, and skin biopsies. Collagen-linked fluorescent AGEs can be assessed with non-invasive light technology 14 using the SCOUT DS® device that produces a SIF score.15,16 The Epidemiology of Diabetes Complications (EDC) study collected SIF scores in a sub-set of participants at 2 follow up time points. Using these data, our work seeks to identify independent predictors of longitudinal SIF score change. We hypothesize that risk characteristics related to disordered glucose metabolism (eg, blood glucose control), AGE clearance, and overall cellular damage and inflammation (eg, AER and white blood cell count) would predict SIF score increases.
Methods
Participants were recruited from the EDC cohort study, a longitudinal study comprised of individuals diagnosed with childhood-onset (aged <17 years old) T1D at the Children’s Hospital of Pittsburgh between 1950 and 1980.17,18 The purpose of the EDC study is to identify characteristics associated with T1D complications. Since the EDC baseline examination (1986-1988), participants have been followed prospectively for 30 years, biennially providing medical history, lifestyle, demographic and diabetes self-care survey information. Study participants also attended clinical examinations biennially up to 10 years and again at 18 years and 25 years. All participants provided written informed consent prior to any study procedures. The SCOUT DS ® device (RISE Life Science, Corp.) was administered to a convenience sample of EDC participants between 2007-08 and again as part of the 2010-2014 follow-up exam to identify presence of collagen-linked AGE. Risk characteristics were selected from the 2004-06 EDC exam and the 2010-14 EDC exam. We will refer to the 2004-08 time-frame as ‘analytic baseline’ and the 2010-2014 exam as ‘follow up’. All procedures for the EDC and the SIF sub-study were approved by the Institutional Review Board at the University of Pittsburgh.
Race/ethnicity, gender, smoking status, daily number of alcoholic drinks consumed, medication use, insulin units/day, and pump use were self-reported. Height was measured using a stadiometer and weight using a balance beam scale. Body mass index (BMI) was calculated as weight in kilograms divided by the square of height in meters. Waist to hip ratio was calculated by dividing waist by hip circumference. Multiple daily insulin shots/pump use (MDI) was defined as either use of an insulin pump or at least 3 insulin shots a day. The insulin units per kg of weight were calculated.
Systolic (SBP) and diastolic (DBP) blood pressure were measured three times and the average of the second and third measures were used in analysis. Hypertension (HTN) was defined as blood pressure >140/90 mmHg or use of anti-hypertensive medications. Blood samples were assayed for lipids, lipoproteins, HbA1c, and creatinine. Stable glycosylated hemoglobin (HbA1) was measured with ion exchange chromatography (Isolab, Akron, OH) for the first 18 months 19 and with automated high-performance liquid chromatography (Diamat, BioRad, Hercules, CA) for the next 10 years. Extensive duplicate samples were run using both techniques, and no systematic differences were seen (r2 = 0.95; Diamat [HbA1] = −0.018 + 1.00 Isolab [HbA1). 20 After 10 years, HbA1c was measured with the DCA 2000 analyzer (Bayer, Tarrytown, NY). All HbA1 and HbA1c values were converted to Diabetes Control and Complications Trial/Epidemiology of Diabetes Interventions and Complications (DCCT/EDIC) aligned HbA1c values by using a regression formula derived from duplicate analyses. 20 Total cholesterol was measured enzymatically21,22 and low-density lipoprotein (LDL) was calculated using the Friedewald equation. 23 High density lipoprotein (HDL) cholesterol was determined by a heparin and manganese procedure 24 evaluated from fasting blood samples. Non-HDL cholesterol was calculated as the difference between total cholesterol and HDL. White blood cell count was obtained using a Coulter counter.
Albumin (measured by immunonephelometry) 26 and creatinine (measured with an Ectachem 400 Analyzer) assessed in three timed urine samples (24 h, overnight, and 4-h clinic) were used to calculate AER and albumin-creatinine (A/C) ratios. Overt nephropathy (ON) was defined as AER ≥ 200 µg/min in at least two of three specimens. In the 10% of urine collections deemed inadequate based on creatinine excretion, and during the 2010-14 follow-up exam where AER was not assessed, an albumin to creatinine ratio (DCA Vantage System) >0.3 mg/mg was used to define ON. 26 The Chronic Kidney Disease Epidemiology Collaboration equation was used to calculate estimated glomerular filtration rate (eGFR). 25 Impaired eGFR was defined as eGFR less than or equal to 60 mL/min/1.73m2. Glucose disposal rate was estimated (eGDR) via an equation previously derived from hyperinsulinemic-euglycemic clamp studies of 24 study participants chosen to represent the full spectrum of insulin resistance. 27
To assess SIF, participants placed their forearm on the SCOUT DS® device and light was shone on the volar side of the forearm. Skin fluorescence was excited with a light emitting diode (LED) centered at 375nm (LED1) and detected at 435-655 nm using the 0.5 mm source/detector spacing of the channel 2 optical probe (see supplemental information). Skin reflectance was measured with excitation LED and broadband LED. These values were used in an intrinsic correction equation (to compensate for distortion of raw fluorescence by skin absorption and scattering) where F is fluorescence and λ is the emission wavelength:

Fλ was divided by reflectance values at the excitation and emission wavelengths, Rx and Rm (λ). The reflectance values were then adjusted by the dimensionless exponents, kx and km where kx = 0.6 and km = 0.2. The resulting intrinsic fluorescence, (fλ), was integrated over the 441 to 496nm spectral region to produce an overall SIF score in arbitrary units (AU). Participants were excluded for arm tattoos, wounds, injuries, or rashes on the underside of the forearm. To remove skin care products, the forearm was cleaned prior to the scan.
A modified SCOUT DS ® device was used at the follow up time point. The modified SCOUT DS® device had a redesigned spectrometer to eliminate a ghost reflection and improve accuracy of the measurement for diabetes screening. The SIF scores from the modified device were converted for compatibility with the analytic baseline SIF scores (see supplemental information). 28 Collagen-linked AGE differ by gender 29 and age, 30 therefore, each SIF value was adjusted for these attributes. 29
Statistical Analysis
To assess variables related to SIF score change, analyses first focused on covariates measured at the analytic baseline. Subsequent analyses evaluated continuous variables as updated mean values from EDC study baseline (1986-1988) to the analytic baseline. Non-normally distributed continuous variables were log transformed. For categorical exposure variables the years of exposure from EDC study baseline to analytic baseline were used.
The outcome variable, change in SIF score, was calculated by subtracting analytic baseline SIF score from the individual follow up SIF score.
Descriptive characteristics of participants were assessed at EDC study entry (1986-1988), analytic baseline, and as updated means (continuous variables) or years of exposure (categorical variables). T-tests and the Wilcoxon rank sum test, as appropriate, were used to assess differences in continuous variables between increased and decreased SIF scores over time; for categorical variables, the Chi-Square or the Fisher’s exact test was used. Pearson or Spearman correlation coefficients were used to evaluate the association between participant characteristics and change in the SIF scores as a continuous variable. Linear regression models (using proc GLM in SAS) were applied to assess independent predictors of change in SIF scores.
Models were obtained in a forward fashion by sequentially considering blocks of variables that represented similar characteristics. For variables that represent the same clinical factor only one of the variables was included in analysis at a time. Blocks included variables representing demographic characteristics, diabetes control, blood pressure and lipids, and kidney disease and inflammation. Subsequently, significant variables from each block were combined into one model, also allowing for the number of visits a participant attended, the time period between SIF assessments, ACE/ARB medication use, and analytic baseline SIF score. Models were limited to observations that had no missing exam data at analytical baseline. All statistical analyses were conducted using SAS 9.4 (SAS Institute, Cary, NC).
Results
Eighty-three participants had a SIF score assessed at both the analytic baseline (n = 112) and follow up (n = 189) time points (Figure 1).
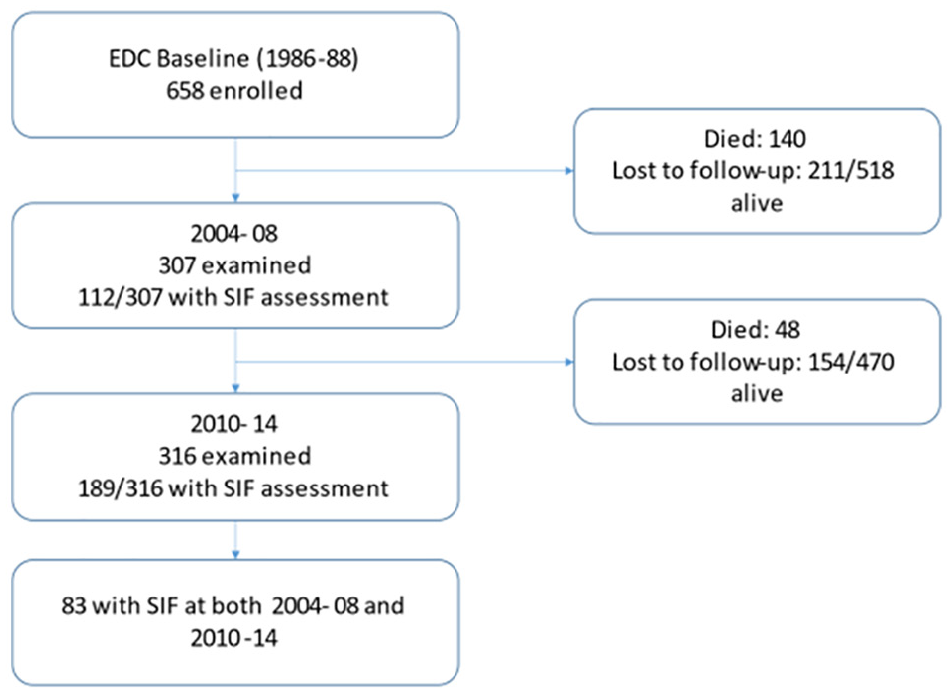
Study flow for predictors of change in SIF score in T1D in the EDC cohort study.
Characteristics at analytic baseline of the individuals who had SIF scores versus those who did not were compared (see supplemental information). Compared to those without SIF scores, those with SIF scores were older (P < 0.01), older at age of T1D onset (P < 0.01), had higher eGDR (P < 0.0), lower AER (P = 0.01), lower non-HDL cholesterol (P = 0.05), lower SBP (P < 0.01), fewer had ON (P = 0.04), and fewer ever smoked (P = 0.02); but were of similar diabetes duration (P = 0.9); HbA1c (P = 0.06); eGFR (P = 0.6); and MDI exposure years (P = 0.4).
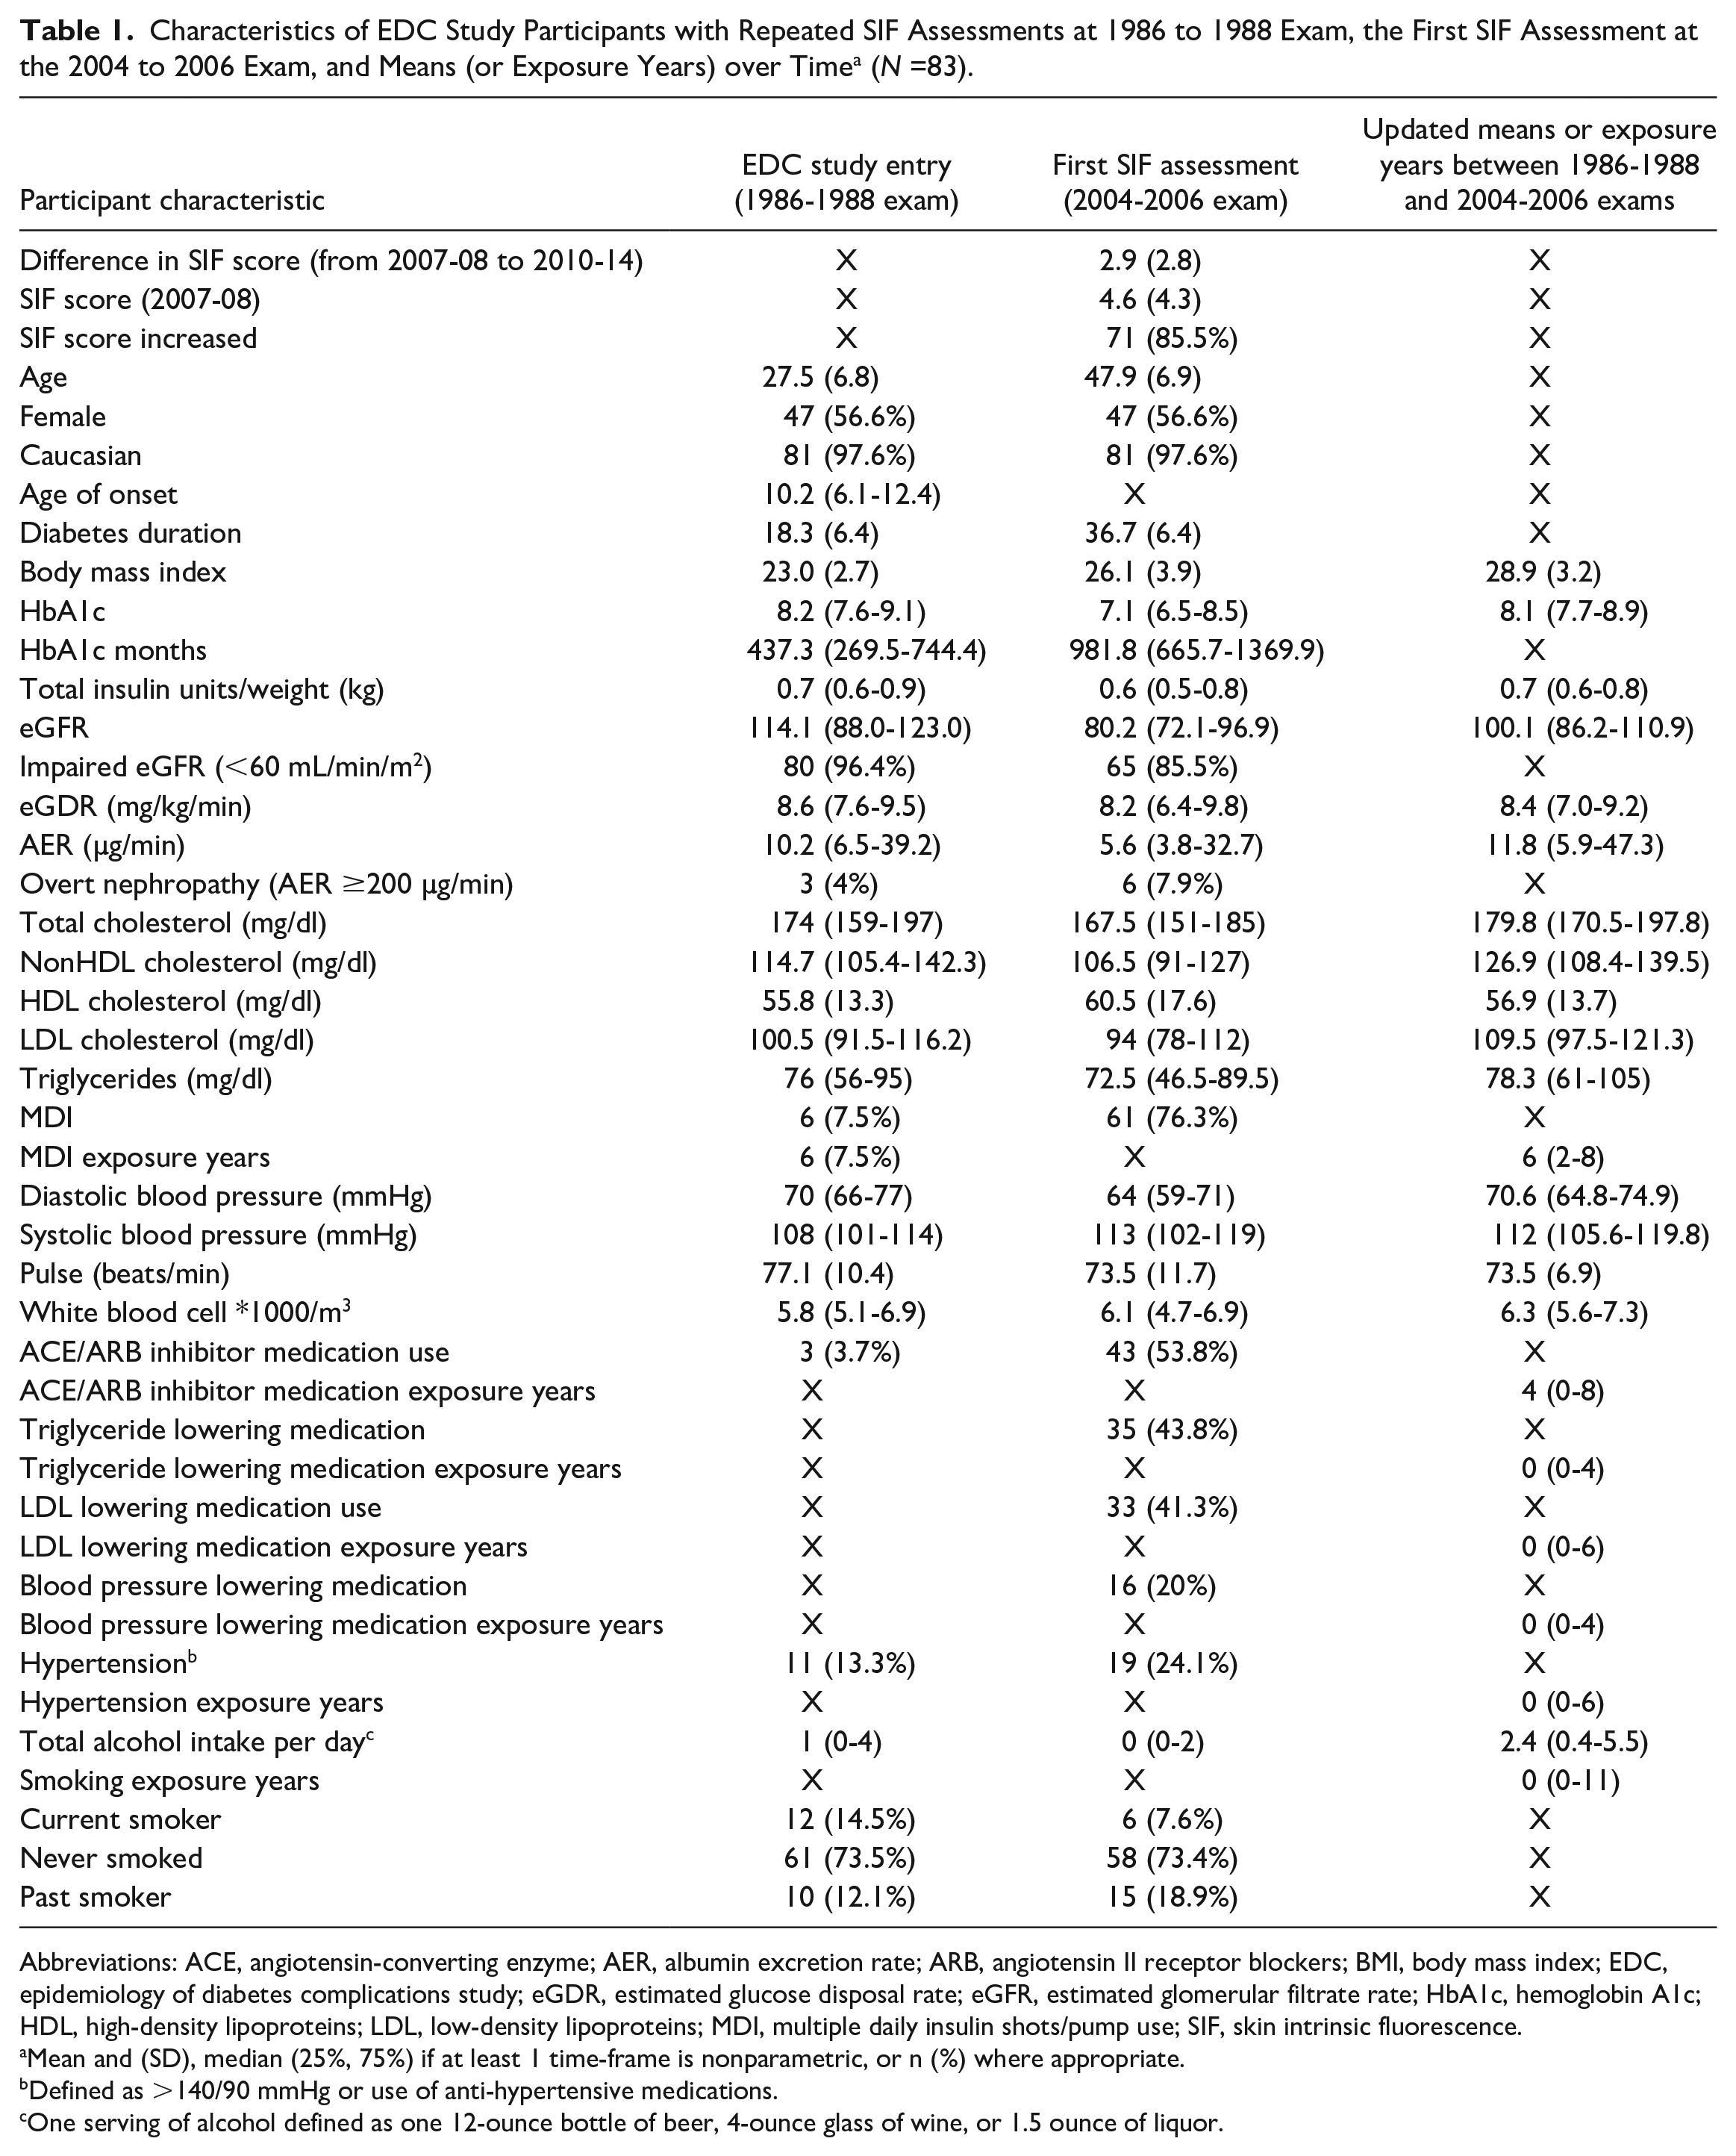
Table 1 shows the characteristics of the 83 SIF study participants from EDC study entry to the analytic baseline. At analytic baseline, participants were on average 47.9 (± 6.9) years of age, 56.6% (n = 47) were female, and the average diabetes duration was 36.7 (± 6.4) years. Most participants were Caucasian (n = 81, 97.6%). The median HbA1c was 7.1% (6.5, 8.5). The majority of participants had normal or mildly decreased kidney function (defined as eGFR<60mL/min/m2, 85.5%), and most used MDI (76.3%).
Characteristics of EDC Study Participants with Repeated SIF Assessments at 1986 to 1988 Exam, the First SIF Assessment at the 2004 to 2006 Exam, and Means (or Exposure Years) over Time a (N =83).
Abbreviations: ACE, angiotensin-converting enzyme; AER, albumin excretion rate; ARB, angiotensin II receptor blockers; BMI, body mass index; EDC, epidemiology of diabetes complications study; eGDR, estimated glucose disposal rate; eGFR, estimated glomerular filtrate rate; HbA1c, hemoglobin A1c; HDL, high-density lipoproteins; LDL, low-density lipoproteins; MDI, multiple daily insulin shots/pump use; SIF, skin intrinsic fluorescence.
Mean and (SD), median (25%, 75%) if at least 1 time-frame is nonparametric, or n (%) where appropriate.
Defined as >140/90 mmHg or use of anti-hypertensive medications.
One serving of alcohol defined as one 12-ounce bottle of beer, 4-ounce glass of wine, or 1.5 ounce of liquor.
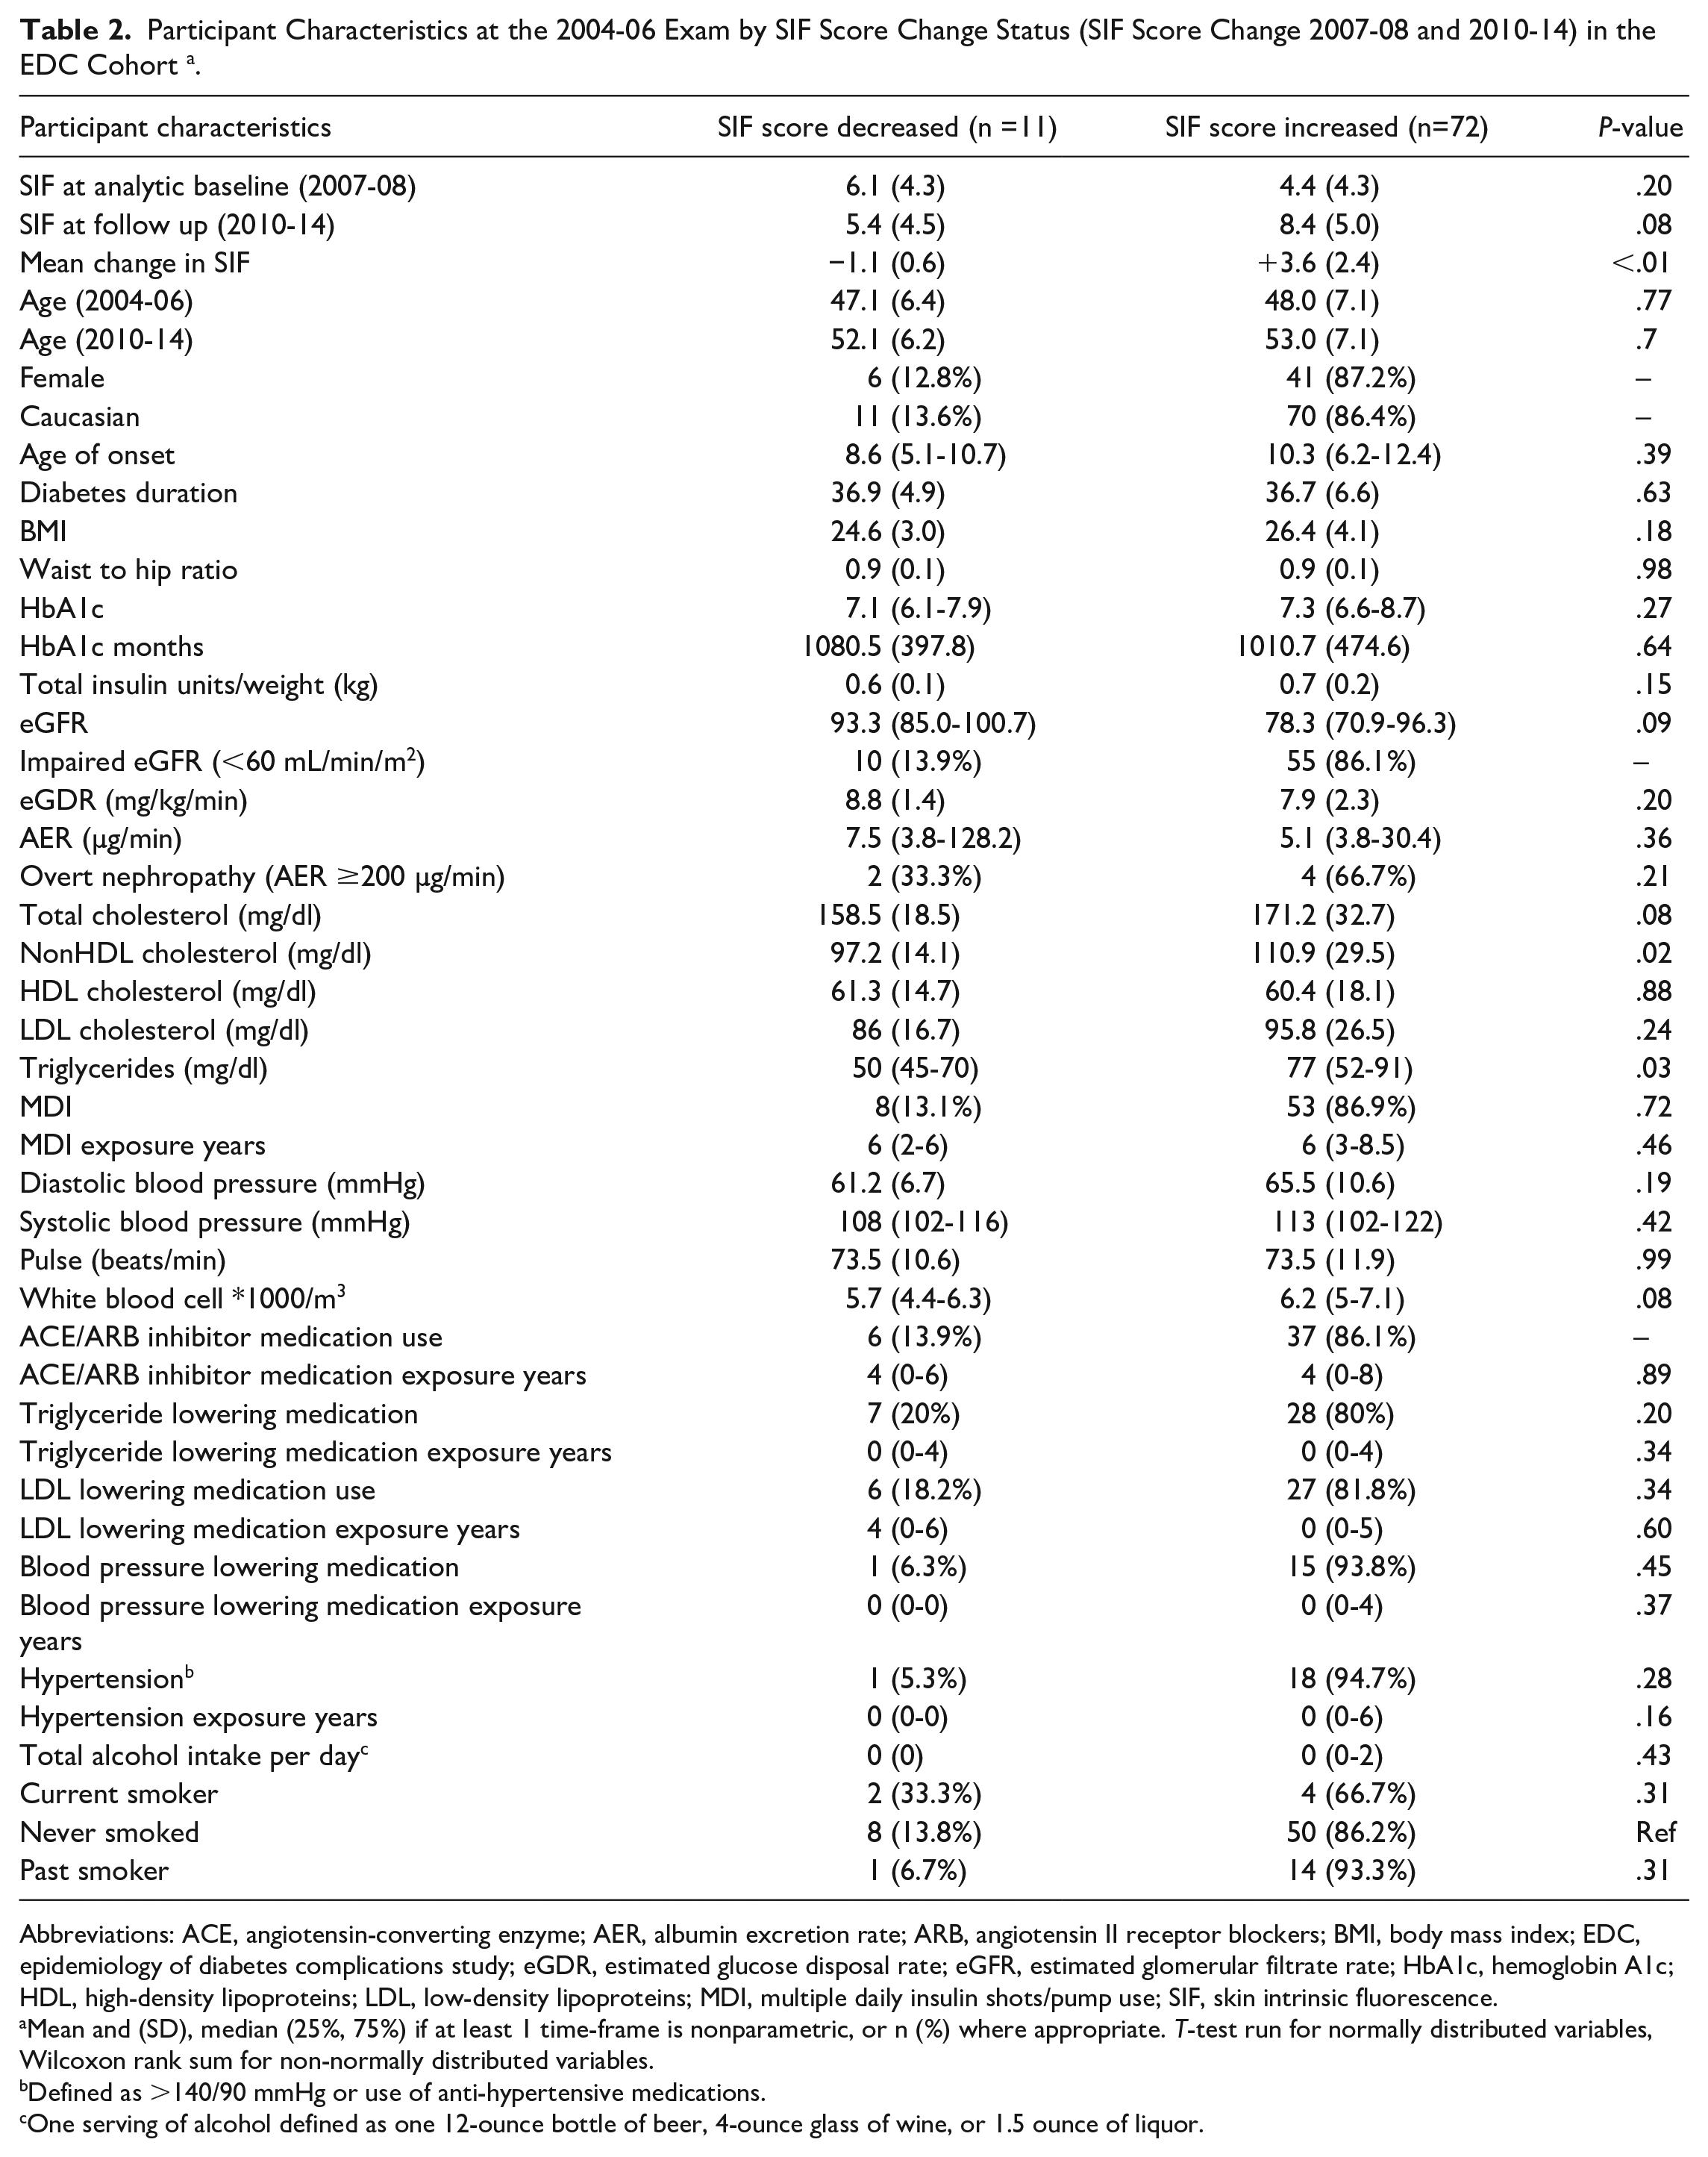
The mean SIF score for the entire sample (n = 83) at analytic baseline was 4.6 (± 4.3 AU); mean change in SIF scores was 2.9 AU (± 2.8). Table 2 compares participant characteristics at analytic baseline by type of SIF score change (increase or decrease). Most characteristics at analytic baseline were similar between participants with the exception of non-HDL cholesterol and triglycerides which were both significantly lower in those with decreased SIF score (P = 0.02, P = 0.03, respectively).
Participant Characteristics at the 2004-06 Exam by SIF Score Change Status (SIF Score Change 2007-08 and 2010-14) in the EDC Cohort a .
Abbreviations: ACE, angiotensin-converting enzyme; AER, albumin excretion rate; ARB, angiotensin II receptor blockers; BMI, body mass index; EDC, epidemiology of diabetes complications study; eGDR, estimated glucose disposal rate; eGFR, estimated glomerular filtrate rate; HbA1c, hemoglobin A1c; HDL, high-density lipoproteins; LDL, low-density lipoproteins; MDI, multiple daily insulin shots/pump use; SIF, skin intrinsic fluorescence.
Mean and (SD), median (25%, 75%) if at least 1 time-frame is nonparametric, or n (%) where appropriate. T-test run for normally distributed variables, Wilcoxon rank sum for non-normally distributed variables.
Defined as >140/90 mmHg or use of anti-hypertensive medications.
One serving of alcohol defined as one 12-ounce bottle of beer, 4-ounce glass of wine, or 1.5 ounce of liquor.
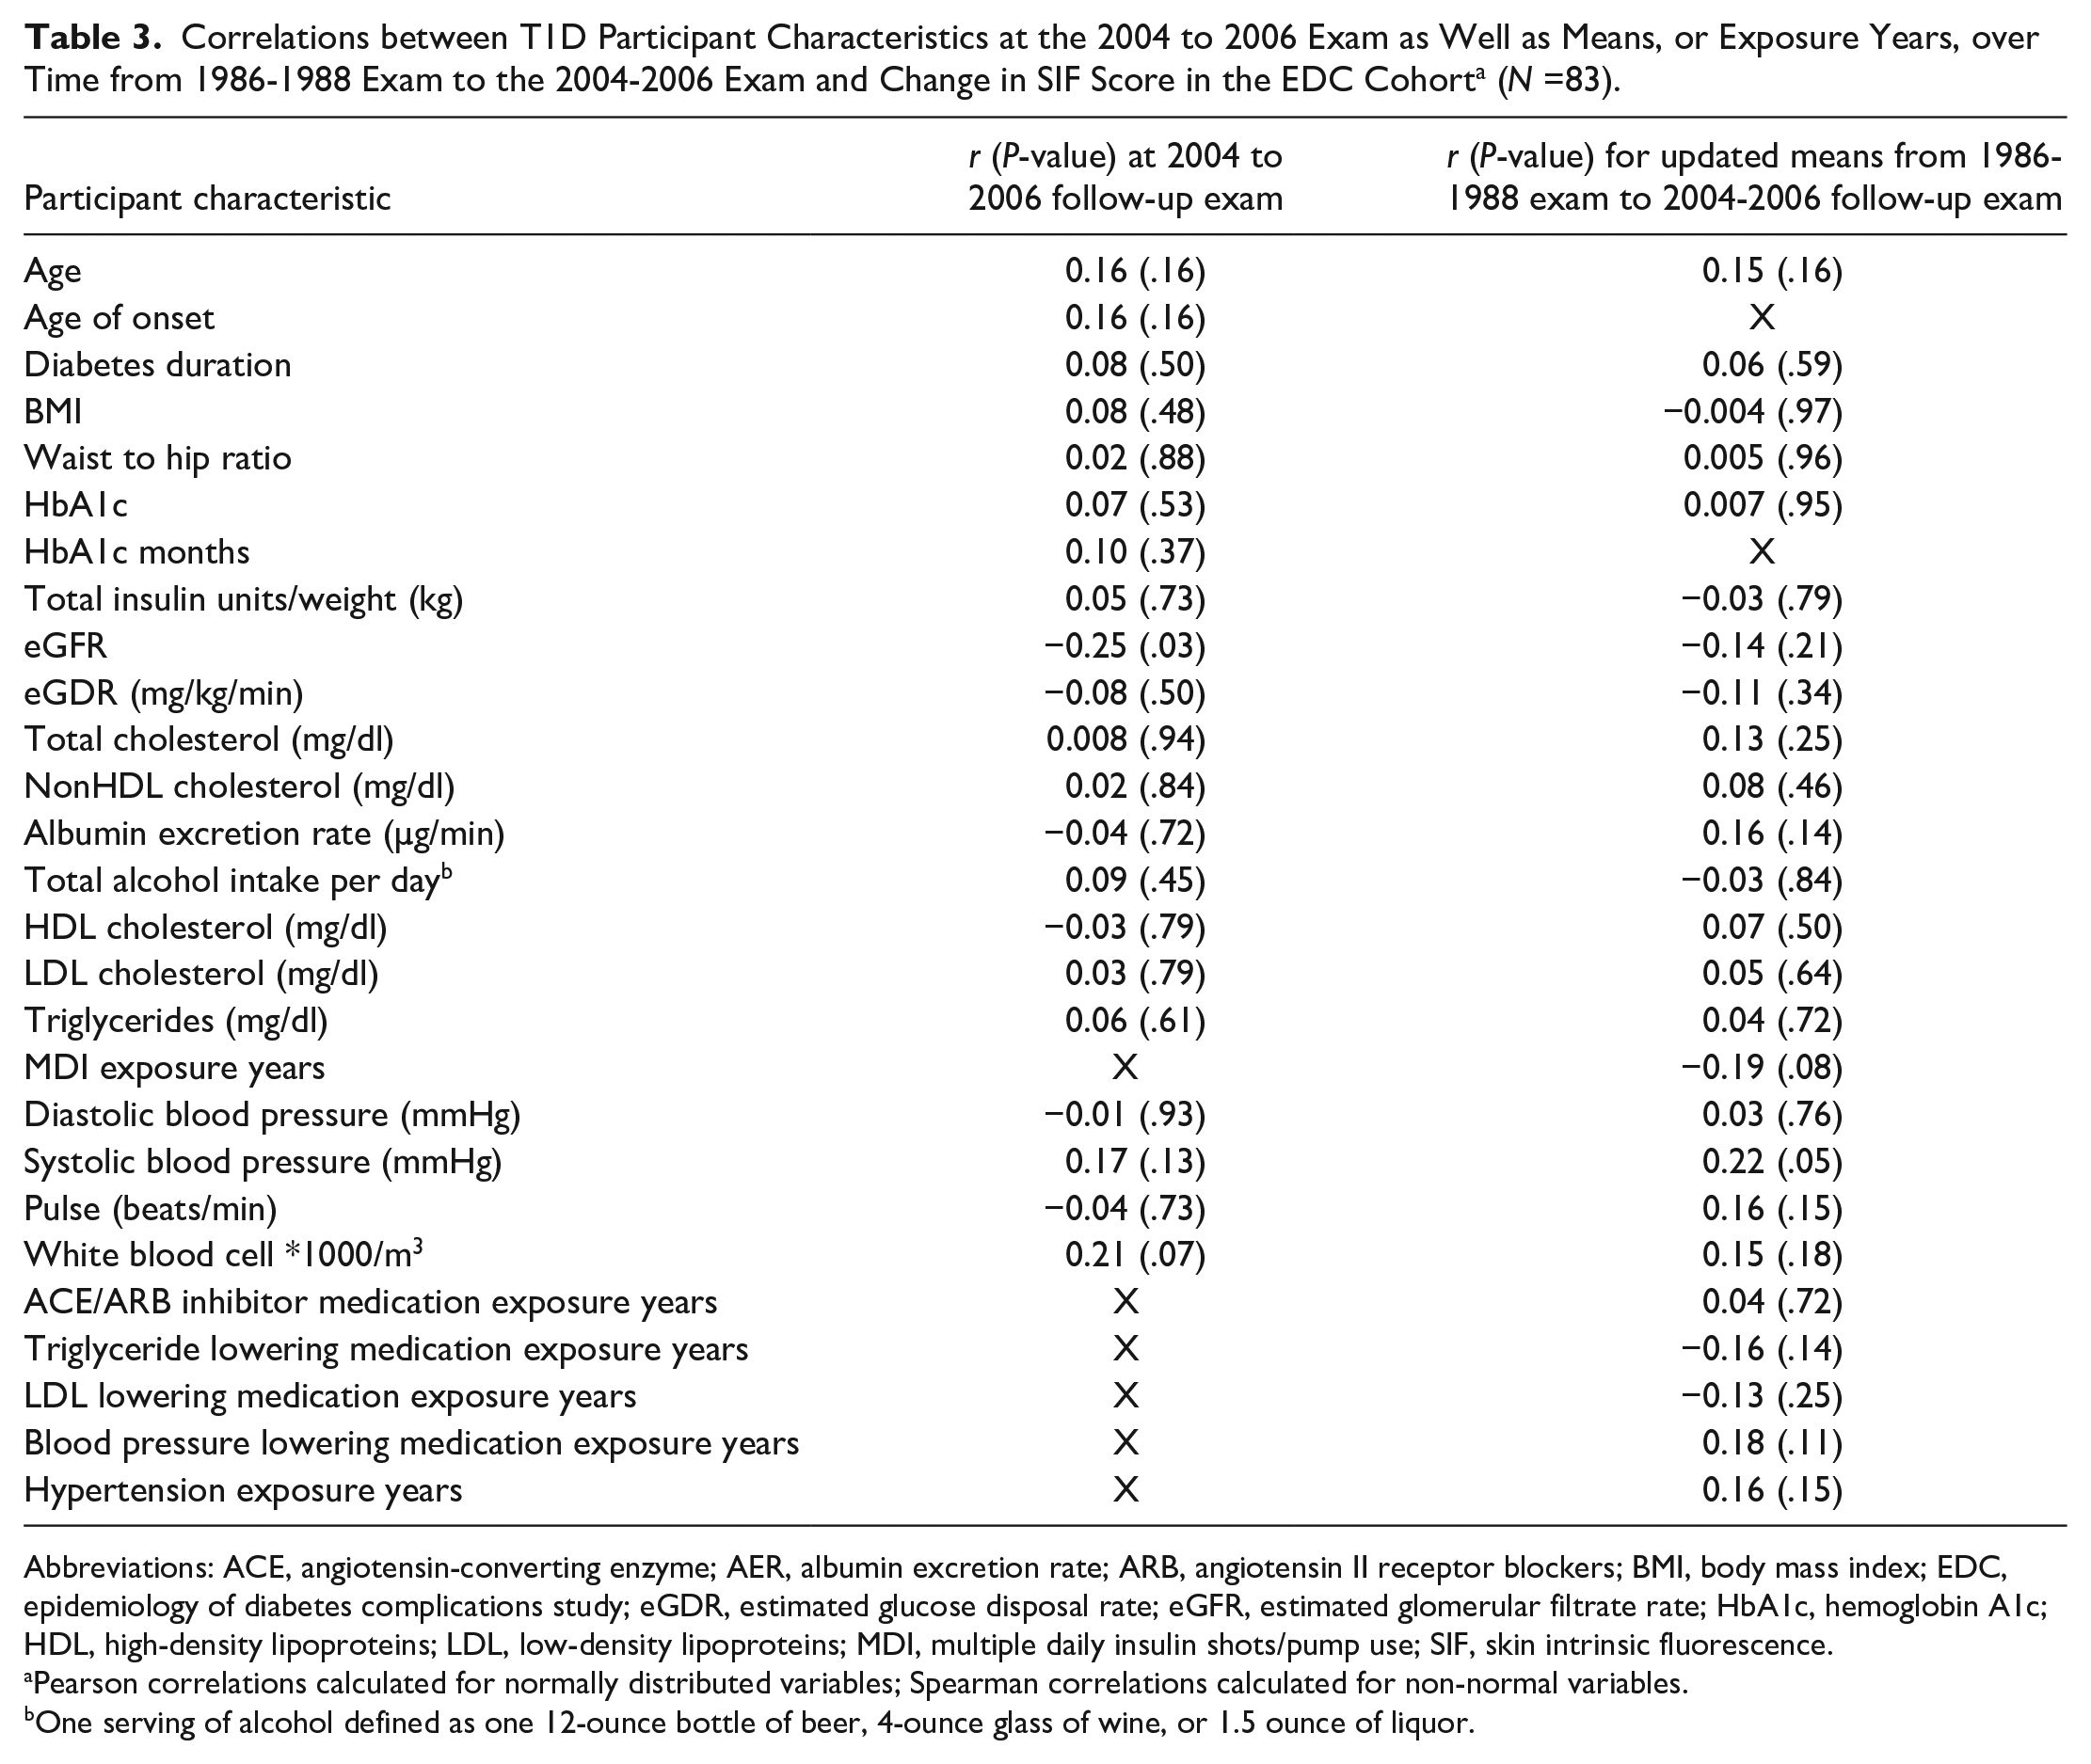
Correlations between risk factors at analytic baseline and change in SIF scores were also evaluated. Significant correlations were observed for eGFR (r2 = -0.3, P = 0.03) and updated mean SBP (r2 = 0.2, P = 0.06) (Table 3).
Correlations between T1D Participant Characteristics at the 2004 to 2006 Exam as Well as Means, or Exposure Years, over Time from 1986-1988 Exam to the 2004-2006 Exam and Change in SIF Score in the EDC Cohort a (N =83).
Abbreviations: ACE, angiotensin-converting enzyme; AER, albumin excretion rate; ARB, angiotensin II receptor blockers; BMI, body mass index; EDC, epidemiology of diabetes complications study; eGDR, estimated glucose disposal rate; eGFR, estimated glomerular filtrate rate; HbA1c, hemoglobin A1c; HDL, high-density lipoproteins; LDL, low-density lipoproteins; MDI, multiple daily insulin shots/pump use; SIF, skin intrinsic fluorescence.
Pearson correlations calculated for normally distributed variables; Spearman correlations calculated for non-normal variables.
One serving of alcohol defined as one 12-ounce bottle of beer, 4-ounce glass of wine, or 1.5 ounce of liquor.
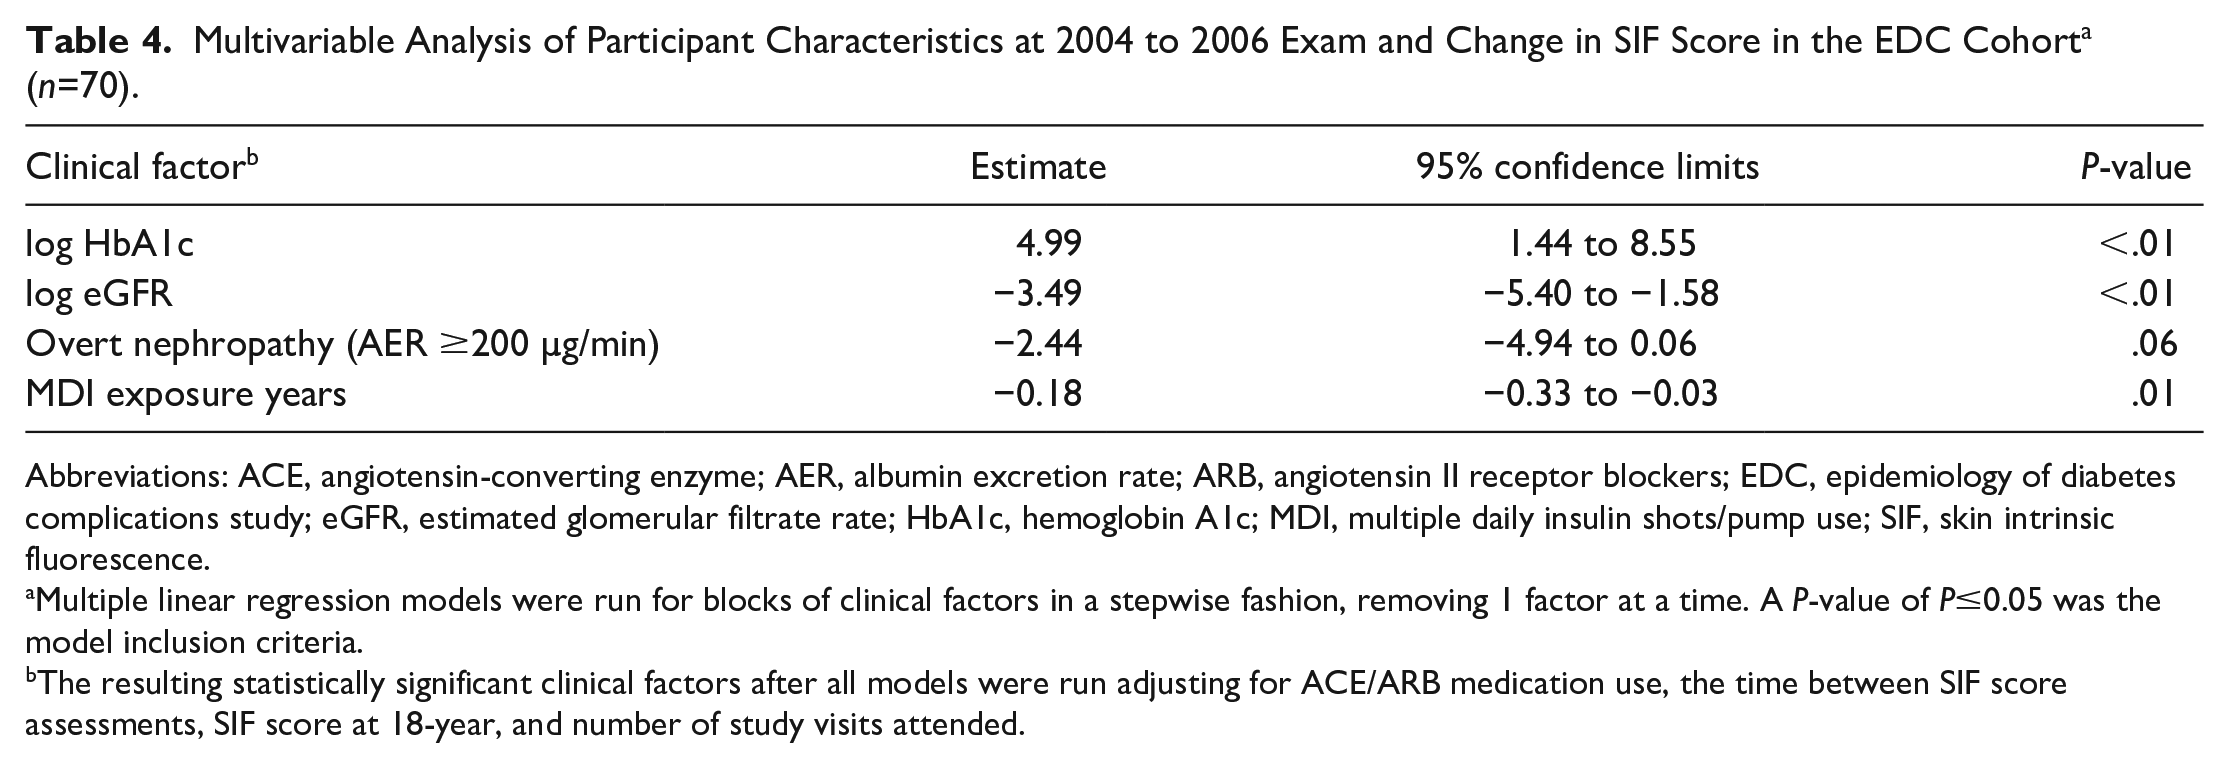
In multivariable models, higher HbA1c, lower eGFR, and fewer years of MDI exposure were independently associated with increased SIF scores. Conversely, ON was independently associated with decreased SIF scores. These associations are presented in detail in Table 4. The r-square of the final model was 26.9%. Models were limited to 70 observations with complete data on all clinical factor variables of interest at analytic baseline.
Multivariable Analysis of Participant Characteristics at 2004 to 2006 Exam and Change in SIF Score in the EDC Cohort a (n=70).
Abbreviations: ACE, angiotensin-converting enzyme; AER, albumin excretion rate; ARB, angiotensin II receptor blockers; EDC, epidemiology of diabetes complications study; eGFR, estimated glomerular filtrate rate; HbA1c, hemoglobin A1c; MDI, multiple daily insulin shots/pump use; SIF, skin intrinsic fluorescence.
Multiple linear regression models were run for blocks of clinical factors in a stepwise fashion, removing 1 factor at a time. A P-value of P≤0.05 was the model inclusion criteria.
The resulting statistically significant clinical factors after all models were run adjusting for ACE/ARB medication use, the time between SIF score assessments, SIF score at 18-year, and number of study visits attended.
Discussion
This study aimed to identify possible predictors of change in SIF scores based on data from a longitudinal cohort of adults diagnosed with T1D in childhood. We observed that modifiable risk factors, such as worse glucose control (ie, HbA1c) and lower kidney function were associated with increased SIF scores. Increased albuminuria in the range of overt nephropathy (AER ≥ 200 µg/min) was associated with a decrease in SIF scores during follow-up.
The results of our work indicate that higher HbA1c is related to increased SIF scores. A connection between HbA1c and AGEs is well-known: AGEs are formed by normal physiologic metabolic processes of glycol-oxidative chemistry in reducing sugars. The higher the blood glucose levels, the more AGEs form as a result of the glycation processes. Our research findings are consistent with existing cross-sectional research from the DCCT/EDIC study where historical HbA1c was strongly correlated with AGEs.12,13,31
Our findings indicate an association between longer exposure to MDI and a reduction in SIF scores. This finding was independent of HbA1c concentrations. It is possible that MDI reflects additional protective behaviors and/or factors beyond average or mean glucose exposure, for example less extreme glucose excursions, that have beneficial health effects and are reflected in reduced SIF scores.
We identified a link between worse kidney function (lower eGFR) and increased SIF scores. As the kidneys play a role in processing and clearing AGEs,32,33 it has been speculated that declining kidney functioning with increased T1D duration may be involved in a deficit in AGE detoxification, 34 which may contribute to up to 3 times the amount of normal AGE accumulation.35,36 It is also known that AGEs contribute to the development of chronic kidney disease. 37
Our study results revealed that the presence of overt nephropathy (urinary AER ≥ 200 µg/min) was associated with decreased SIF scores (although borderline statistically significant at P = 0.0552) (Table 4) in multivariable analyses accounting for renal function. It should be noted that in this multi-variable finding, only 6 observations in our sample had overt nephropathy and thus these findings warrant exploration in a larger sample. It is known that the kidney filters some AGEs and that high AER reflects glomerular membrane damage which can result in greater protein leakage and ultimately bigger molecules, including AGEs, leaking into the urine. Indeed, other research has found that in patients with T1D, urinary excretion of AGEs increases with worsening albuminuria suggesting that AGEs are excreted in the context of reduced renal functioning. 38 AER is inversely associated with and is modified by eGFR. This may explain our inverse association between high AER and decreased SIF scores after controlling for the effect of reduced renal function. Thus, if eGFR is accounted for, that is if the effect of decreased AGE clearance is removed, then those with severe glomerular damage and leakage will have greater renal loss of AGEs (high AER) and possibly decreased SIF. We were not able to find any prior work demonstrating that AER ≥ 200 µg/min is related to decreased SIF scores after adjusting for eGFR. While these novel observations need confirmation in other studies, they raise intriguing insights into AGE physiology.
A recent study has evaluated the relationship between T1D and progression of SAF. 39 In Rajaobelina et al, the AGE Reader device assessed collagen-linked AGEs via a SAF score. While both the SCOUT DS® and AGE Reader scores reflect glycol-metabolic memory, the devices employ different type and wavelength of light. Rajaobelina et al 39 found that among baseline variables, eGFR was associated with progression of SAF; those with mildly impaired eGFR (<90 mL/min/1.73m2) demonstrated the highest progression In stratified analysis (eGFR <90 mL/min/1.73m2 and/or AER >30 mg/24h vs. those without kidney impairment at baseline) in those without kidney impairment, continuous subcutaneous insulin infusion (CSII) was significantly associated with reduced SAF progression. 39 Interestingly, those treated with CSII also had a mean decrease in AGE score of −17.1%. 39
In our analysis (Table 4), 26.9% of the variance in SIF score change was explained by analytic baseline levels of HbA1c, eGFR, MDI, and overt nephropathy. There are likely several other factors that affect changes in SIF scores that were not identified in our research. The literature indicates that AGEs reflect broad components of a person’s overall health and ‘biological age’ and we know that factors such as diet, smoking, environmental exposures, 40 skin fluorescence/pigment, and hemoglobin levels 11 impact AGEs. Smoking exposure is related to increased collagen-linked AGE.41,42 However, smoking was not significantly associated with SIF score change in our work, this may be due small numbers of smokers in our sample.
This study has limitations. First, not all participants in the EDC study cohort were originally asked to participate in the SIF sub-study. Given this, there could be confounding factors in the sample of which we are unaware. However, after performing a comparison of characteristics of participants and non-participants, we found that generally there are no differences in major risk factors. The analytic sample was also small. A larger sample size may have provided us greater statistical power to clarify the relationships.
Another limitation is the technology producing the SIF score. While it is clear the SCOUT DS® assesses cross-linked fluorescent AGEs, it remains unknown which exact AGE compounds are being captured with a SIF score. In addition, the SIF score is calculated based on the amount of cross-linked AGEs per unit of collagen. Although SIF scores are intrinsically corrected to attempt to account for this, the only truly accurate way to assess collagen unit is by skin punch. Given this lack of clarity, there could be minor measurement error in the SIF dataset.
Conclusions
Our research reported herein is the first study assessing SIF score changes over time. Our analyses provide the first insights into possible predictors of SIF score changes in people with T1D. This work demonstrated that worse glucose control and lower kidney function were associated with increased SIF scores. Conversely, overt nephropathy, was associated with decreased SIF scores over time. Thus, our findings suggest that the mechanisms leading to AGE production and accumulation are partially driven by aspects of glucose control and kidney function. Future work in this area should focus on confirming our novel findings in people with childhood-diagnosed T1D to better understand SIFs potential in the natural history of complications.
Supplemental Material
sj-docx-1-dst-10.1177_19322968211014337 – Supplemental material for Predictors of Change in Skin Intrinsic Fluorescence in Type 1 Diabetes: The Epidemiology of Diabetes Complications study
Supplemental material, sj-docx-1-dst-10.1177_19322968211014337 for Predictors of Change in Skin Intrinsic Fluorescence in Type 1 Diabetes: The Epidemiology of Diabetes Complications study by Erin L. Tomaszewski, Trevor J. Orchard, Marquis S. Hawkins, Rebecca B.N. Conway, Jeanine M. Buchanich, John Maynard, Thomas Songer and Tina Costacou in Journal of Diabetes Science and Technology
Footnotes
Acknowledgements
none
Abbreviations
(AGE) advanced glycation end-products, (A/C) albumin-creatinine ratio, (AER) albumin excretion rate, (ARB) angiotensin II receptor blockers, (ACE) angiotensin-converting enzyme inhibitors, (AU) arbitrary units, (BMI) body mass index, (CAC) coronary artery calcification, (CSII) continuous subcutaneous insulin infusion, (DCCT/EDIC) Diabetes Control and Complications Trial/Epidemiology of Diabetes Interventions and Complications Study, (DBP) diastolic blood pressure, (EDC) Epidemiology of Diabetes Complications Study, (eGFR) estimated glomerular filtration rate, (eGDR) estimated glucose disposal rate, (HbA1) stable glycosylated hemoglobin, (HbA1c) glycosylated hemoglobin, (HDL) high density lipoprotein, (HTN) hypertension, (LED) light emitting diode, (LDL) low density lipoprotein, (MDI) multiple daily insulin shots/pump use, (ON) overt nephropathy, (SIF) skin intrinsic fluorescence, (SBP) systolic blood pressure, (T1D) type 1 diabetes
Declaration of Conflicting Interests
The author(s) declared the following potential conflicts of interest with respect to the research, authorship, and/or publication of this article: Dr. Orchard reports grants from the NIDDK/NIH during the conduct of the study; Dr. Costacou reports grants from NIDDK during the conduct of the study; E. Tomaszewski reports grants from the NIH during the conduct of the study and employment by AstraZeneca outside the submitted work. No competing financial interests are reported for Dr. Songer, Dr. Hawkins, Dr. Conway, Dr. Buchanich, and Mr. Maynard. Dr. Hawkins is supported by KL2 TR001856-03.
Funding
The author(s) disclosed receipt of the following financial support for the research, authorship, and/or publication of this article: Dr. Orchard reports grants from the NIDDK/NIH during the conduct of the study; Dr. Costacou reports grants from NIDDK during the conduct of the study; E. Tomaszewski reports grants from the NIH during the conduct of the study
Supplemental Material
Supplemental material for this article is available online.
References
Supplementary Material
Please find the following supplemental material available below.
For Open Access articles published under a Creative Commons License, all supplemental material carries the same license as the article it is associated with.
For non-Open Access articles published, all supplemental material carries a non-exclusive license, and permission requests for re-use of supplemental material or any part of supplemental material shall be sent directly to the copyright owner as specified in the copyright notice associated with the article.