
Abstract
Objectives:
This study compared the effectiveness of glycemic control among usual care, care management using a mobile application (app), and management using an app with additional e-coaching for patients with type 2 diabetes mellitus (T2DM) using a mixed treatment comparison (MTC) network meta-analysis (NMA).
Methods:
A systematic search for published randomized controlled trials (RCTs) was conducted, which included Pubmed, Web of Science, Cochrane Central Register of Controlled Trials, CINAL, Koreamed, KMbase, and ScienceOn, until October 2020. Among the 10,391 studies identified after removing duplicates, 14 RCTs were finally included in the MTC NMA. Data extraction and methodological quality assessment using version 2 of the Cochrane tool for assessing the risk-of-bias in randomized trials (RoB 2) was performed. The comparative efficacy was analyzed using the random-effects NMA based on a frequentist model by the intervention group and main outcome variables.
Results:
At the 3-month follow-up after each intervention, a comparison of the P-scores revealed the app plus e-coaching intervention to be the most effective method for reducing the HbA1c level in a homogeneous gender ratio group (P-score 0.92). At the 6-month follow-up period, app intervention was the best in reducing the HbA1c level in the homogeneous gender ratio and under 60 years of age group (P-score 1.00).
Conclusions:
Based on MTC analysis using the data from published RCTs, mobile apps or apps with e-coaching interventions for T2DM patients were more effective in improving the HbA1c values, FBS, and hypoglycemia frequency than usual care. Nevertheless, further research will be needed to clarify the effects of adding e-coaching to the app.
Study registration:
Research Registry UIN (reviewregistry780)
Introduction
Diabetes mellitus (DM) is one of the fastest-growing chronic diseases worldwide. Nevertheless, the disease is treatable, and its consequences can be prevented or delayed by regular blood sugar monitoring, management of complications, diet control, regular physical activity, and diabetes medication. 1 Furthermore, the possibility of complications after DM’s onset can be reduced by healthy lifestyle changes, such as maintaining a healthy body weight, eating a healthy diet, maintaining regular exercise, not smoking, and reduced alcohol consumption. 2
In this respect, the appropriate self-monitoring of the blood glucose (SMBG) helps achieve their HbA1c target and modify their lifestyle habits.3,4 On the other hand, despite the evidence-based benefits of SMBG for type 2 DM (T2DM) management, there are limitations in the timeliness of adequate intervention input, sufficient frequency, and accuracy.5,6 The American Diabetes Association (ADA)’s clinical practice recommendations state that when prescribing SMBG, physicians should ensure that the patients receive education and regular evaluations of the technique, results, and ability to use data from SMBG to adjust therapy. 7
Recently, the development of information technology (IT), including technology-assisted self-management support systems, has allowed technical health-applicants to use web-based interventions to adhere to their healthy lifestyle habit, manage blood glucose levels, prevent diabetes complications, and improve the quality of life (QOL) of patients with T2DM.3,7 Some evidence exists regarding the benefits of Web- and mobile phone-based diabetes management.8,9 Moreover, the effects of adding e-coaching in various ways to strengthen the effects of web-based systems have been studied.10-13 Nevertheless, few studies have compared the effectiveness between usual care, application management, and management with added e-coaching to a mobile application (app) for patients with T2DM.
Therefore, this study compared the effectiveness of the following 3 interventions using a mixed treatment comparison (MTC) network meta-analysis (NMA): (1) usual care, (2) care using an app to perform SMBG on a mobile phone or device, and (3) using an app to perform SMBG on a mobile phone or device and managed with additional e-coaching for patients with T2DM.
Methods
Research Question
This study examined what is effective in improving blood sugar control in T2DM among apps only, using apps with e-coaching, and usual care. On the other hand, there is still no consensus on the definition of e-coaching, but after reviewing the previous articles, the definition of e-coaching is defined as medical assistance provided based on the patient’s information collected in the app in various ways, such as direct coaching, remote coaching, and automatic coaching. 14
The PICO related to this research question were as follows.
Population: type 2 DM in adults
Intervention: (1) app (that is, care using an app to perform SMBG on a mobile phone or device) (T2), (2) app plus e-coaching (that is, care using an app and managed with additional e-coaching from healthcare providers) (T3)
Comparator: usual care (T1)
Outcomes: (1) glycated hemoglobin (HbA1c) (2) fasting blood sugar (FBS) (3) hypoglycemia frequency
Search Strategy
The literature database search included the core database Pubmed (https://www.ncbi.nlm.nih.gov/pubmed), Web of Science (https://apps.webofknowledge.com), Cochrane Central Register of Controlled Trials (https://www.cochranelibrary.com/advanced-search), CINAL (https://www.riss.kr/foreign/cinahl.do) and 3 domestic Korean databases, Koreamed (https://www.koreamed.org), Korean Medicine Database (KMBASE) (https://kmbase.medric.or.kr) and ScienceOn. (https://scienceon.kisti.re.kr/main/mainForm.do). The search keywords using both subject headings and keywords according to population and intervention: Diabetes Mellitus, Type2 [mesh], telemedicine [mesh], self-care [mesh], smartphone [mesh], cell phone [mesh], counseling [mesh], feedback [mesh], health promotion [mesh], and disease management [mesh]. The literature search was performed up to October 2020, and there were no language restrictions (Appendix 1).
Inclusion/Exclusion Criteria
Studies that met the following criteria were included.
(1) Population: type 2 DM in adults,
(2) Intervention: mobile apps or mobile apps plus personalized e-coaching,
(3) Study design: randomized controlled trial.
The exclusion criteria were as follows: (1) those who do not have type 2 DM; (2) studies without using mobile apps as an intervention; (3) Studies that report only outcomes related to application use, such as application satisfaction and utilization rate; (4) studies in which meta-analysis was impossible due to the insufficient reporting of outcome values; (5) study designs excluding a randomized controlled study (RCT), that is, non-RCT, such as systematic review (SR), qualitative research, trial protocols, research letters, and conference abstracts.
Data Extraction and Assessment of Bias
Two reviewers extracted the data from each study independently. The data were reviewed for consistency between the 2 extractors, and disagreements were resolved by consensus. For each study, the data extraction details included the selection criteria, population characteristics, the type of intervention, outcome measures, study results, and follow-up period.
In addition, 2 researchers independently evaluated the methodological quality of the studies included using version 2 the Cochrane tool for assessing the risk-of-bias in randomized trials (RoB 2), in which 5 bias domains were evaluated: randomization process, deviations from intended interventions, missing outcome data, measurement of the outcome, and selection of the reported results. 15 The response options of the risk-of-bias judgments for each domain and overall were “low risk of bias,” “some concerns,” or “high risk of bias”. 15 In particular, the overall risk-of-bias judgment of studies was graded as follows: (1) “low risk of bias” when a low risk of bias was determined for all domains; (2) “some concerns” if at least one domain was assessed as raising some concerns, but not to be at high risk of bias for any single domain; or (3) “high risk of bias” when a high risk of bias was reached for at least one domain or the study judgment included some concerns in multiple domains.
Statistical Analysis
The random-effects network meta-analysis (NMA) was conducted based on a frequentist model by the intervention group and main outcome variables, with mean difference (MD) or odds ratio (OR) as the effect size between the interventions: usual care (T1) vs apps (T2) vs apps plus e-coaching (T3). NMA can evaluate multiple interventions that may, or may not, have been compared directly in clinical trials, thereby providing a hierarchical ranking for multiple groups without direct comparisons. 15 The 2 basic assumptions of NMA were transitivity and consistency. The hypothesis of transitivity is that it allows a statistical comparison between A and B when obtaining the head-to-head results of A vs C and B vs C, respectively. 16 In addition, the consistency between the estimates of the treatment effect obtained from a direct and indirect estimate is important to the assumption that maintains the NMA, so the difference was tested based on the statistics on the difference between the direct and indirect estimates using the automated generation of node splitting models to verify the consistency, and check for consistency with the Q static and P-value.15,17 The indicators that assess the presence of statistical heterogeneity in NMA were I2 and the Q static and P-value. The I2 values were <25%, 25%-50%, and >50%, indicating low, moderate, and high heterogeneity, respectively. P values less than .1 indicated significant heterogeneity and inconsistency. 16 As a result of the NMA, subgroup analysis was performed according to the gender ratio and age group when heterogeneity and inconsistency were found.
Network forest plots were used to show the pooled effect estimates and their associated uncertainty for all interventions compared to the reference treatment. The plot also displayed the 95% confidence interval (CI) along with the estimates and the P-score used to rank all therapies based on network estimates. In this study, higher values indicated better treatments.
R (version 3.6.1) was used as the software for statistical analysis, and the functions included in the “netmeta” package were utilized. 16 A statistical hypothesis test was performed based on the significance level of .05.
Results
Selected Studies
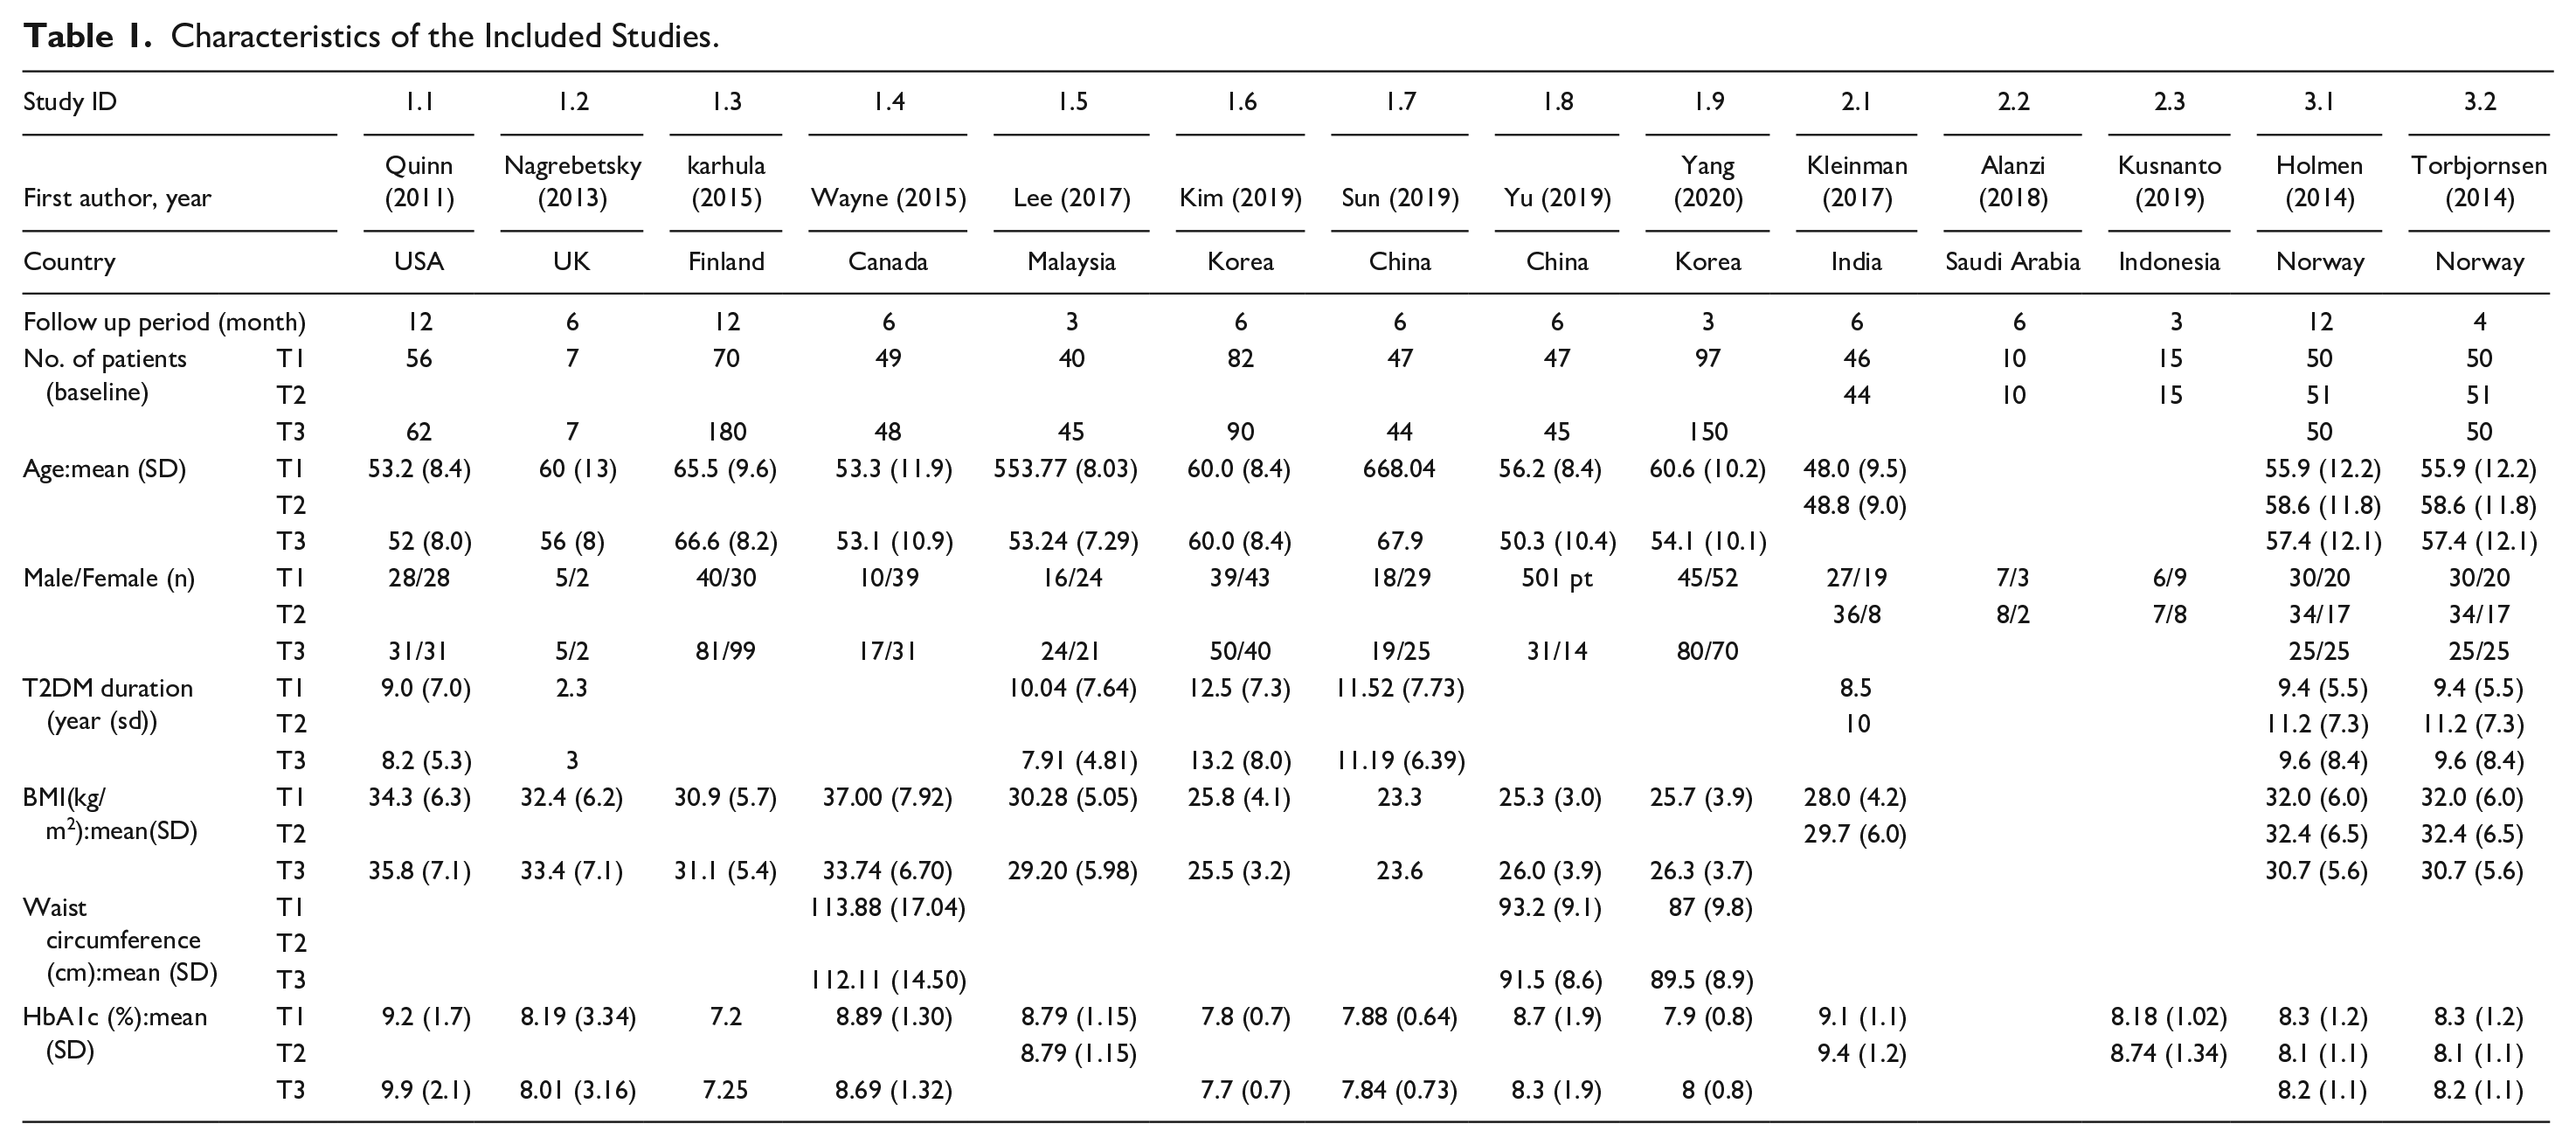
Fourteen RCTs were included in the meta-analysis (Figure 1, Appendix 2-3). The follow-up period ranged from 3 months to 1 year. Table 1 lists the demo and clinical characteristics of each study. The studies included were conducted in several different countries, such as China, the Republic of Korea, Norway, the USA, the UK, and Canada. Various apps were used for each study included. Some apps automatically transmit the blood glucose values through Bluetooth. There were differences in the additional functions such as nutrition and exercise and inputting the blood glucose values for each app. Furthermore, there was a difference in the e-coaching method, namely the coaching subject, method, and frequency. The coaching practitioners were members of a variety of medical teams including physician, nurse, and/or dietician, and it was done at a frequency of any time to once a month using messages or phone calls (Tables 1 and 2).
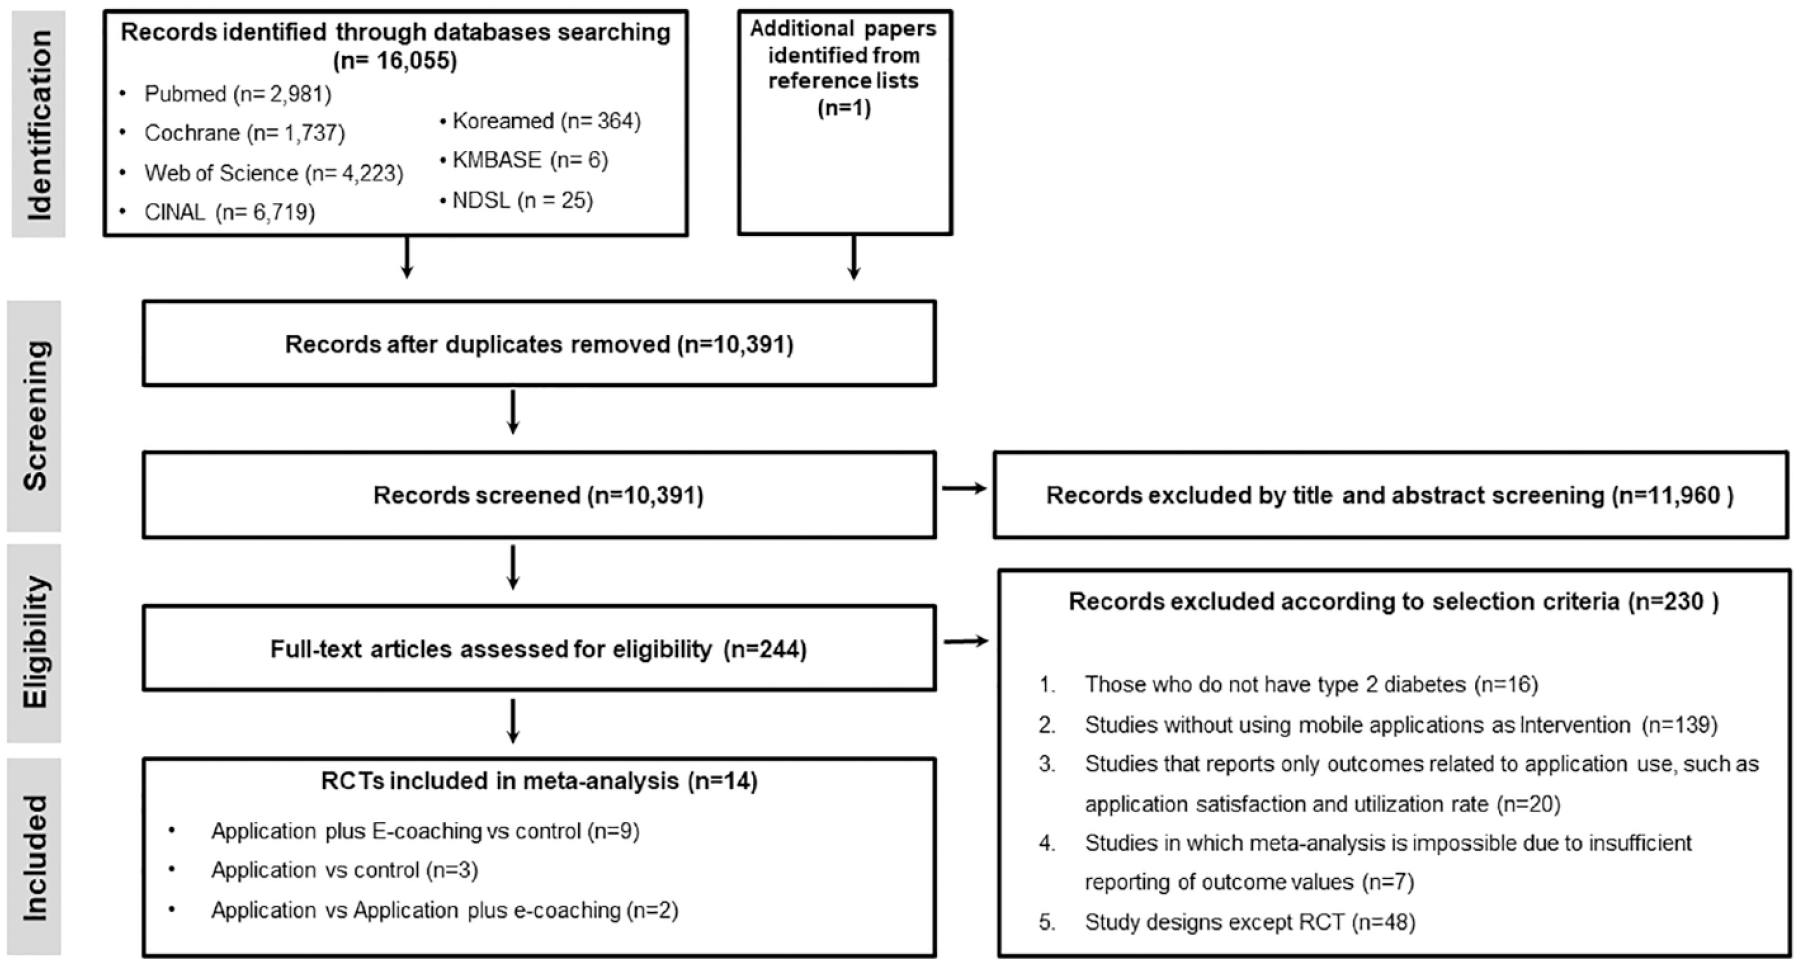
Flow diagram of study selection.
Characteristics of the Included Studies.
Type of Intervention in the Included Studies.
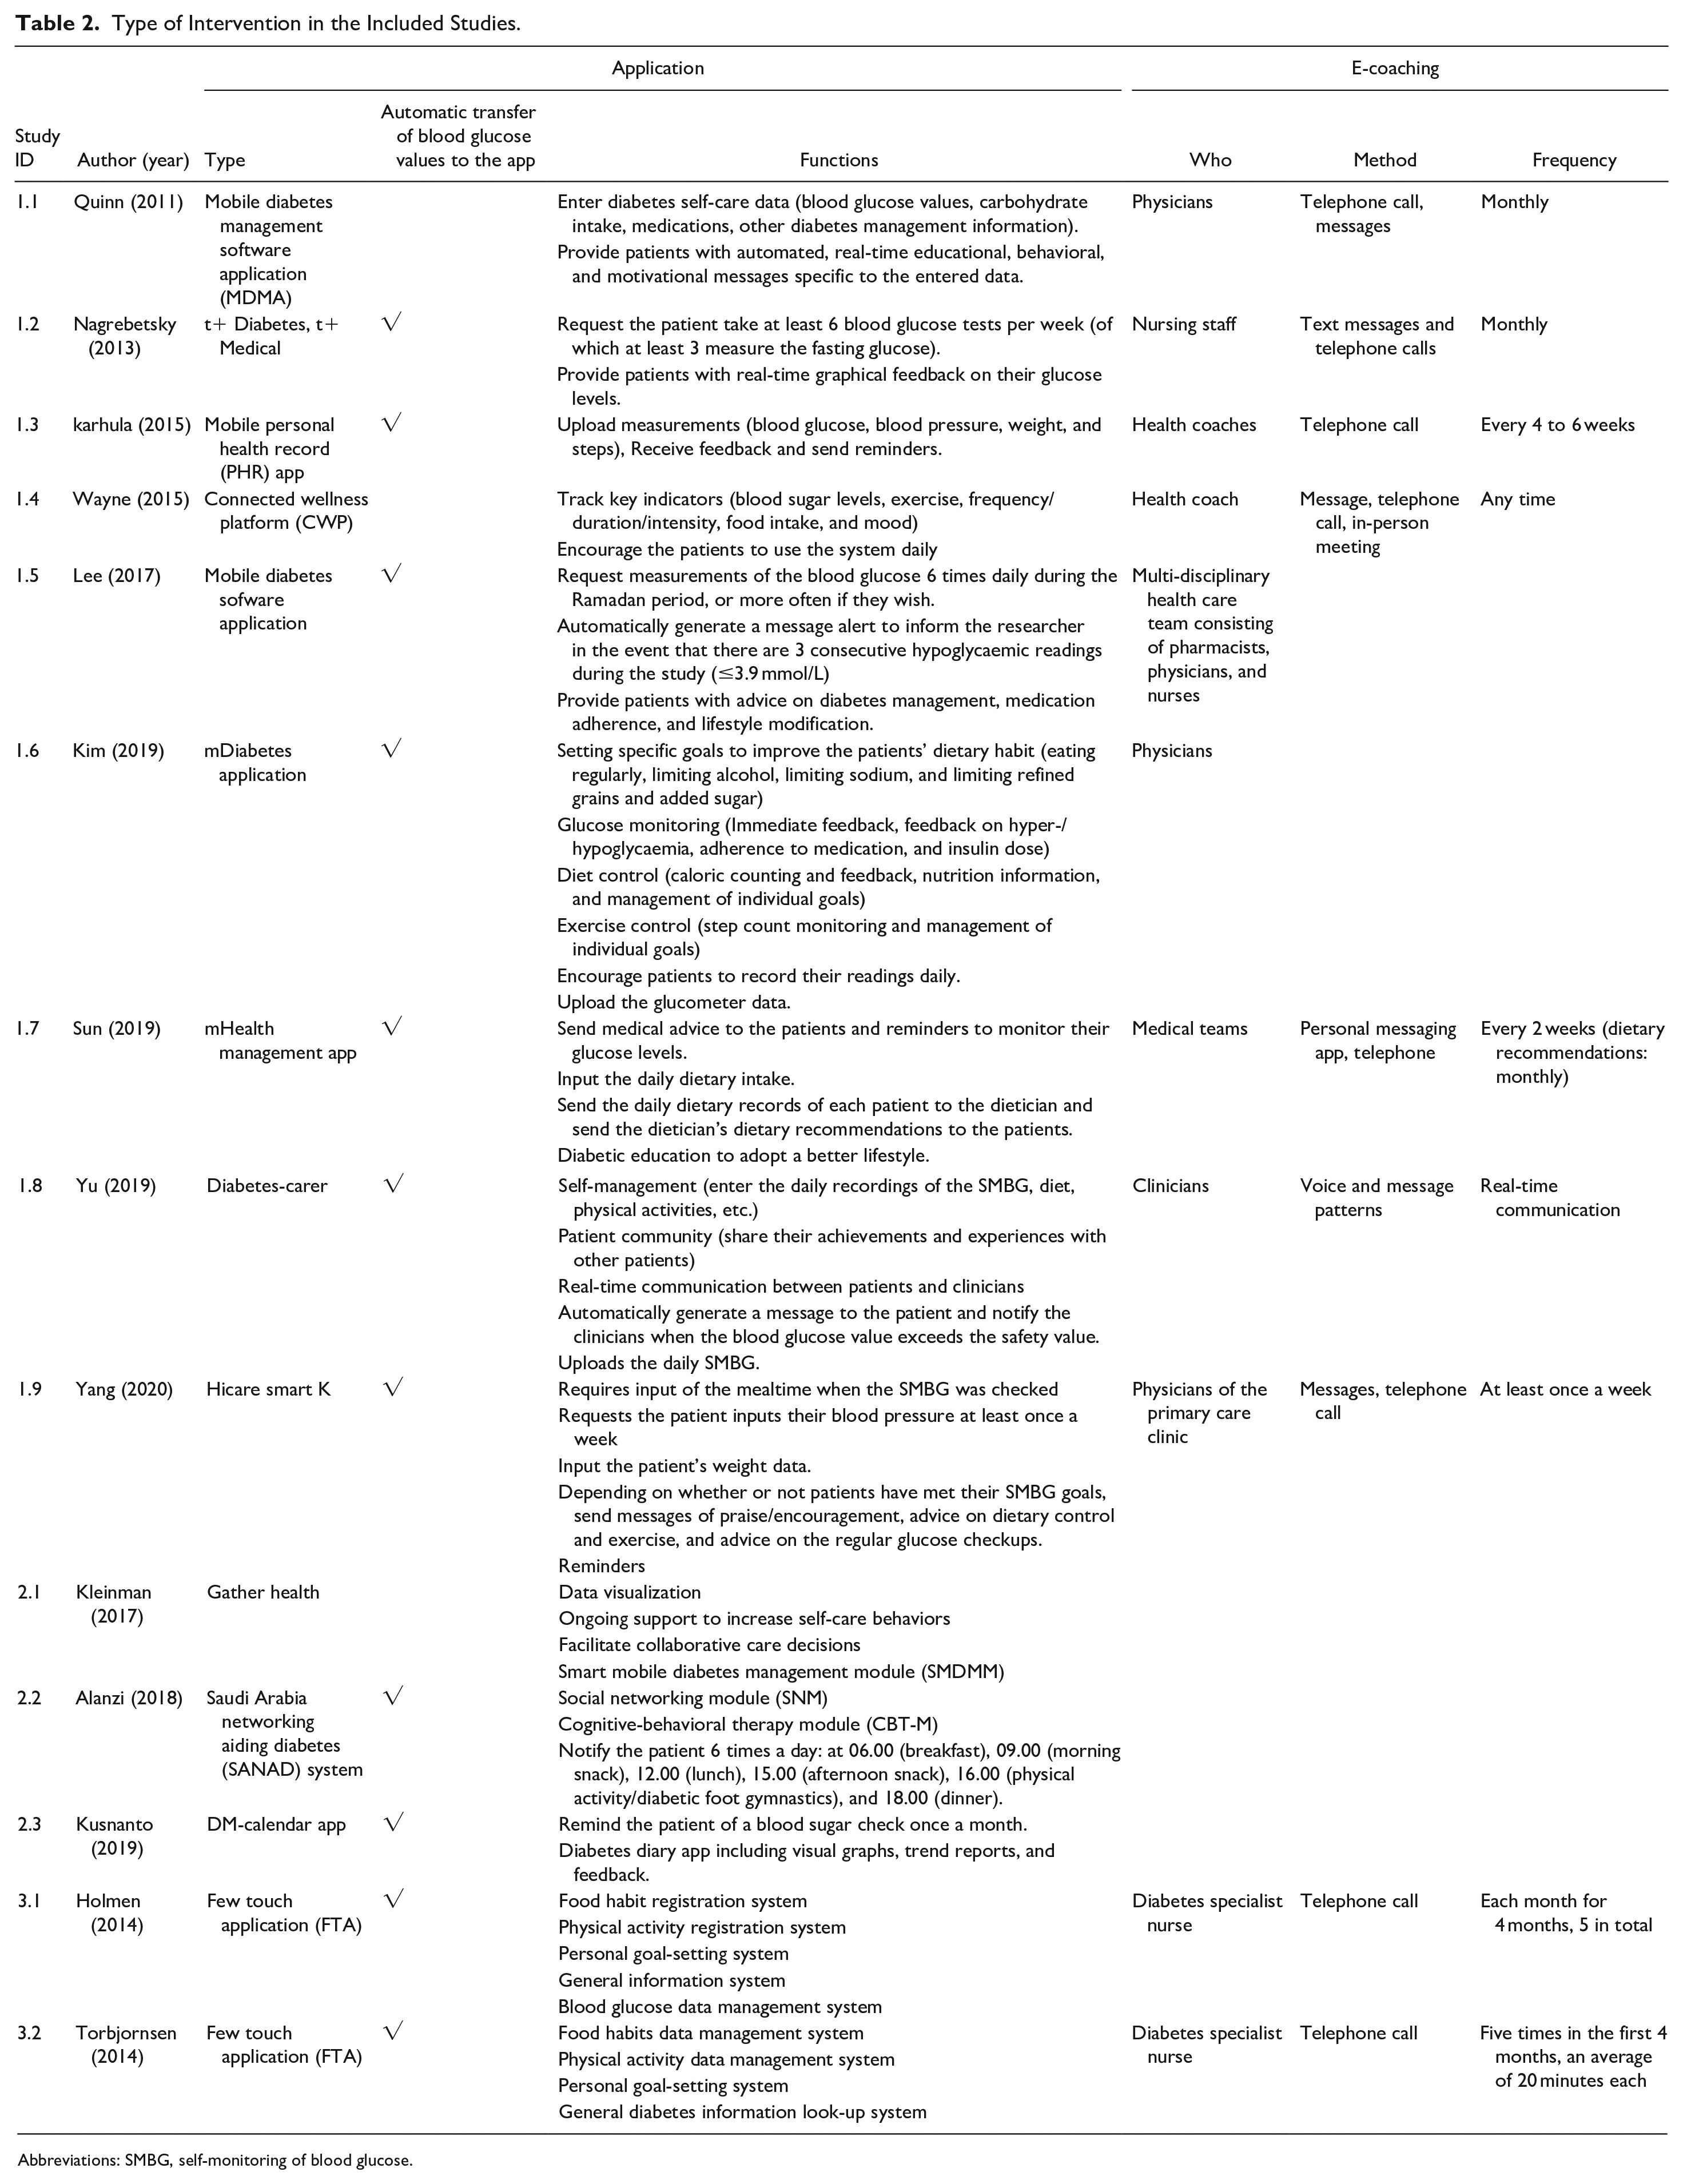
Abbreviations: SMBG, self-monitoring of blood glucose.
Improving Glycemic Control: Glycated Hemoglobin (HbA1c)
Thirteen studies were included in the NMA that reported or could calculate the mean difference and SD between before and after for each group (Table 3).
Comparative Effect on HbA1c.
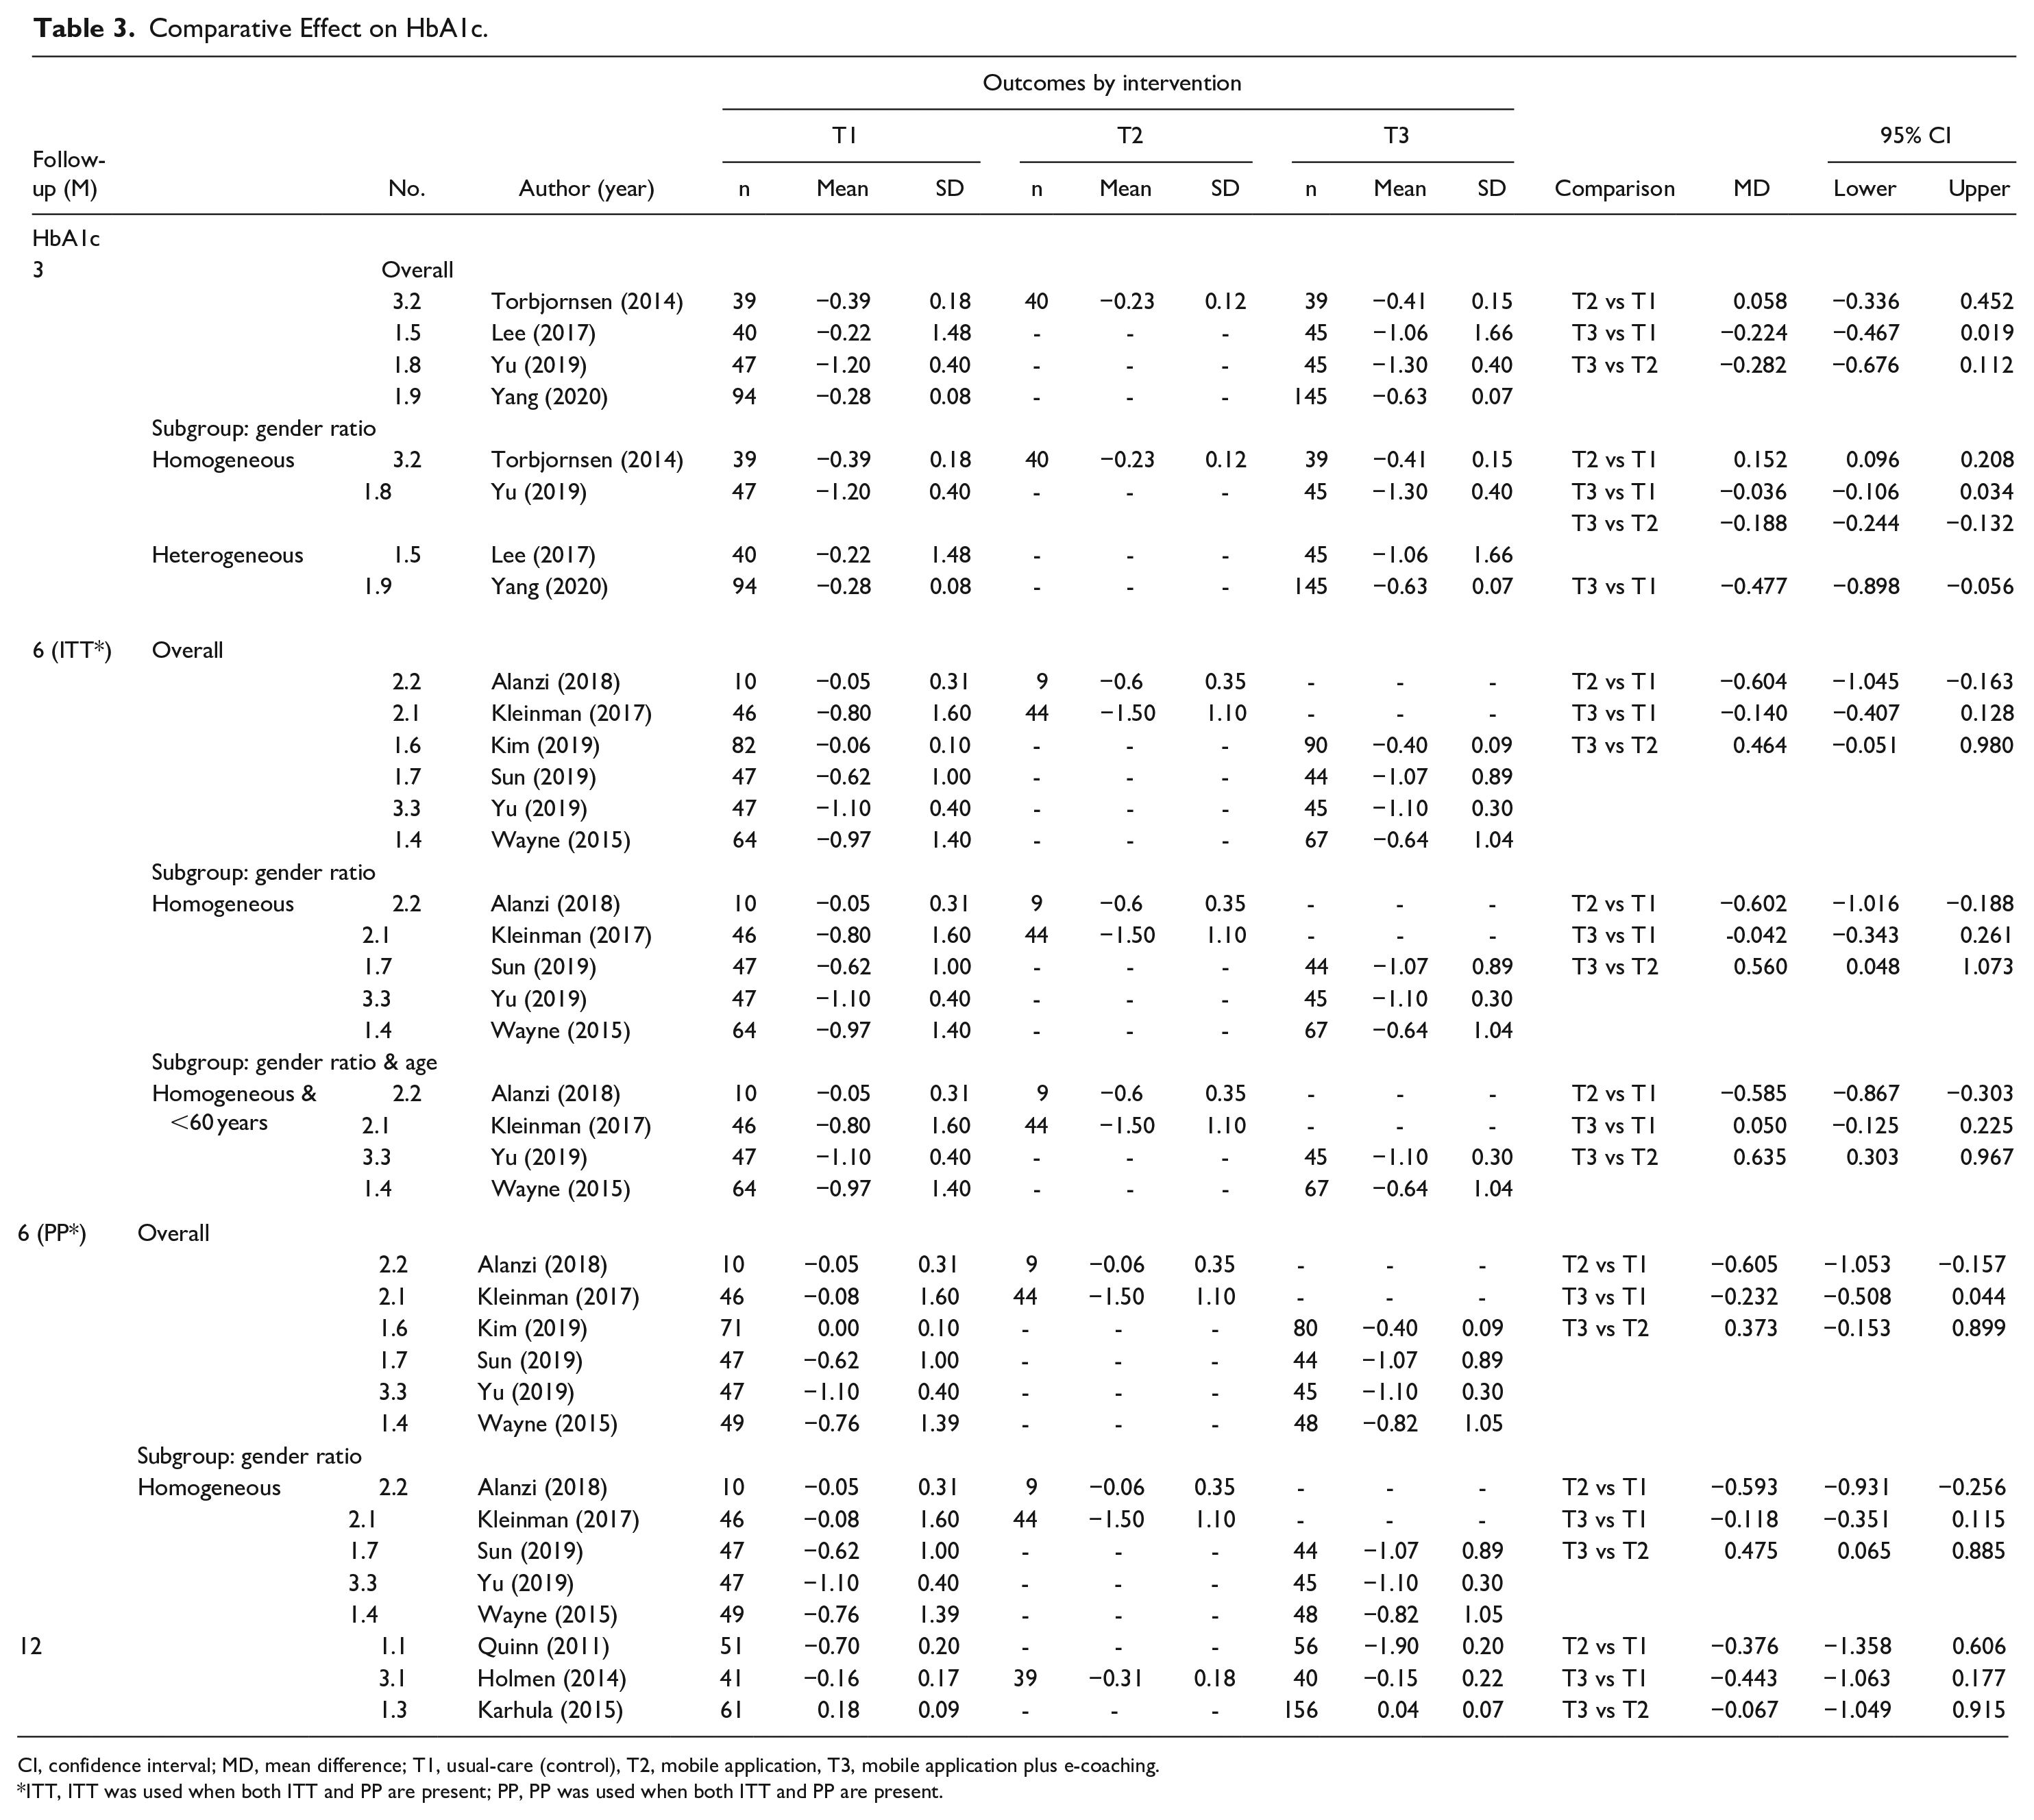
CI, confidence interval; MD, mean difference; T1, usual-care (control), T2, mobile application, T3, mobile application plus e-coaching.
ITT, ITT was used when both ITT and PP are present; PP, PP was used when both ITT and PP are present.
Four studies reported the outcome of the 3-month follow-up period, and the analysis results are as follows. Looking at the estimate and 95% CI for the mean difference between interventions, that is, T2 vs T1, T3 vs T1, and T3 vs T2, the 95% CI was zero. Therefore, there was no significant difference between the interventions for HbA1c reduction.
The P-scores were next compared. The T3 intervention was the best in reducing the HbA1c (P-score 0.94) (Figure 2a). On the other hand, since heterogeneity existed (I2 = 96%, Q = 11.72, P-value = .0028), subgroup analysis was performed by distinguishing whether the gender ratio was homogeneous in the groups. In the homogeneous gender ratio groups, there was a significant difference between the interventions for HbA1c reduction, excluding T3 vs T1. A comparison of the P-scores revealed the T3 intervention to be the best for HbA1c reduction (P-score = 0.92), and there was no heterogeneity (I2 = 0%, Q = 0.0, P-value = 1.000) or inconsistency (Q = 0.80, P-value = .3711) issues that could be interpreted as the final meta-analysis result (Figure 2b). In the heterogeneous gender ratio groups, there was a significant difference between the interventions for HbA1c reduction. A comparison of the P-scores revealed the T3 intervention to be the best for HbA1c reduction (P-score = 0.99), and there was no heterogeneity (I2 = 51.8%, Q = 2.08, P-value = .1497) that could be interpreted as the final meta-analysis result (Figure 2c).
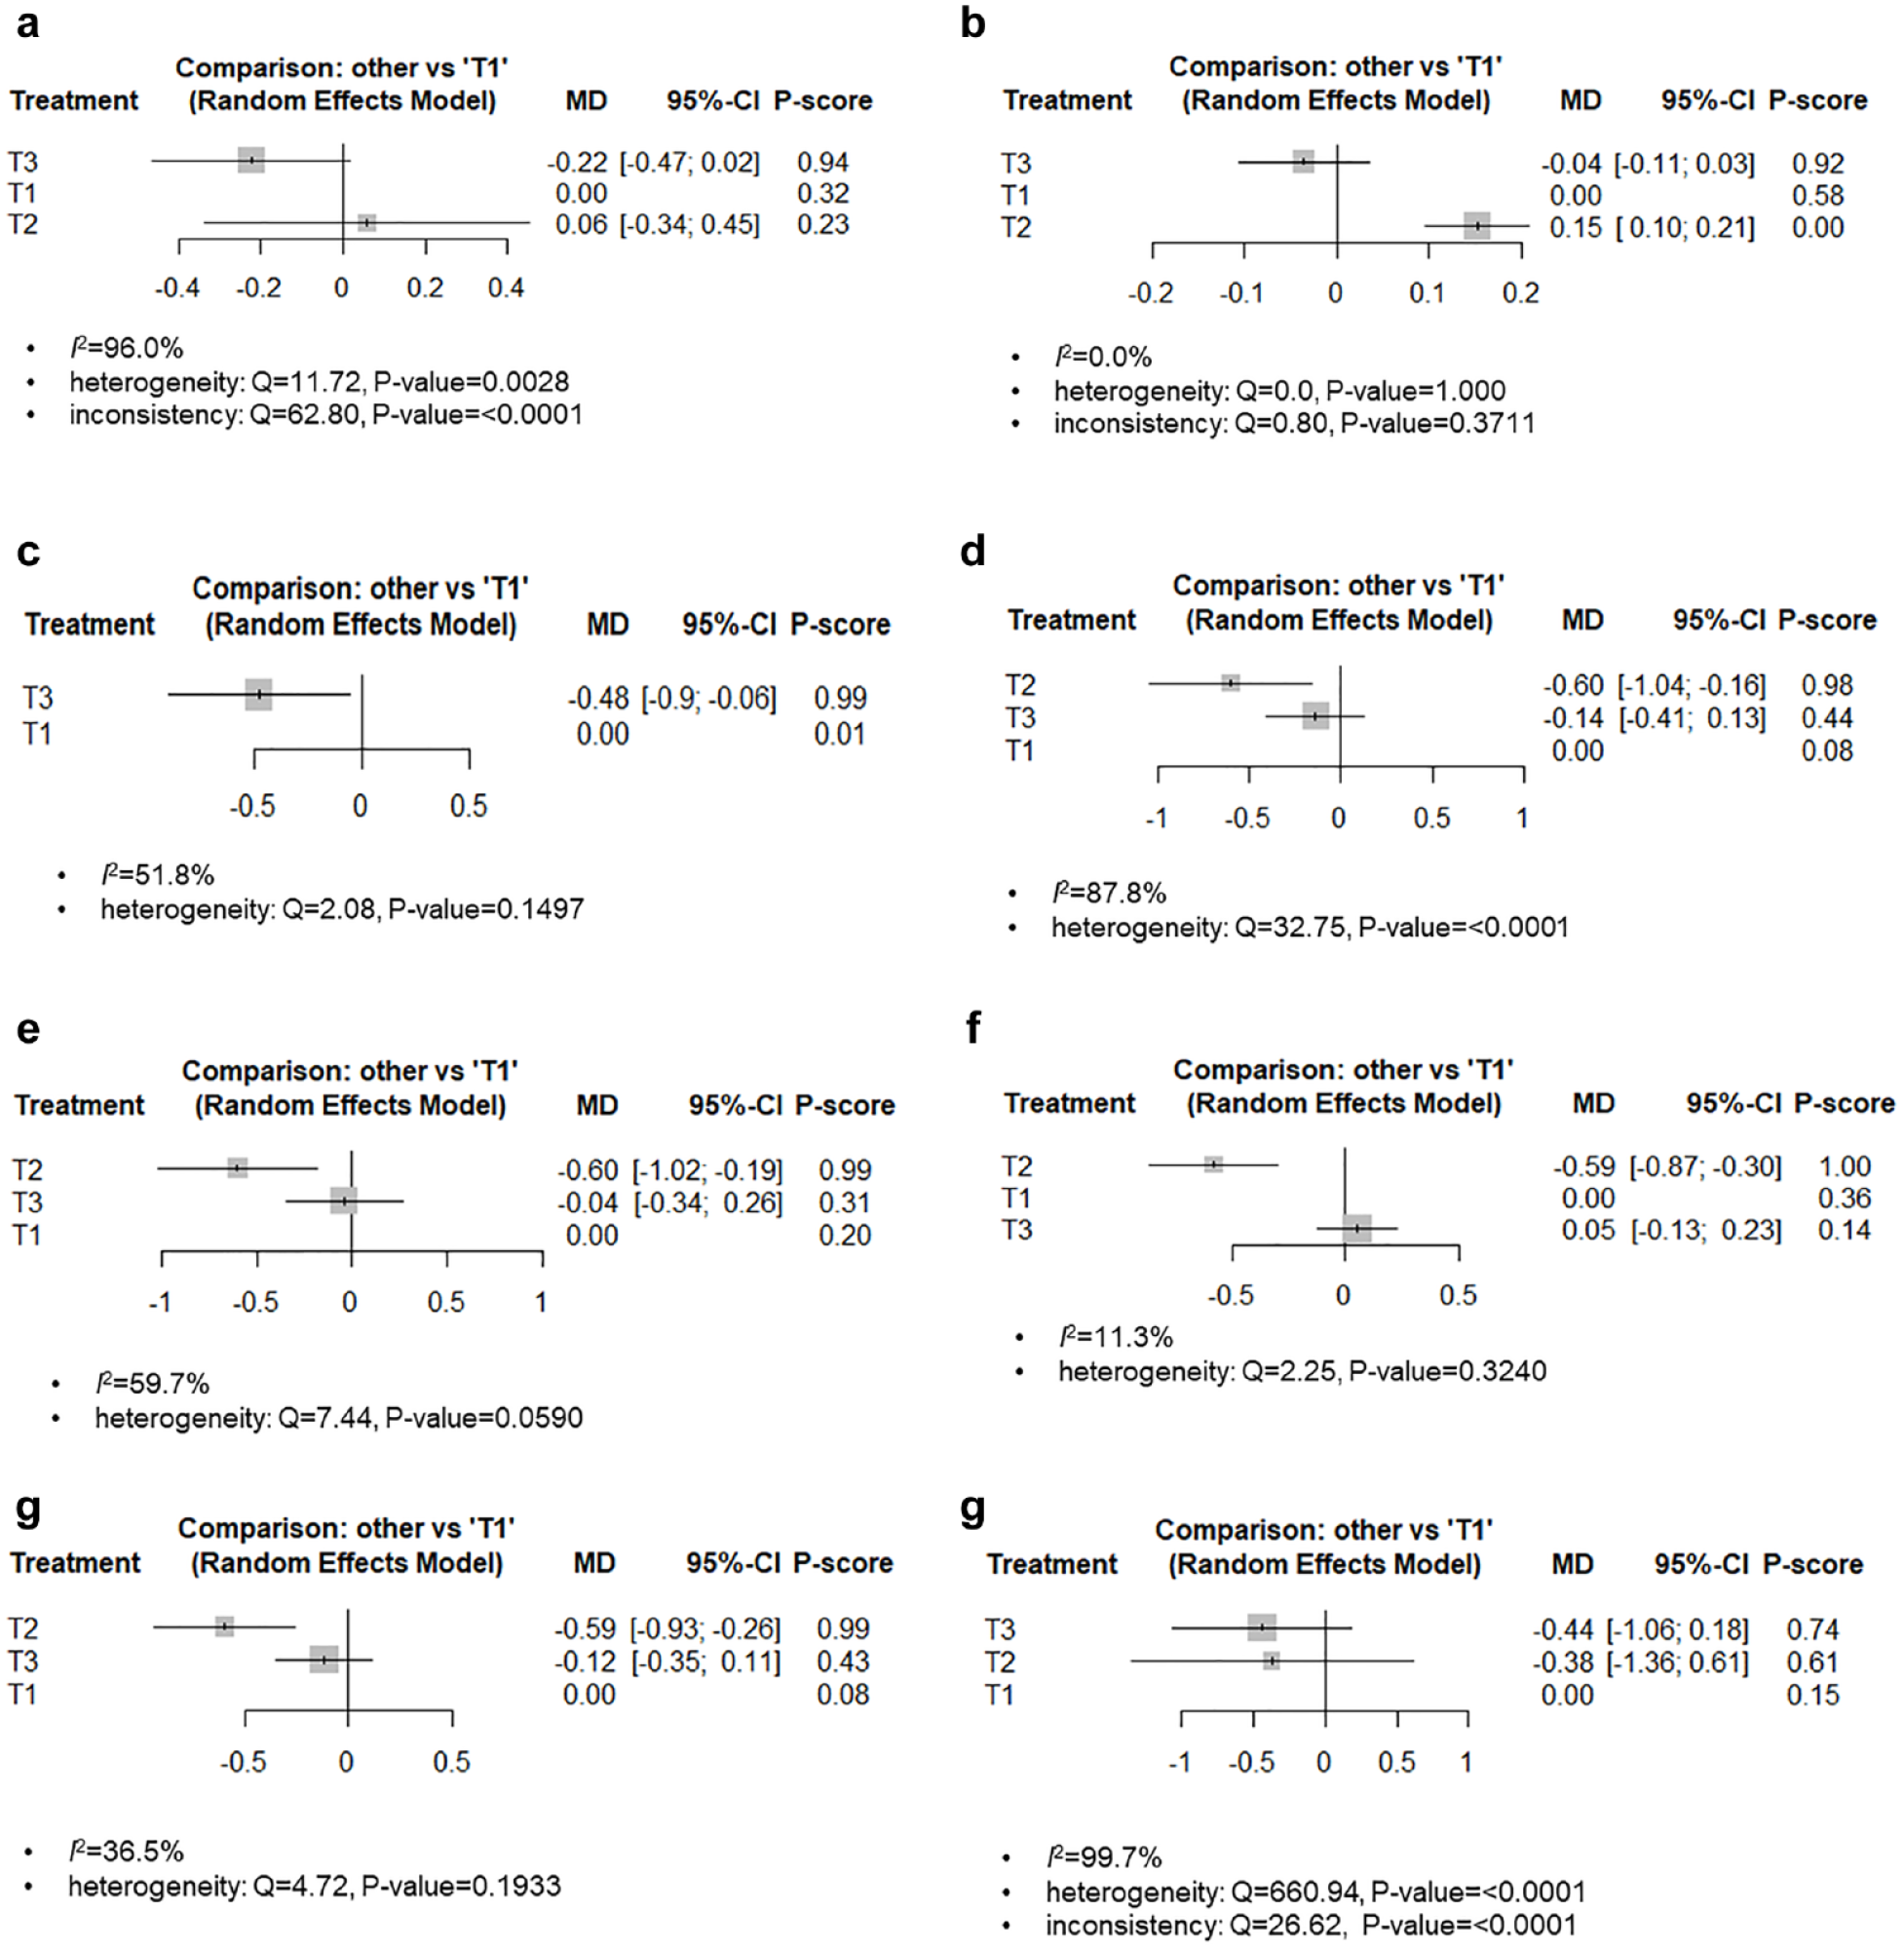
Network forest plot of HbA1c. (a) total (3 months) (b) homogeneous gender ratio (3 months) (c) heterogeneous gender ratio (3 months) (d) total (6 months, ITT) (e) homogeneous gender ratio (6 months, ITT) (f) homogeneous gender ratio and <60 years old (6 months, ITT) (g) homogeneous gender ratio (6 months, PP) (h) total (12 months).
Six studies reported the outcome of the 6-month follow-up period, and the analysis results were as follows. Intention to treat (ITT) analysis revealed no significant difference between the interventions for HbA1c reduction. A comparison of the P-scores revealed the T2 intervention to be the best in reducing HbA1c (P-score = 0.98) (Figure 2d). On the other hand, because heterogeneity existed (I 2 = 87.8%, Q = 32.75, P-value = <.0001), subgroup analysis was performed by distinguishing whether the gender ratio was homogeneous between the groups. In the homogeneous gender ratio groups, there was a significant difference between the interventions for HbA1c reduction, excluding T3 vs T1. A comparison of the P-scores showed that the T2 intervention was the best for HbA1c reduction (P-score = 0.99) (Figure 2e). The heterogeneity was reduced somewhat (I 2 = 59.7%, Q = 7.44, P-value = .059), but it still existed based on the statistical significance. Therefore, other subgroup analyses were performed based on the age group. The homogeneous gender ratio and under 60 years of age group had a significant difference between the interventions for HbA1c reduction, except for T3 vs T1. Moreover, there was no heterogeneity (I2 = 11.3%, Q = 2.25, P-value = .324) that could be interpreted as the final meta-analysis result (Figure 2f).
On the other hand, the per-protocol (PP) analysis results showed that the T2 intervention was the best for HbA1c reduction in the homogeneous gender ratio group (P-score = 0.99) (Figure 2g).
An analysis of the 3 studies reporting the outcome of the 12-month follow-up period showed no significant difference between the interventions in terms of the HbA1c reduction. Although the T3 intervention was the best in reducing the HbA1c level (P-score = 0.74), heterogeneity (I2 = 99.7%, Q = 660.94, P-value = <.0001) and inconsistency (Q = 26.62, P-value= <.0001) not resolved by subgroup analysis were found (Figure 2h).
Fasting Blood Sugar (FBS) Level
Four studies that reported or could calculate the mean difference and SD between before and after for each group were included in the NMA (Table 4).
Comparative Effect on the Fasting Blood Sugar, Hypoglycemia Frequency and Change in BMI.
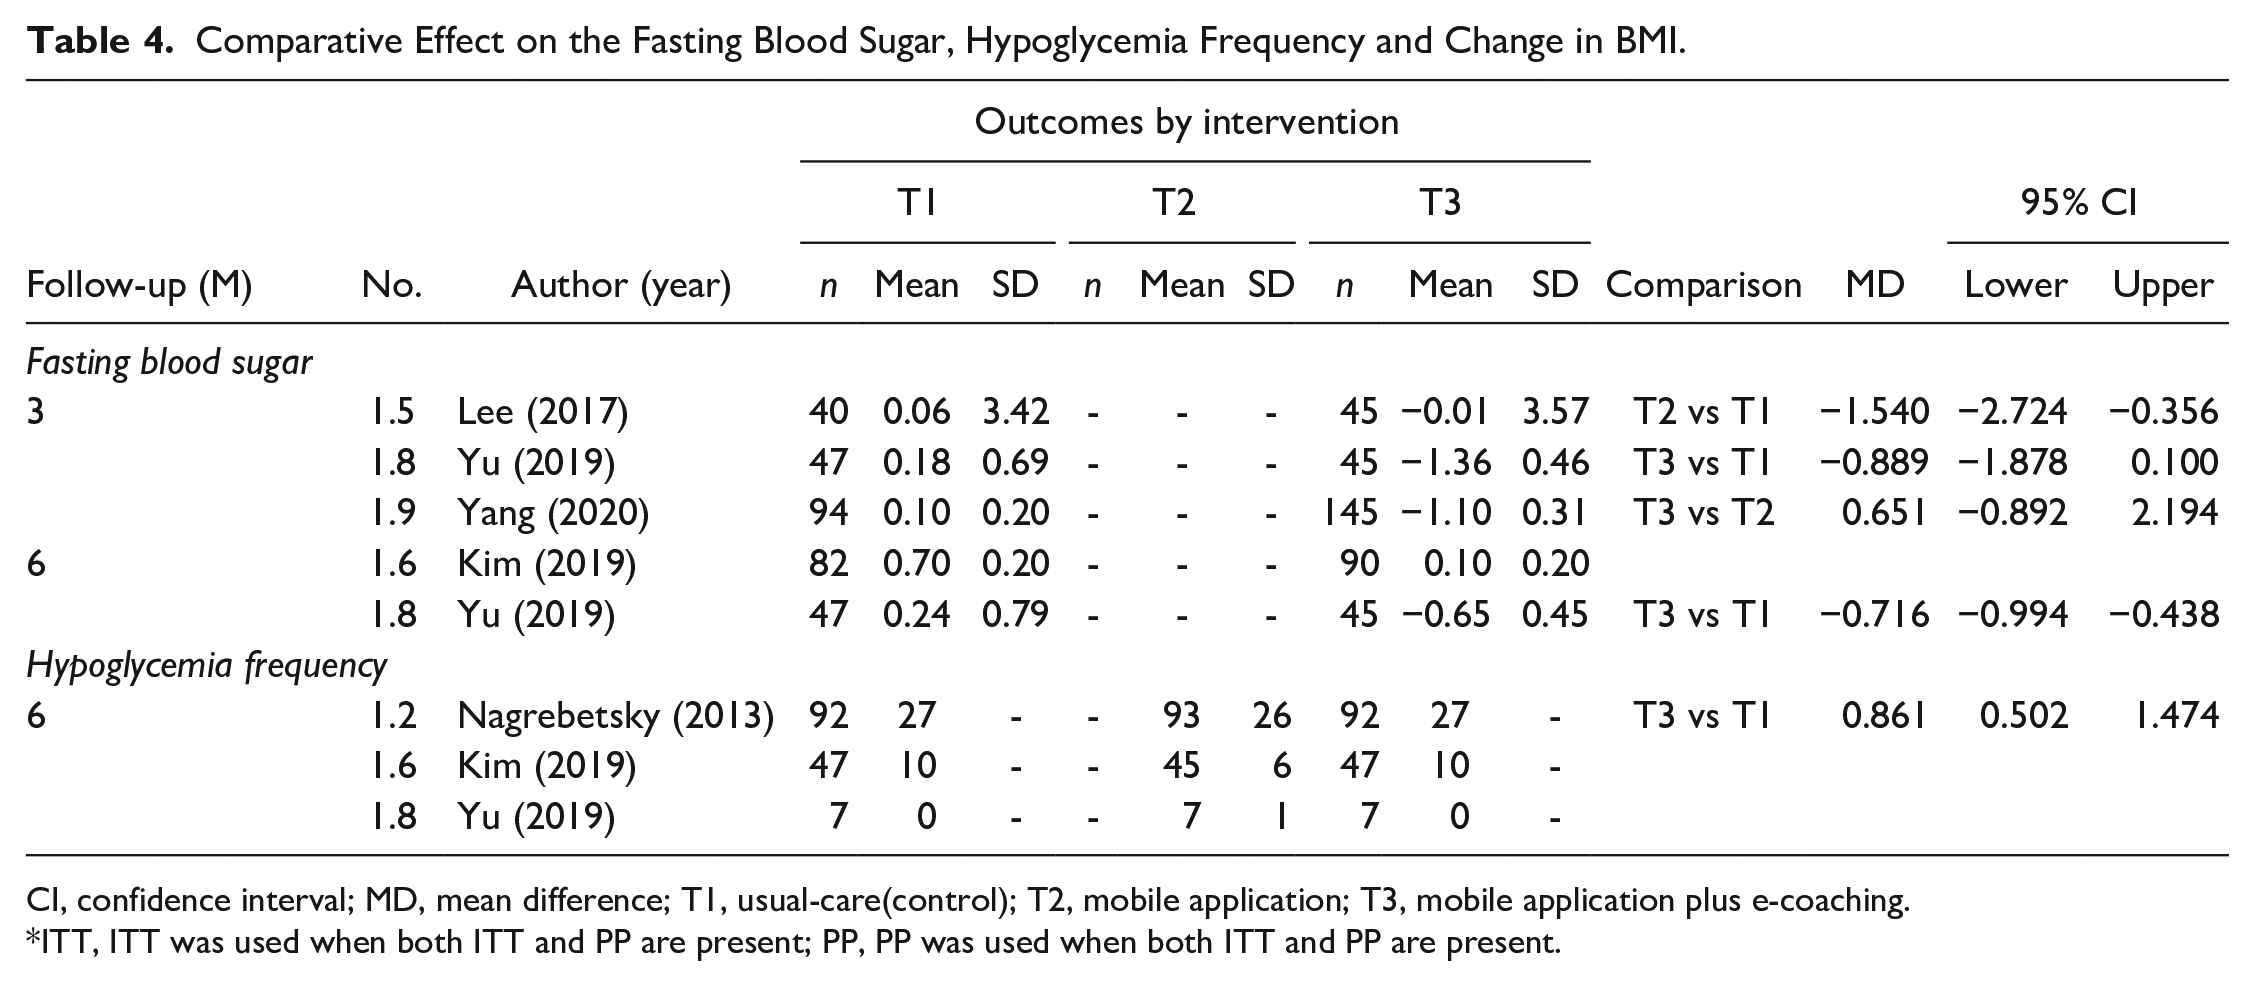
CI, confidence interval; MD, mean difference; T1, usual-care(control); T2, mobile application; T3, mobile application plus e-coaching.
ITT, ITT was used when both ITT and PP are present; PP, PP was used when both ITT and PP are present.
An analysis of 3 studies reporting the outcome of a 3-month follow-up period showed significant difference between the interventions in terms of the FBS reduction, and a comparison of the P-score revealed the T3 intervention to be the best (P-score = 0.96) (Figure 3a). On the other hand, in the subgroup analysis of heterogeneous gender ratio groups performed due to heterogeneity (I 2 = 79.1%, Q = 9.57, P-value = .0084), there was no significant difference between the interventions for FBS reduction. A comparison of the P-scores revealed the T3 intervention to be the best for FBS reduction (P-score = 1.00), and there was no heterogeneity (I2 = 54.8%, Q = 2.21, P-value = .1368) that could be interpreted as the final meta-analysis result (Figure 3b).
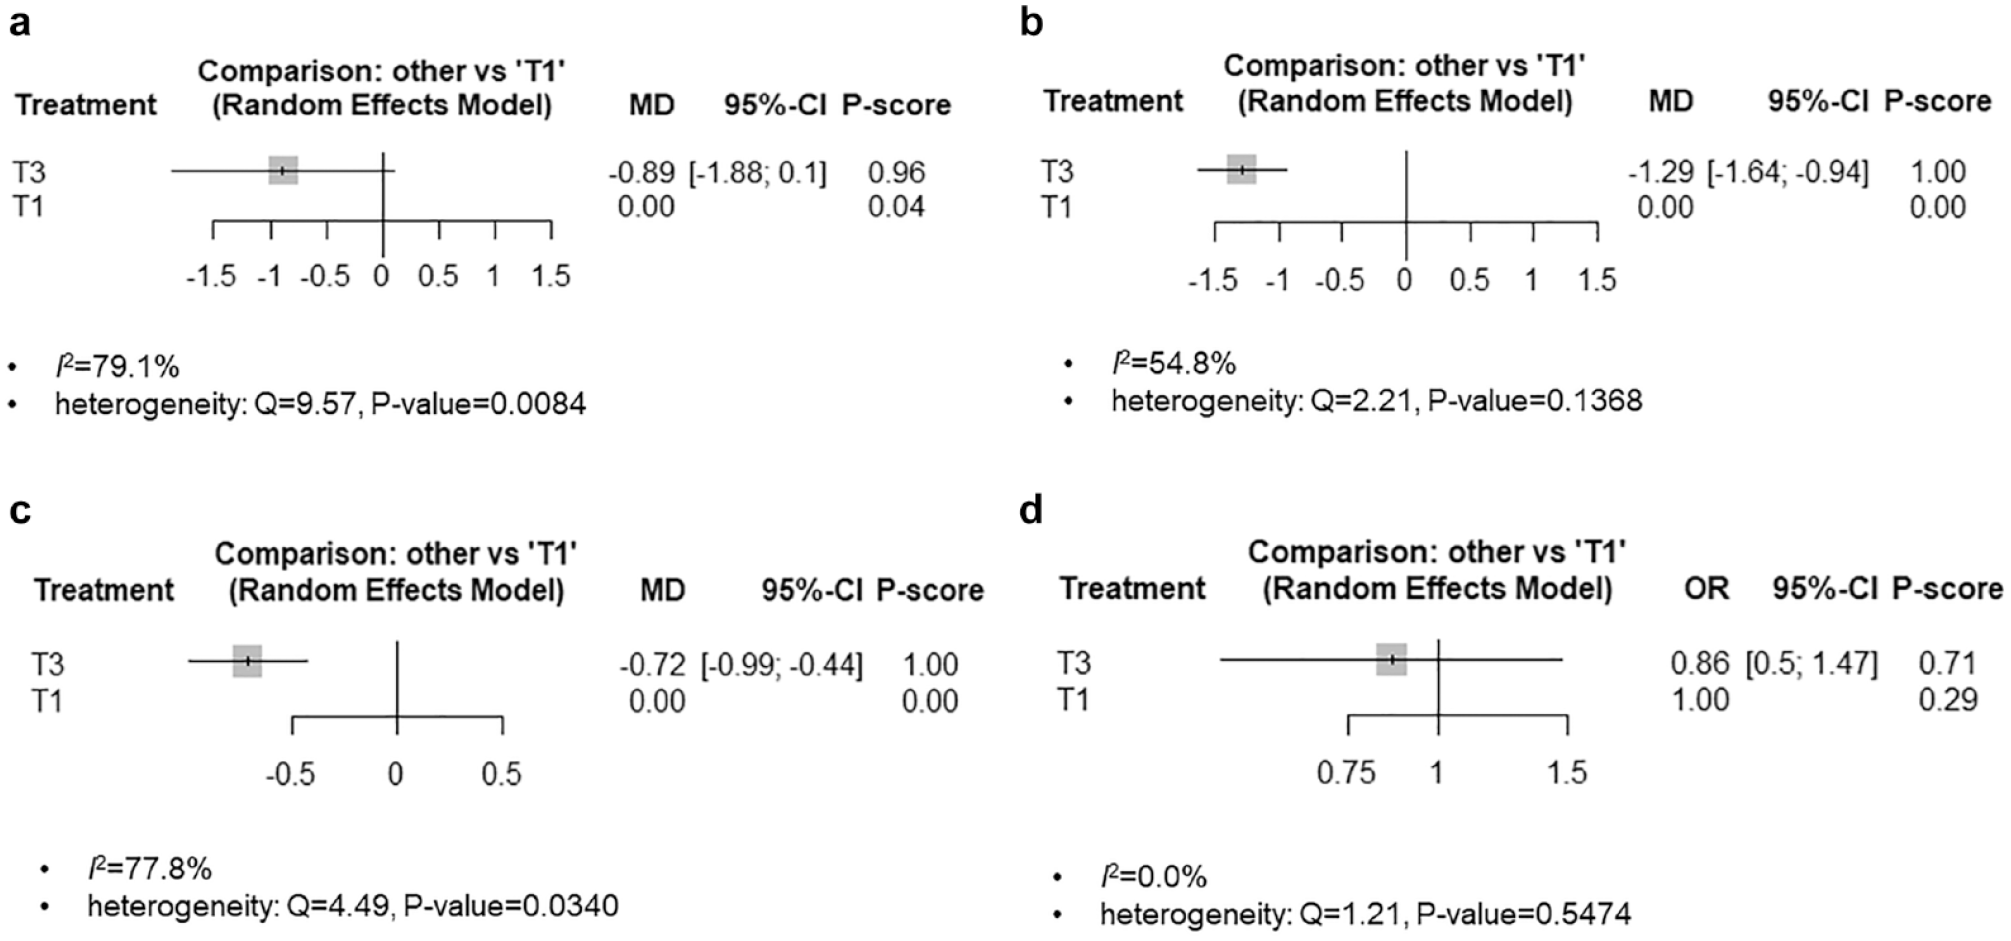
Network forest plot of fasting blood sugar and hypoglycemia frequency. (a) FBS (3 months) (b) FBS, heterogeneous gender ratio (3 months) (c) FBS (6 months) (d) hypoglycemia frequency (6 months).
An analysis of the 2 studies reporting the outcome of the 6-month follow-up period showed a significant difference between interventions in FBS reduction, and the P-score comparison revealed the T3 intervention to be the best (P-score = 1.00). However, heterogeneity existed. (I2 = 77.8%, Q = 4.49, P-value = .0340) (Figure 3c).
Hypoglycemia Frequency
An analysis of 3 studies reporting the outcome of the 6-month follow-up period showed no statistically significant difference between the interventions in terms of the hypoglycemia frequency, but a comparison of the P-score showed that the T3 intervention was the best (P-score = 0.71). In addition, there was no heterogeneity (I2 = 0%, Q = 1.21, P-value = .5474) (Table 4, Figure 3d).
Risk of Bias
The quality of the 14 selected RCT was assessed using RoB 2. The overall risk of bias was low in 57% (8/14), with some concerns in 36% (5/14). Domain1, the risk of bias arising from the randomization process, showed some concern in 21% (3/14). Domain 5, the risk of bias in the selection of the reported result, revealed some concern in 29% (4 /14) (Figure 4).
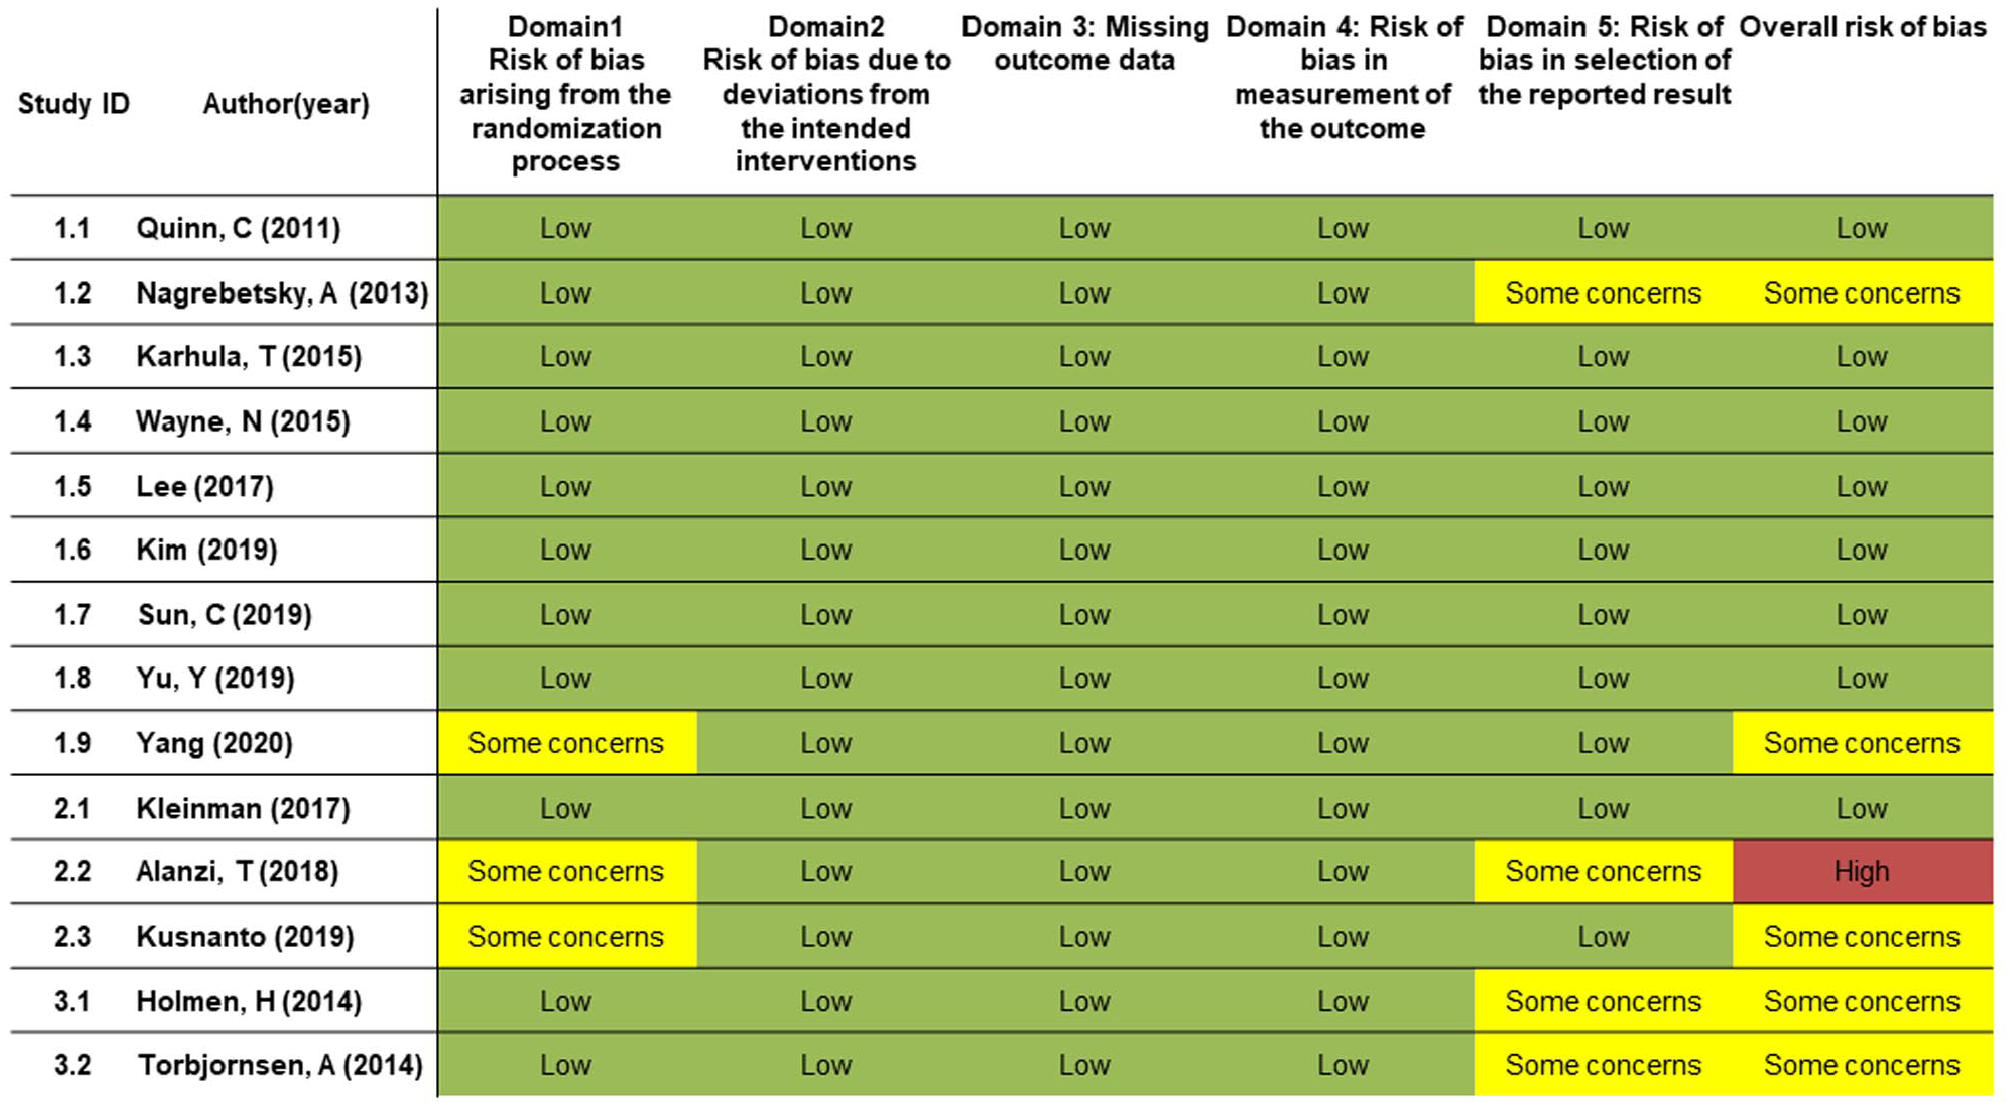
Risk of bias assessment summary (RoB 2.0).
Discussion
Wearables or portable devices and smartphones provide patients with timely health information, particularly personalized advice, and by medical professionals to encourage healthy behavior. 17 In addition, the use of new apps with digital health software and sensors for DM management is spreading rapidly. 17 The effectiveness of SMBG with or without additional tools was consistent in some previous studies.18,19 In addition, in previous SRs, the mobile app had a significant effect on the management of HbA1c in DM patients, but some SRs concluded that the function of the health care professionals was important for the apps to exert their effects.9,20-24 The present study compared the effectiveness of usual care with that of an app with or without e-coaching interventions in patients with T2DM management using MTC methodology. An analysis, according to the follow-up period, showed that apps with or without e-coaching interventions were more effective treatments for reducing the HbA1c values, FBS, and hypoglycemia frequency than usual care. On the other hand, there was insufficient evidence to conclude that either an app or an app with e-coaching is definitively superior in this MTC analysis. In a previous SR, although personal health coaching programs were effective in improving glycemic control, they argued that further studies on the specific program components, training, and supervision approaches would be needed. 25 The possible causes of the research findings are as follows. The apps might not function optimally due to incomplete development. One systematic review examined the developmental considerations of mobile apps for diabetes self-management. All the developed apps had the SMBG function, but some did not consider behavioral health theory, user involvement, the involvement of clinical experts, data analytics, education, and reminder functions. 26 Therefore, there may be qualitative differences between apps that support SMBG for DM patients. Furthermore, a study analyzing the critical management functions, such as decision support and alerts for SMBG in T2DM in 2019, claimed that quality assurance mechanisms, such as certification, are needed because some problems with apps may have missed opportunities to improve the treatment and health outcomes. 27
The other was the heterogeneity and non-standardization of the e-coaching method. There also appears to be an issue about whether e-coaching involving healthcare professionals does not have overwhelming superiority over several functions automatically notified by apps and portals. In the RCTs included in this study, there were differences between studies on who coached, how they coached, and how often they coached. Moreover, it appears that these differences did not properly reflect the role of e-coaching. In other words, e-coaching guidelines, such as the type of application, coaching method, and frequency, will be needed to measure the effectiveness of e-coaching accurately. Accordingly, in 2020, the ADA newly announced the operation of the Certified Diabetes Care and Education Specialist (CDCES)’ through consensus with experts, such as clinicians, nutritionists, nurses, and pharmacists, and stated that in the future, experts who have CDCES would be active in the fields of T2DM management, prediabetes, and diabetes prevention. 28
In addition, some reports raised privacy issues while discussing whether the apps comply with essential data protection principles. 29 Despite these multiple environments and some limitations to web- and mobile phone-based diabetes management or plus e-coaching by healthcare professionals, the scope of digital health, including artificial intelligence and deep learning, is expanding into the diagnosis of diabetes, glucose management, and diagnosis and management of diabetes-related complications.30-34
This study had some limitations. It was impossible to conduct an analysis that considers the diversity in mobile app types and e-coaching methods due to the limited number of studies included. However, several studies are being conducted in this field. Eventually, the limitations will be overcome, and the most preferential diabetes management method will be derived.
Conclusions
According to the MTC analysis using the data from published RCT, mobile apps or apps with e-coaching for T2DM management are more effective in reducing the HbA1c values, FBS, and hypoglycemia frequency than usual care in a 3- or 6-month follow up period. On the other hand, further research will be needed to clarify the difference between adding e-coaching to the app and its long-term effectiveness.
Supplemental Material
sj-pdf-1-dst-10.1177_19322968211010153 – Supplemental material for Improving Glycemic Control in Type 2 Diabetes Using Mobile Applications and e-Coaching: A Mixed Treatment Comparison Network Meta-Analysis
Supplemental material, sj-pdf-1-dst-10.1177_19322968211010153 for Improving Glycemic Control in Type 2 Diabetes Using Mobile Applications and e-Coaching: A Mixed Treatment Comparison Network Meta-Analysis by Min Kyung Hyun, Jang Won Lee, Seung-Hyun Ko and Jin Seub Hwang in Journal of Diabetes Science and Technology
Footnotes
Abbreviations
AMA, American Diabetes Association; App, application; CI, confidence interval; DM, diabetes mellitus; FBS, fasting blood sugar; HbA1c, glycated hemoglobin; IT, information technology; ITT, intention to treat; MD, mean difference; MTC, mixed treatment comparison; NMA, network meta-analysis; OR, odds ratio; PP, per-protocol; QOL, quality of life; RCTs, randomized controlled trials; RoB 2, risk-of-bias in randomized trials; SD, Standard deviation; SMBG, self-monitoring of the blood glucose; SR, systematic review; T2DM, type 2 diabetes mellitus; T1, usual care; T2, app (that is, care using an app to perform SMBG on a mobile phone or device); T3, app plus e-coaching (that is, care using an app and managed with additional e-coaching from healthcare providers).
Ethics approval and consent to participate
This study was approved by the Institutional Review Board of Dongguk University, Gyeongju (DGU IRB 20190025-02).
Declaration of Conflicting Interests
The author(s) declared no potential conflicts of interest with respect to the research, authorship, and/or publication of this article.
Funding
The author(s) disclosed receipt of the following financial support for the research, authorship, and/or publication of this article: This research was supported by a grant of the Korea Health Technology R&D Project through the Korea Health Industry Development Institute (KHIDI), funded by the Ministry of Health & Welfare, Republic of Korea (No. HI19C0784)
Supplemental Material
Supplemental material for this article is available online.
References
Supplementary Material
Please find the following supplemental material available below.
For Open Access articles published under a Creative Commons License, all supplemental material carries the same license as the article it is associated with.
For non-Open Access articles published, all supplemental material carries a non-exclusive license, and permission requests for re-use of supplemental material or any part of supplemental material shall be sent directly to the copyright owner as specified in the copyright notice associated with the article.