
Abstract
Objective:
To adjust for dynamic insulin requirements in critically ill patients, intravenous (IV) insulin infusions allow for titration of the dose according to a prespecified algorithm. Despite the adaptability of IV insulin protocols, human involvement in dose calculation allows for error. We integrated a previously validated IV insulin calculator into our electronic health record (Epic) and instituted it in the cardiovascular intensive care unit (CVICU). We aim to describe the design of the calculator, the implementation process, and evaluate the calculator’s impact.
Method:
Employing an aggressive training program and user acceptance testing prior to significant elbow support at the time of institution, we successfully integrated the insulin calculator in our CVICU. We evaluated the glucometrics before and after implementation as well as nursing satisfaction following calculator implementation.
Results:
Overall, our implementation led to increased frequency of blood sugar at various glycemic targets, a trend toward less hypoglycemia or hyperglycemia. For severe hypoglycemia, our preintervention cohort had 0.02% of blood sugars less than 40 mg/dL but no blood sugars less than 40 mg/dL were identified in our patient’s postintervention. For the CVICU target blood glucose of 70-180 mg/dL, 87.97% blood sugars at baseline met goal compared to 91.39% at one month, 91.24% at three months, and 90.87% at six months postintervention.
Conclusion:
By utilizing an aggressive education campaign championing superusers and making adjustments to the calculator based on early problems that were encountered, we were able to improve glycemic control and limit glucose variability at our institution.
Keywords
Introduction
Glucose control in intensive care units is now standard of care. In a landmark study performed by Van Den Berghe et al, 1 the importance of glycemic control was illustrated by a significant decrease in mortality for postsurgical patients with a blood glucose (BG) target of 80-110 mg/dL compared to standard of care. While controlling BG was clearly shown to improve outcomes, the utility of tight versus moderate control was questioned. This led to another landmark trial. The NICE-SUGAR trial, which showed improved outcomes with a less stringent target of 140-180 mg/dL compared to a tighter target of 80-110 mg/dL. 2 Combined, these two studies demonstrated the importance of glycemic control in the inpatient setting while avoiding hypoglycemia. Further studies identified the importance of glycemic control in the perioperative period surrounding cardiovascular surgery. 3 To adjust for dynamic insulin requirements in critically ill patients, intravenous (IV) insulin infusions allow for titration of the dose according to a prespecified algorithm. This adaptability makes IV insulin the preferred modality for controlling blood sugars in this setting. 4
Despite the adaptability of IV insulin protocols, human involvement in dose calculation allows for significant opportunity for error. In a study conducted in the critical care setting, computerization of the insulin protocol resulted in a significant decrease in the frequency of dosing errors. 5 The evolution of IV insulin calculators can be directly traced to the formula derived by Dr White et al published in 1982. In evaluating a pediatric population overnight, White et al 6 identified a linear regression with an intercept of 60 and a coefficient of 0.02 that was able to closely approximate insulin requirements. Dr. White’s equation is expressed by (BG − 60) × 0.02 = insulin dose/hour. Expanding on the work performed by Dr White, the Davidson et al group noted that 14% of patients were able to maintain glycemic control with a coefficient of 0.02. 7 The varying requirements were attributed to variability in endogenous insulin resistance, stress, and other patient-specific factors. To adjust for this, Davidson et al developed a proprietary algorithm to adjust the insulin infusion rate as changes in insulin requirements occur. Since 2005, a multitude of calculators based on the original equation were developed, both commercially and institution specific. These calculators have been studied and validated in multiple studies that demonstrated improvement in glycemic control. 8
The historical paper-based algorithm used at our institution for titration of IV insulin was not based on this algorithm, but rather on the current glucose and rate of change from the previous check. This calculation was nurse-driven and, although glucose control in our ICUs was very reasonable, the process was fraught with missed glucose checks, calculation errors, and variation from calculated doses, which was not kindly viewed by the Joint Commission. This prompted the institution to consider transitioning to a computer-based dosing algorithm. Balancing the pros and cons of commercially available versus home-grown approaches, with particular attention to the initial and ongoing costs associated with commercial calculators, a decision was made to build an integrated computer-based algorithm using tools readily available within the electronic health record (EHR). We collaborated with another institution that had successfully implemented a similar algorithm as a stand-alone tool outside the EHR. 9 Armed with the shared learnings, we integrated the calculator into our EHR (Epic), instituted it in the cardiovascular intensive care unit (CVICU), and customized the clinical workflow based on our institution-specific practices. We aim to describe the design of the calculator, the implementation process, best practices, and evaluate its impact. Our goal is to contribute to filling the knowledge gap for institutions considering a transition from paper-based to computer-based algorithms.
Methods
A multidisciplinary effort by many stakeholders contributed to the design, development, and implementation of the IV insulin calculator at the University of Michigan Hospital. Specialties and departments involved included Endocrinology, Critical Care, Hospitalist Service, Nursing, Pharmacy, Clinical Informatics, Nursing Informatics, and Information Technology (Figure 1).
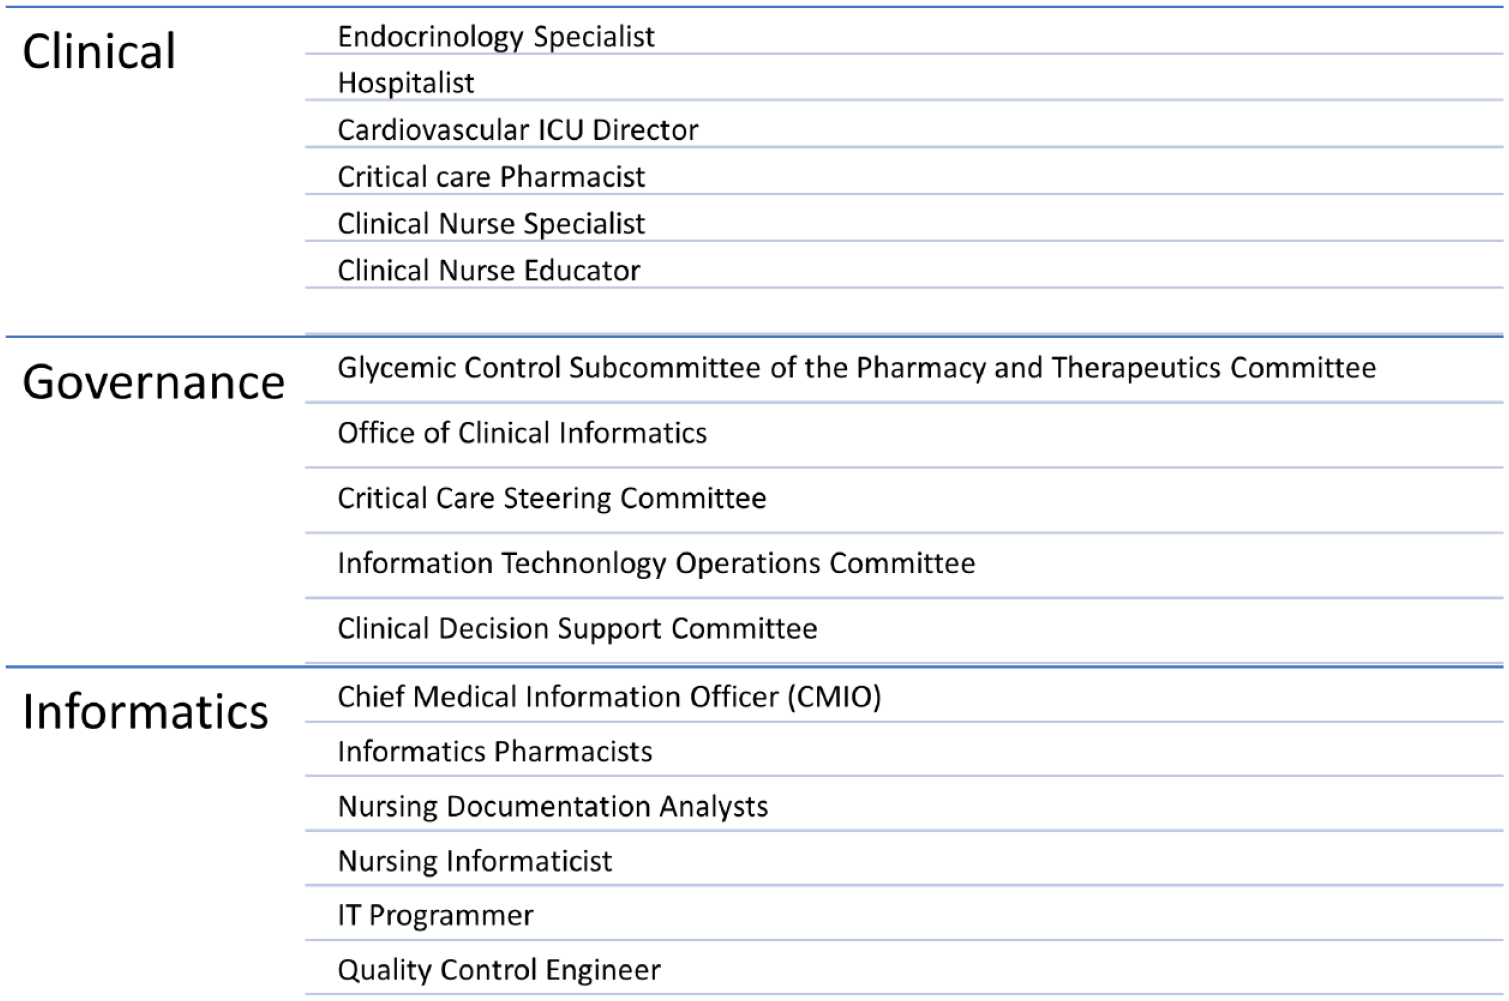
Types of multidisciplinary organizational stakeholders involved in the development and implementation of the intravenous insulin calculator.
After consulting with the partnering organization (University of California, San Diego), and taking into consideration our institution-specific practices and workflow, our development team designed a revised algorithm process and continued our target BG range of 110-150 mg/dL for the overall insulin rate titration logic (Figure 2).
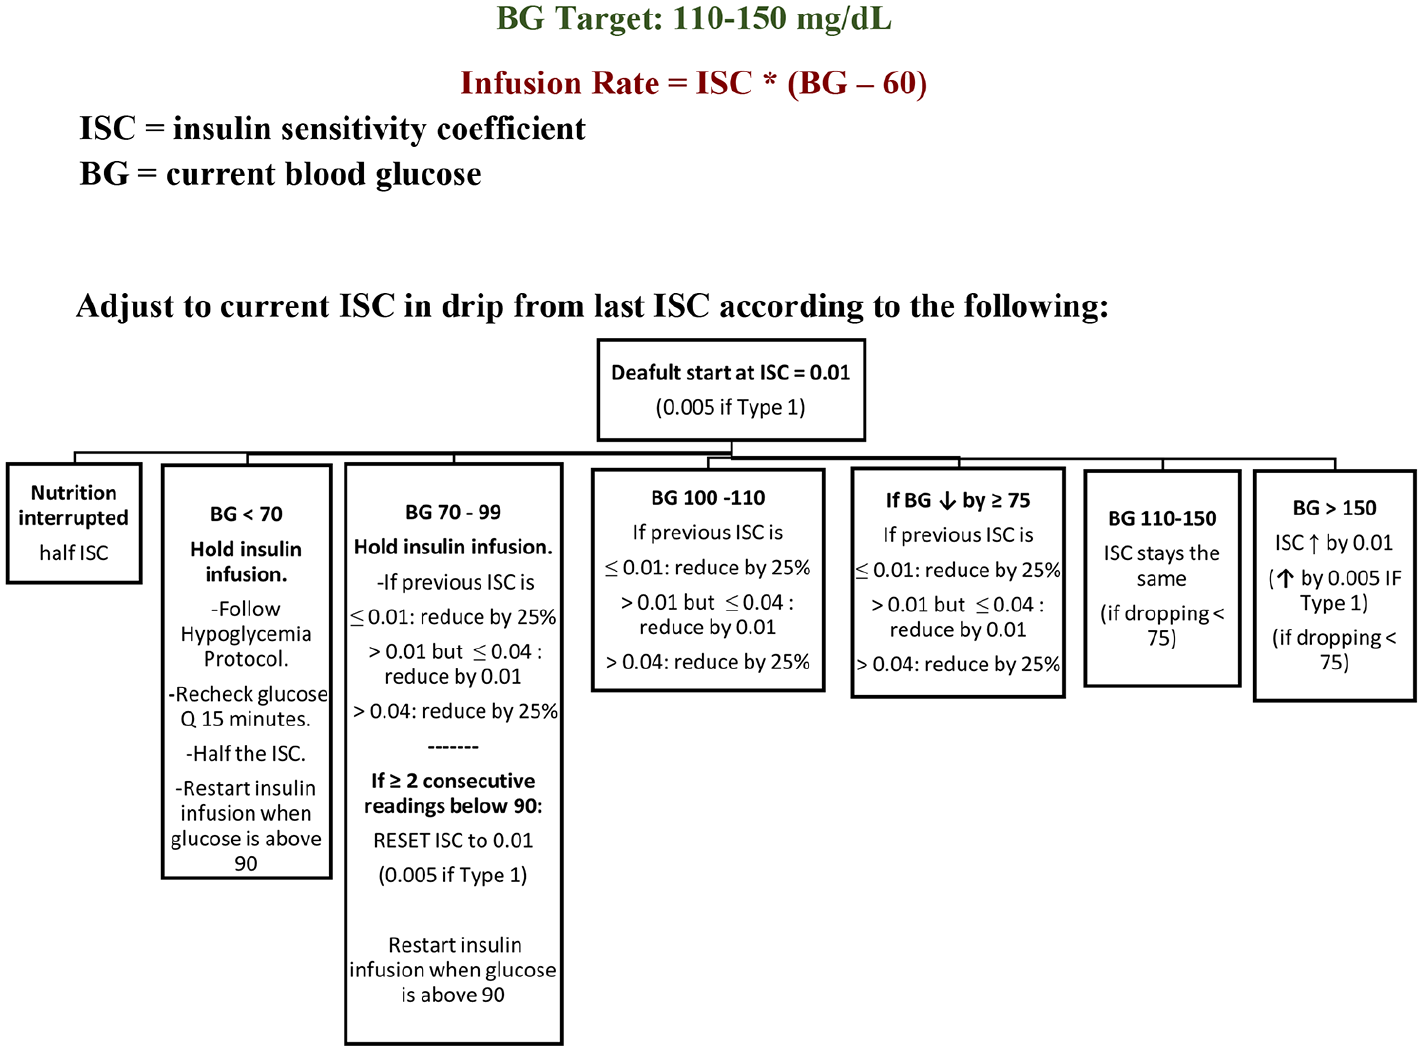
Overall logic for insulin rate titration.
The IV insulin calculator was completely integrated within the EHR. A provider places an order for the insulin infusion with the linked rate calculator using the Computerized Physician Order Entry interface. Ordering providers were educated on the new orders via superuser training. Frequently used order sets were updated to incorporate the insulin calculator. Providers were encouraged to contact the endocrinology team on call with any ordering difficulty or questions. To ensure patients receive the appropriate orders, the insulin infusion orders were included in all cardiac surgery postoperative order sets and also available in a stand-alone order set used for ordering IV insulin infusions in adult patients. Two order templates were created, a standard one for type 2 diabetes mellitus (DM) and stress hyperglycemia with an initial default insulin sensitivity coefficient (ISC) of 0.01 and a separate order template for type 1 DM and for patients with high insulin sensitivity (including those with chronic kidney disease) with an initial default ISC of 0.005. The type 1 order set included instructions to choose the type 1 calculator if the patient had chronic kidney disease. Within the ordering window, providers can accept the default insulin sensitivity settings within the order or choose to override the ISC (Figure 3). If an override to the standard settings is needed, providers must obtain approval from Endocrinology and are presented with a limited list of ISC values to choose from to mitigate the risk of making an entry error if free text ISC entry were to be allowed. This did not require a formal consult and was rarely utilized. To limit glucose excursions, meal coverage for patients taking in nutrition by mouth is provided by subcutaneous insulin lispro.
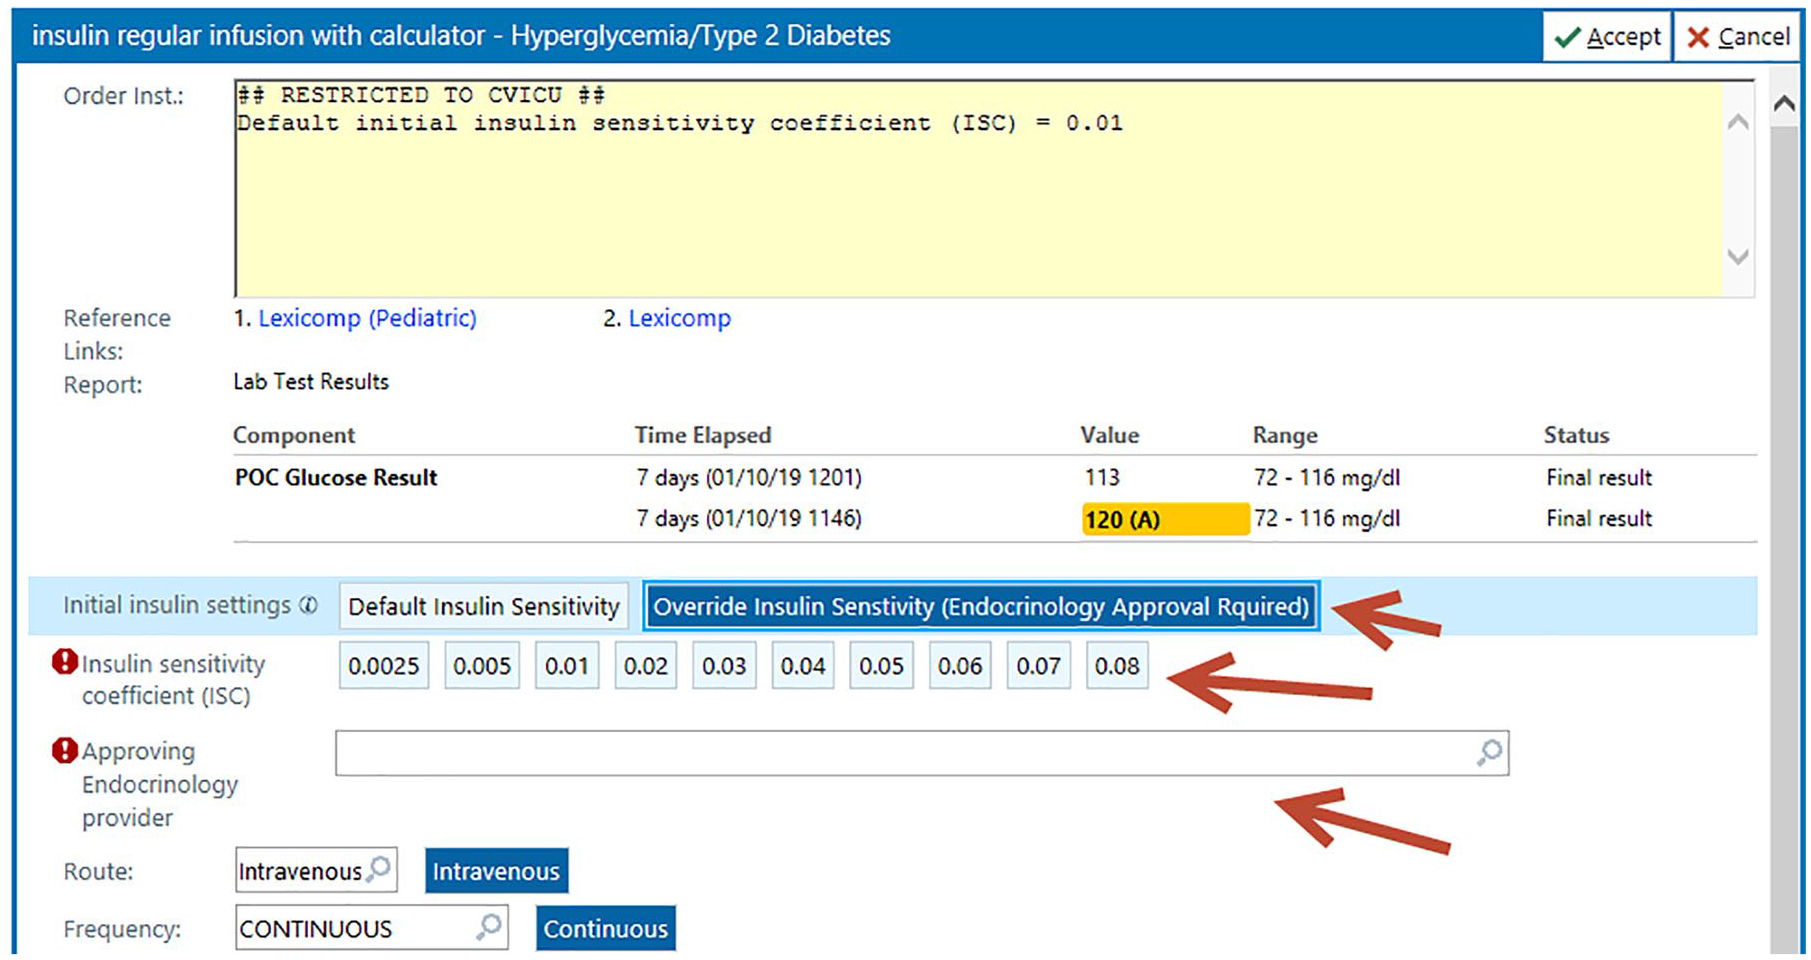
Calculator-linked insulin infusion ordering window 2020 Epic Systems Corporation.
Once an active order is placed, the electronic Medication Administration Record (eMAR) displays the order details in addition to an embedded nurse-driven insulin rate calculator (Figure 4). For postoperative surgery patients, nurses initiated the insulin infusion per the ICU protocol only in patients who get two consecutive BG results above 150 mg/dL or one BG result above 200 mg/dL. Nurses obtain a BG result according to the protocol and manually enter it twice into the calculator window on the eMAR and indicate if the patient’s nutrition has decreased since the last documentation entry. The calculator displays the new recommended insulin rate, the due time for obtaining the next BG result, and any additional warning messages. A task is automatically created in the nursing worklist along with the next BG due time as a reminder to increase adherence to BG timing. The task list is frequently checked by nursing and is a steady part of their workflow but no overt alarm is triggered to remind the nurse to check blood sugars. Float nurses that had not previously been educated on the insulin infusion calculator are provided just in time orientation at the point of care. This education consists of tip sheet review, access to the practice environment, and utilization of the calculator in real time. Information is provided by a staff nurse superuser or the charge nurse. Tip sheets are readily available to both regular and float staff. If additional questions arise, the hyperglycemia team of advanced practice providers and physicians remains accessible via pager 24 hours a day and 7 days a week.
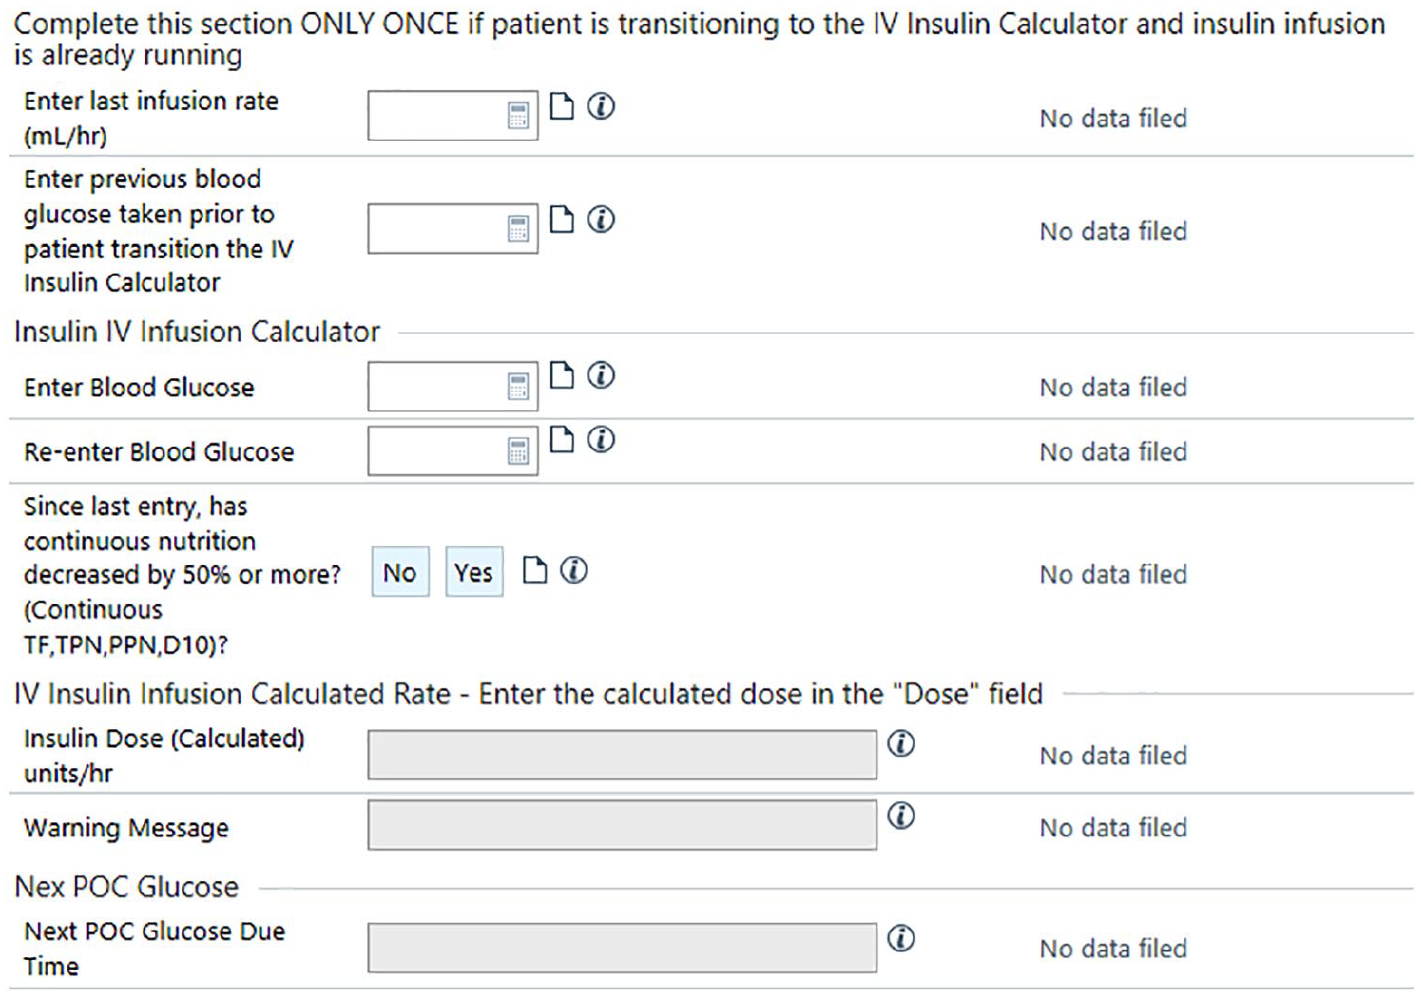
Insulin infusion calculator embedded within the electronic medication administration record © 2020 Epic Systems Corporation.
A phased implementation approach was planned with an initial pilot in our 30-bed CVICU. This ICU uses over 5-10 insulin drips a day and the nurses are very well trained in titrating the paper algorithm. The traditional algorithm continued to be used outside CVICU during the pilot duration creating a need to address IV insulin order reconciliation upon transfer of patients. A clinical decision support (CDS) rule was created to automatically discontinue the calculator-linked IV insulin order upon transfer of patients outside CVICU and a passive CDS alert was configured to display to the provider reconciling the patient transfer orders to notify them of the auto-discontinuation. Ordering providers were educated in advance of the implementation. The operating room (OR) at our institution uses a separate software system for intraoperative documentation (Centricity) creating another challenge for patients who start the traditional IV insulin order in the OR before transferring into CVICU. A new section was added to the calculator for use only once upon patient transfer from the OR by the receiving CVICU nurse to back-calculate the ISC from the running IV insulin rate and the most recent BG result.
The algorithm we used relies on the consistent entry of BG results in timely order. A safety issue may arise if a patient temporarily leaves the room for a procedure and insulin infusion is held and documentation of BG results and insulin rate is missed for an extended period of time. To address this safety issue, we configured the calculator to reset to the initial ISC if no documentation occurs for four hours or longer. Another timing issue could occur if more than one BG result is entered within a short period of time leading to erroneously increasing the calculated ISC and insulin rate. To address the multiple BG results issue, we configured the calculator to only allow one rate increase within a 15-minute period.
The EHR system at our institution undergoes a scheduled software upgrade process at least twice a year where the system becomes a read-only system. There is also a remote possibility that the EHR system undergoes an unscheduled downtime where it becomes completely unavailable leading to the use of dedicated workstations for business continuity (BCA). To avoid interruption of patient care during downtime, a spreadsheet version of the calculator using Excel was created and made available in the institution’s downtime webpage. In addition, a downtime IV insulin calculator report was configured to be available within the BCA workstations.
Nursing Implementation and Evaluation Process
All of the 180 CVICU registered nurses (RNs) were provided 1:1 or small group orientation to the insulin infusion calculator by RN superusers. Simulation scenarios were made available in the EHR practice environment and utilized by the nursing staff for two months before implementation. In consultation with physicians and nursing, the information technology instructional designer developed a step-by-step guide for education, quick reference sheets, and frequently asked questions outlining how to use the calculator in the EHR and guidelines for documentation. Training included the affected patient population, when to start the infusion, clarification that titration increments may be smaller or larger than what nurses are accustomed to seeing (fractions of a unit), and the impact of the ISC on dosage. Additional education covered subcutaneous meal coverage, discontinuation of the calculator, and transfer procedures. While the patient is in the CVICU, only endocrinology team providers could transition the patient from the calculator to exclusively subcutaneous insulin and provided ongoing support.
The use of time settings within the EHR reminded the nurse of the next required check to increase compliance of the glucose checks. Additionally, informatics, clinical nurse educators, and nurse superusers remained available throughout the education and implementation phase. An online survey was distributed via Qualtrics to evaluate knowledge and acceptance of the new process by nursing staff.
Statistical Analysis
Baseline BG data three months before the EHR algorithm were implemented and one, three, and six months post EHR algorithm intervention were collected. A categorical variable of BG was created using the following ranges: BG less than 40, less than 54, less than 70, 110-150 (calculator target), 70-180, and greater than 250 mg/dL. These ranges were represented as a percentage of the total BG measurements taken ± the standard error of the mean. Data analyses were conducted using R version 3.62 (r-project.org). Nonparametric Wilcoxon rank-sum tests were used to evaluate BG ranges stratified by the following time points: before EHR algorithm implementation, and one month, three months, and six months after EHR algorithm implementation. Statistical significance was evaluated at α =0.05.
Results
In our assessment of pre- and postintervention, implementation of our insulin calculator trended toward lower rates of hypoglycemia with BGs less than 54 and 70 mg/dL, but did not meet statistical significance for this metric. For severe hypoglycemia, our preintervention cohort had 0.02% of blood sugars less than 40 mg/dL but no blood sugars less than 40 mg/dL were identified in our patients postintervention. The mean BG obtained in mg/dL was 141.57 at baseline, 136.01 at one month, 135.76 at three months, and 135.78 at six months (Table 1).
The Average Blood Glucose for Each of the Following Timepoints: Baseline, n = 20 688 Draws; 1-month Postintervention, n = 14 047 Draws; 3-month Postintervention, n = 24 213 Draws; 6-month Postintervention, n = 38,491 Draws.
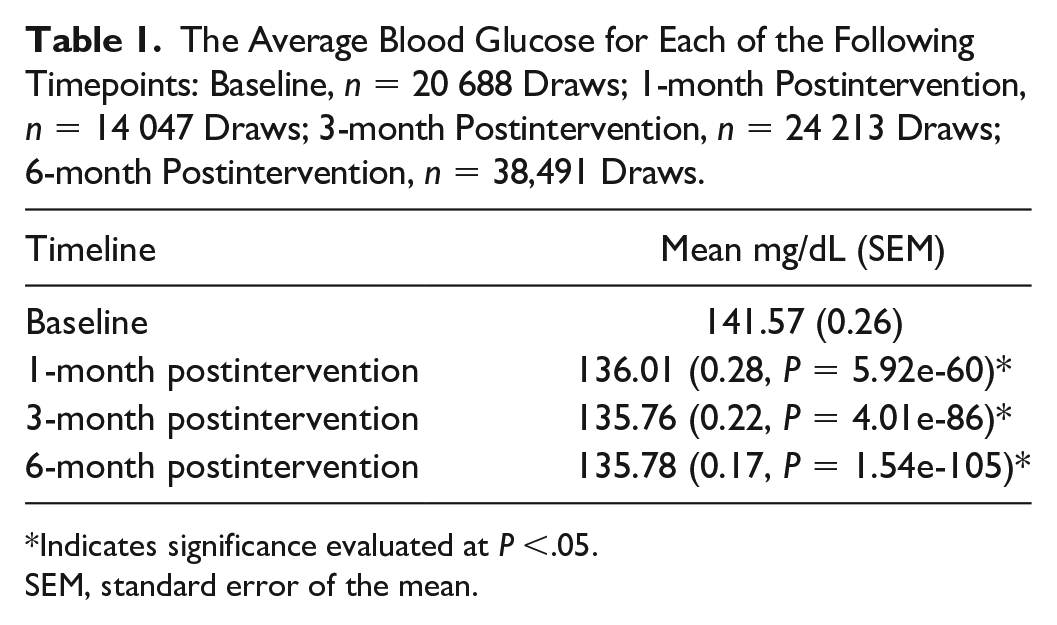
Indicates significance evaluated at P <.05.
SEM, standard error of the mean.
For the CVICU target BG of 110-150 mg/dL, 53.02% of blood sugars at baseline met goal compared to 59.96% at one month, 58.91% at three months, and 58.02% at six months after intervention (respectively standard error of the mean [SEM] = 3.95, P = 5.61e-7; SEM = 2.63, P = 7.80e-6; SEM = 1.77, P = 6.72e-5) (Figure 5).
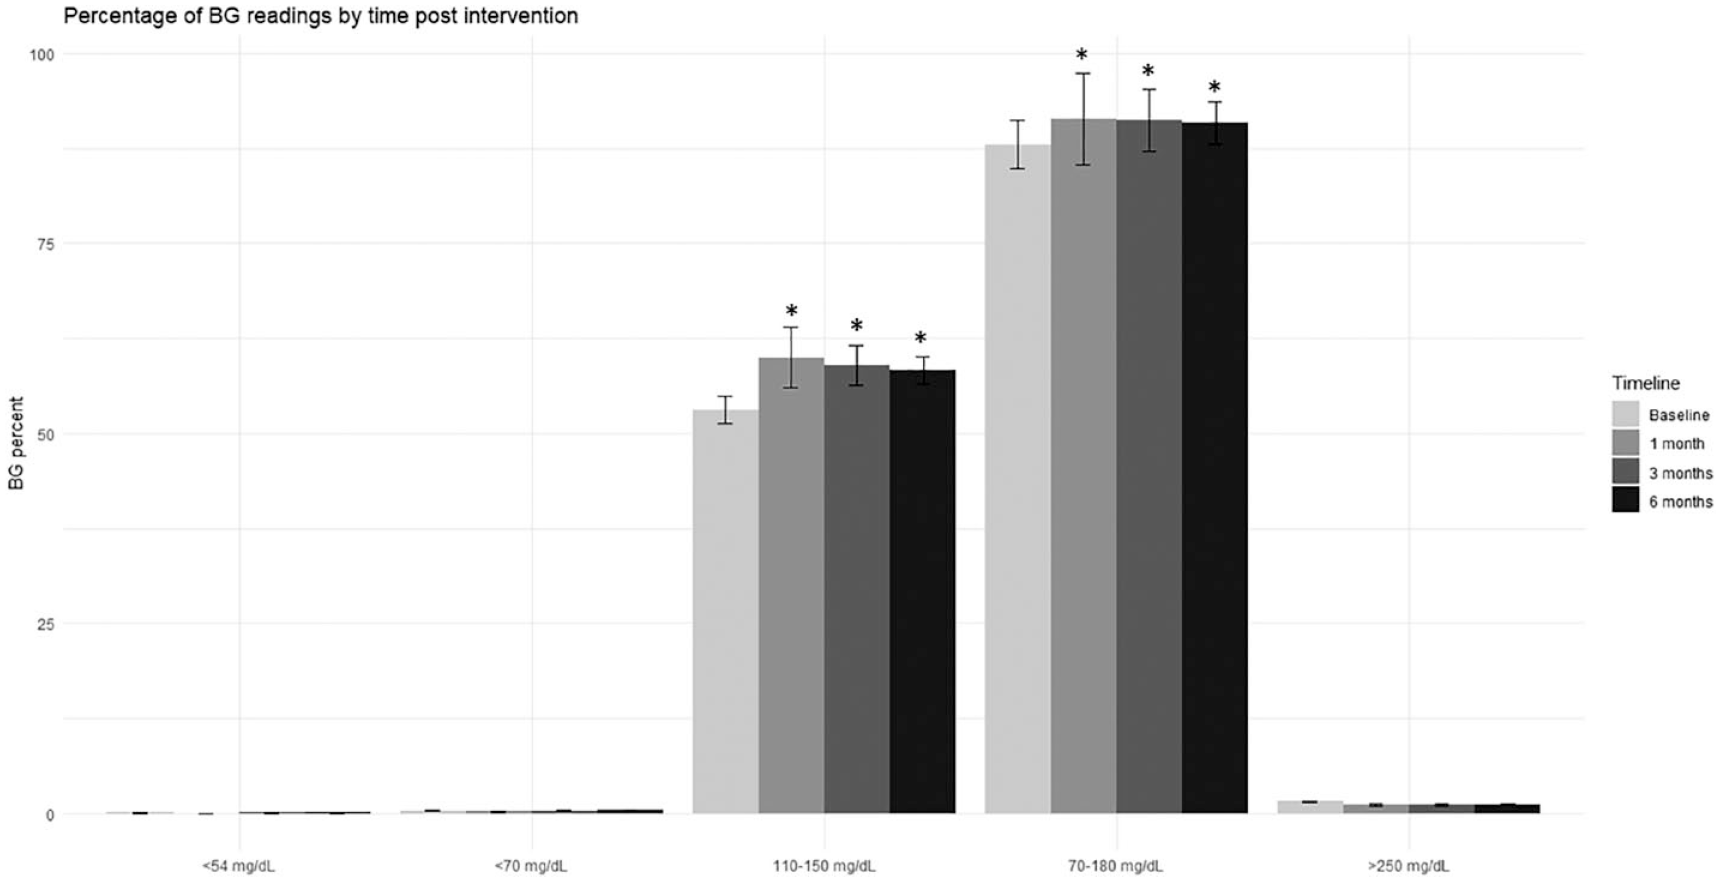
The total percentage of BG measurements in each category (<54 mg/dL, <70 mg/dL, 110-150 mg/dL, 70-180 mg/dL, and >250 mg/dL) for the following time points: baseline, n = 20 688 draws; one-month postintervention, n = 14 047 draws; three-month postintervention, n = 24 213 draws; six-month postintervention, n = 38 491 draws.
From a broader glycemic goal of 70-180 mg/dL, 87.97% of blood sugars were in the goal range before intervention and 91.39% (SEM = 5.99, P = 2.39e-7), 91.24% (SEM = 4.10, P = 4.93e-6), and 90.87% (SEM = 2.75, P = 4.3e-5) at one, three, and six months, respectively. This improvement was statistically significant (Figure 5).
We assessed the likelihood of any given BG reading having a value greater than 250 mg/dL (Figure 5). In our preintervention cohort, 1.52% of blood sugar readings were greater than 250 mg/dL. The percentage of BG that reached this criterion at one, three, and six months was 1.10%, 1.12%, and 1.13%, respectively. Although favorable postintervention, the findings did not meet criteria for statistical significance. The total number of patients in this range at each time point was also not statistically significant across any of the BG ranges (Figure 6).
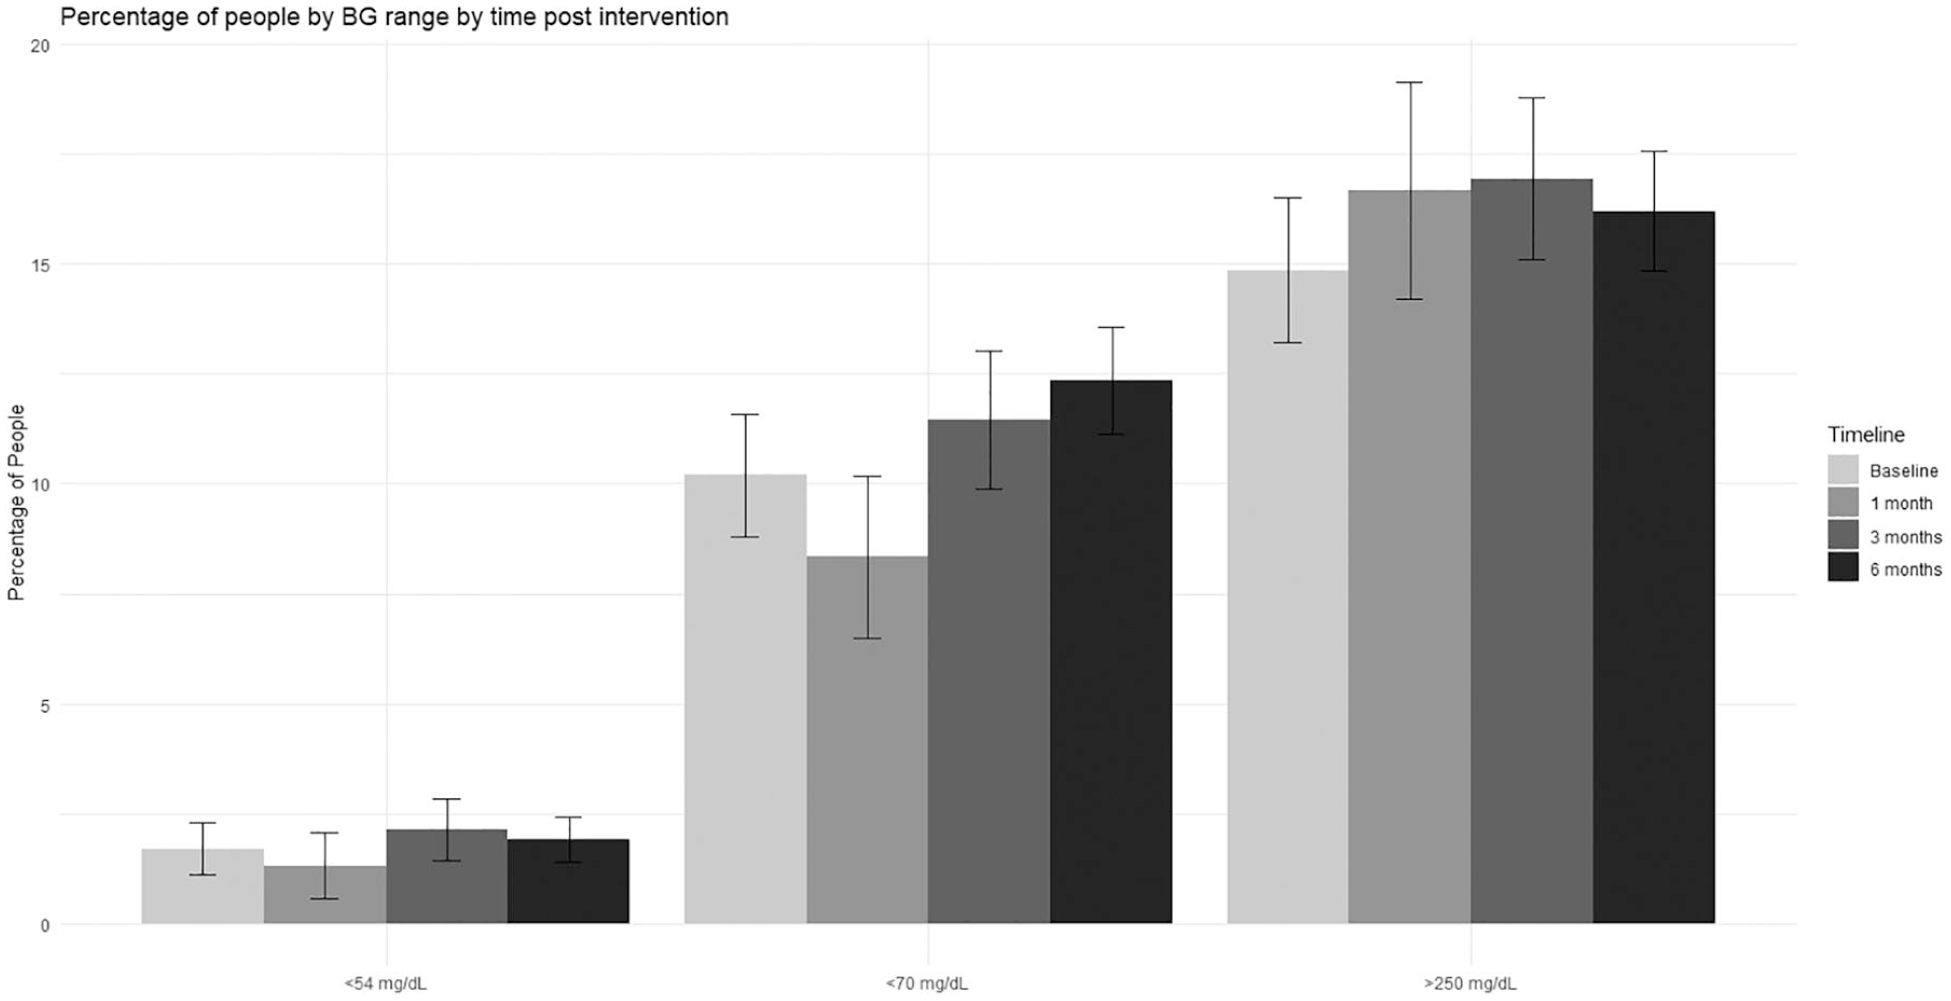
The total percentage of patients with a blood glucose in each category (<54 mg/dL, <70 mg/dL, and >250 mg/dL) for the following time points: baseline, n = 471 patients; one-month postintervention, n = 228 patients; three-month postintervention, n = 419 patients; six-month postintervention, n = 728 patients.
After three months of use, 79 RNs participated in a survey of the implementation and use. Seventy six percent of nurses in the CVICU agreed that the calculator was not difficult to interpret, 96% felt that the education was adequate, and 77% had a high level of confidence in the protocol. Some nurses expressed dissatisfaction with the increased workload, which is reflective of increased compliance with the time parameters of BG checks.
Discussion
Our institution successfully implemented an automated IV insulin calculator using functionalities available within its commercial EHR without need for purchasing a third-party software. We planned this move for several years, but the cost of commercial calculators for setup and ongoing use was prohibitive. The new calculator created a more standardized and transparent insulin dosing process while maintaining efficacy and safety. Partnering with another institution, which was working to integrate its longstanding calculator into their EMR, provided an opportunity for collaboration and sharing of knowledge and best practices.
With a goal of broad institutional implementation, our pilot study identified early areas for improvement while demonstrating both safety and efficacy. The first iteration of the calculator utilized absolute value increases and decreases in drip rate, which had the potential for rapid uptitration of the insulin drip rate. In order to combat this, within a week, we adjusted the algorithm to make percent-based calculations to limit the rapidity with which the drip rate would ramp up. In a study performed by Turchin et al, 10 one episode of hypoglycemia prolonged hospital stays by one day. We did not include data prior to the adjustment in the algorithm in our assessment of our intervention.
In comparing our calculator to prior published insulin calculator studies, we found that we had lower rates of hypoglycemia delineated by a blood sugar less than 40, 54, or 70 mg/dL. As described in other studies we had no documented blood sugars less than 40 mg/dL after the calculator intervention. Although we had low absolute rates of hypoglycemia even before the intervention, this still is a major improvement for our patients. When compared to alternative glucose calculators, which evaluated instances of blood sugars less than 70 mg/dL, our baseline (0.36%) and postintervention (0.21% one month, 0.36% three months, and 0.42% six months) incidence of hypoglycemia was lower than other published studies, one of which reports 1.44% preintervention and 0.51% postintervention 11 and another study reported 0.93% postintervention. 11 One precipitant for hypoglycemia we identified is when patients received a combination of IV dextrose and subcutaneous insulin for correction of hyperkalemia. This occurred outside of the auspices of our calculator and was a factor in several of the hypoglycemic episodes that we reviewed and therefore lowers the rate of hypoglycemia attributed to the calculator alone.
Our mean blood sugar values at baseline and at each interval (141.57, 136.01, 135.76, and 135.78 mg/dL) are appropriate for our institutional goal of 110-150 mg/dL. These are higher than values in alternative calculator studies, which report values of 123 12 and 117 mg/dL. 13
In evaluating target blood sugars, our postintervention cohorts demonstrated superior performance relative to our baseline cohort with over 90% of values in the 70-180 mg/dL range, which is the acceptable range for overall control. In comparison to other calculator studies, the rate was slightly lower than the rates observed in other studies within the same goal (93.3%). 12 Improvement occurred at each target blood sugar that we evaluated.
Avoidance of hypoglycemia and maintenance of blood sugar in specific goal ranges were important metrics to evaluate; however, we did not want the lower rate of hypoglycemia to be solely attributable to patients being maintained at a higher blood sugar. In limiting the IV insulin protocols to two malleable options predicated on baseline insulin resistance, we hope to prevent error in order entry and execution. With our implementation, the dosing of IV insulin is mathematically derived and obviates any potential concern regarding nursing scope of practice and dose titration.
Our study has some unavoidable limitations. Randomization to our prior paper protocol or the glucose calculator would provide clearer insight on the impact of our intervention. Due to the technical and institutional investment, as well as the support required for our implementation, a prospective randomized evaluation was not feasible. Increased oversight immediately following implementation of our calculator and some error due to unfamiliarity with the calculator may limit the validity of our results. We hope that the algorithm change that led to us excluding our first month of data attenuated the impacts that these factors had on our metrics. Our study included several hundreds of patients and we did not have demographic and other health-related data but evaluated only the glucometric aspect of the calculator. We do know that about 30%-35% of our CVICU cohort has known diabetes. We also could not separate the patients with type 1 or type 2 diabetes but, by chart review, know that the low sensitivity algorithm performs well for those with type 1 diabetes or significant insulin sensitivity as with end-stage renal disease. We also did not assess the time saved in nursing calculations but a previous study demonstrated time saving associated with implementation of an insulin calculator. 14 Implementing changes in workflow, requiring glucose checks at specified times and removing clinical input in dosing led to a certain degree of inherent resistance initially. With continued use of the calculator and gaining comfort in the predictability and functionality, nurses are very appreciative of this change. We have not had the opportunity to reassess nursing opinions but informal feedback is regularly solicited.
While we hope our experience provides some framework for other institutions to implement a similar glucose management system, it is important to note that institutional support, investment, and ability are not uniform across all health systems.
Conclusion
An institutional EMR-based IV insulin calculator was built in collaboration with another academic institution and led to an overall trend toward improvement in hyperglycemia at various cutoff values, with elimination of glucose values less than 40 mg/dL. Nursing feedback indicated mostly a favorable response to the implementation and confidence in the calculator has increased with its continued usage. We believe this promotes patient safety and will continue to evaluate important patient outcomes with broader use of the calculator beyond the CVICU.
In detailing the process for a safe and efficacious implementation of a home-built standardized IV insulin calculator, we hope to provide a framework for other institutions to emulate as insulin dosing calculators become the standard of care.
Footnotes
Acknowledgements
We would like to thank Dr Kristin Kulasa. Kevin Box and Michael Nies and the insulin calculator team at University of California, San Diego for their help and support with our calculator build and set up. We also acknowledge the hard work of all the Michigan Medicine supersusers who made this change possible.
Declaration of Conflicting Interests
The author(s) declared no potential conflicts of interest with respect to the research, authorship, and/or publication of this article.
Funding
The author(s) received no financial support for the research, authorship, and/or publication of this article.