
Abstract
Aims:
Discrepancy between HbA1c and glucose exposure may have significant clinical implications. We sought to assess predictors of disparity between HbA1c and flash monitoring metrics and how these relate to microvascular complications.
Methods:
We conducted a cross-sectional study of adults with type 1 diabetes (n = 518). We assessed the relationship between clinic HbA1c and flash monitoring metrics, predictors of discrepancy between these measurements, and whether discrepancy was associated with microvascular complications.
Results:
Actual HbA1c and estimated HbA1c were strongly correlated (r = .779, P < .001). The likelihood of having a higher actual HbA1c than estimated HbA1c was greater with increasing age (OR = 1.055 per year, P < .001) and lower in men (OR = .208, P < .001). HbA1c was significantly lower in men (58 mmol/mol [51-67]) (7.5% [6.8-8.3]) compared to women (61 mmol/mol [54-70], P = .021) (7.7% [7.1-8.6]), despite no significant differences in any flash monitoring metrics. Whereas HbA1c was not different between younger (≤39 years) and older individuals (>39 years) despite significantly higher glucose exposure, in younger people, based on multiple flash monitoring metrics. Having a lower estimated than actual HbA1c was independently associated with a lower prevalence of retinopathy (OR = .55, P = .004).
Conclusions:
HbA1c appears to overestimate glucose exposure in women and older people with type 1 diabetes. This has potentially important clinical implications, as is hinted at by the independent relationship with retinopathy prevalence. It may also be of relevance when considering the use of HbA1c for the diagnosis of diabetes.
Introduction
Measurement of HbA1c has been an integral component of diabetes management for several decades and, in recent years, an accepted method for diagnosing type 2 diabetes. 1 However, it is recognized that HbA1c has limitations in its ability to accurately predict glucose exposure.2,3 In addition, certain medical conditions, including haemoglobinopathies and anemia, further limit the interpretability of HbA1c. 4 Age, gender, and race have also been identified as factors that can affect the association between glucose exposure and HbA1c.5-8 Significant discrepancy between HbA1c and average glucose exposure has the potential to affect individuals who may be exposed to inappropriate intensification of glucose-lowering therapy or inappropriate therapeutic inaction.2,6 With increasing use of interstitial glucose monitoring systems, greater attention is being paid to metrics such as “time in range” and average glucose 3 in recognition of the potential limitations of HbA1c. Flash glucose monitoring is a form of intermittent-scanning continuous glucose monitoring (iscCGM), which is distinct from real-time continuous glucose monitoring (rtCGM) in only providing a glucose result when the sensor is scanned by a reader. It does not provide alarm functions but in other respects, such as trend arrows and 24-hour glucose trace, it is similar to rtCGM. 9 Evidence already exists to show that continuous glucose monitoring (CGM)-derived average glucose is strongly correlated with HbA1c in type 1 diabetes.10,11 We sought to assess the relationship between flash monitoring metrics and clinic measured HbA1c in adults with type 1 diabetes. In addition, we assessed factors that may influence the discrepancy between these measurements and whether such discrepancy was associated with microvascular complications.
Participants and Methods
Study Design and Participants
We conducted a cross-sectional study of adults with type 1 diabetes using flash glucose monitoring (Freestyle Libre system, Abbott, Witney, UK), where we were able to match a clinic HbA1c with two weeks of flash monitoring data in the same calendar month between May 2019 and May 2020. This cohort included individuals from two clinics within our center (Royal Infirmary of Edinburgh and Western General Hospital), with a combined population of approximately 3340 people with type 1 diabetes. At some point, 1582 individuals have uploaded flash monitoring data to the LibreView portal linked to our center (www.libreview.com). We included individuals where contemporaneous flash monitoring data were available and sufficient to provide an estimated HbA1c (n = 518). In 331 individuals, we were also able to assess flash monitoring data in the month preceding their clinic measured HbA1c (two 2-week datasets) and 233 people had flash monitoring data for the two months preceding their clinic measured HbA1c (three 2-week datasets). This project did not involve deviation from usual clinical care or access to data beyond our usual clinical IT systems and ethical approval was not required.
Outcomes
The primary outcomes were assessment of the association between clinic measured HbA1c and flash monitoring estimated HbA1c and factors that predicted discordance between these measurements. In addition, we assessed a range of flash monitoring-derived parameters including: average glucose, standard deviation of glucose, interquartile range (IQR) of glucose, coefficient of variation of glucose, number of low glucose events per two-week monitoring period, average low event duration, percentage time glucose below 3.9 mM, percentage time glucose in range of 3.9-10 mM, percentage time glucose above 10 mM, number of daily flash monitoring scans, and percentage of flash monitoring data captured. Estimated HbA1c is provided on flash monitoring reports and is calculated as follows: estimated HbA1c (%) = (average sensor glucose [mM] + 2.59)/1.59. 11 Clinical and demographic data including age, date of diabetes diagnosis, last clinic HbA1c, modality of insulin therapy (continuous subcutaneous insulin infusion [CSII] or multiple daily injections [MDIs]), body mass index (BMI), urinary albumin status and socioeconomic deprivation (Scottish Index of Multiple Deprivation [SIMD]) (simd.scot) were collected from our national clinic database system, SCI-Diabetes (https://www.sci-diabetes.scot.nhs.uk). All individuals attending our center have annual retinopathy screening, via a national screening program. For the purposes of this study, presence of any retinopathy (background retinopathy or greater) at the point of data analysis (May 2020) was recorded as “retinopathy present.” Secondary analyses assessed whether discordance between clinic and estimated HbA1c was associated with the presence of retinopathy or albuminuria independently of conventional microvascular risk factors. HbA1c was measured by ion-exchange high performance liquid chromatography using the Arkray Adams A1c automated platform (A. Menarini Diagnostics) (reference range 20-41 mmol/mol [4.0%-5.9%] based on WHO-defined range for individuals without diabetes).
Statistical Analysis
Data were mostly non-normally distributed (as determined by the Shapiro-Wilk test) and are presented as median and IQR. Paired data were analyzed by the Wilcoxon signed-rank test and unpaired data by the Mann-Whitney U test. Comparisons across multiple groups were analyzed by the Kruskal-Wallis test. Categorical data were compared by the χ2 test. Logistic regression was performed to identify independent associations with HbA1c discordance and complications. Correlations were analyzed by Spearman’s rank correlation. Fisher Z-transformation was used to compare differences between correlation coefficients. Significance was accepted at P < .05. All analyses were performed using RStudio version 1.0.153 (https://www.rstudio.com).
Results
Participant Characteristics
Characteristics of the study participants are summarized in Table 1. As shown, 121/242 (50.0%) men and 107/276 (38.8%) women had a clinic HbA1c <58 mmol/mol (7.5%) (P = .010 between genders). When assessing estimated HbA1c, 115/242 men (47.5%) and 40.6% of women had a value <58 mmol/mol (7.5%) (P = .112). Study participants were younger (39 years [31-51] vs 50 [33-62], P < .001), had lower HbA1c (59 mmol/mol [52-67] vs 65 [56-77], P < .001) (7.5% [6.9-8.3] vs 8.1 [7.3-9.2]), higher BMI (26.2 kg/m2 [23.6-30.1] vs 26.0 [23.1-29.4], P = .04), were more likely to be female (34.1% vs 24.2% male), and were more affluent by SIMD quintile (P < .001) than flash monitoring users in our center where data were not available for inclusion in this study.
Characteristics of Study Cohort.
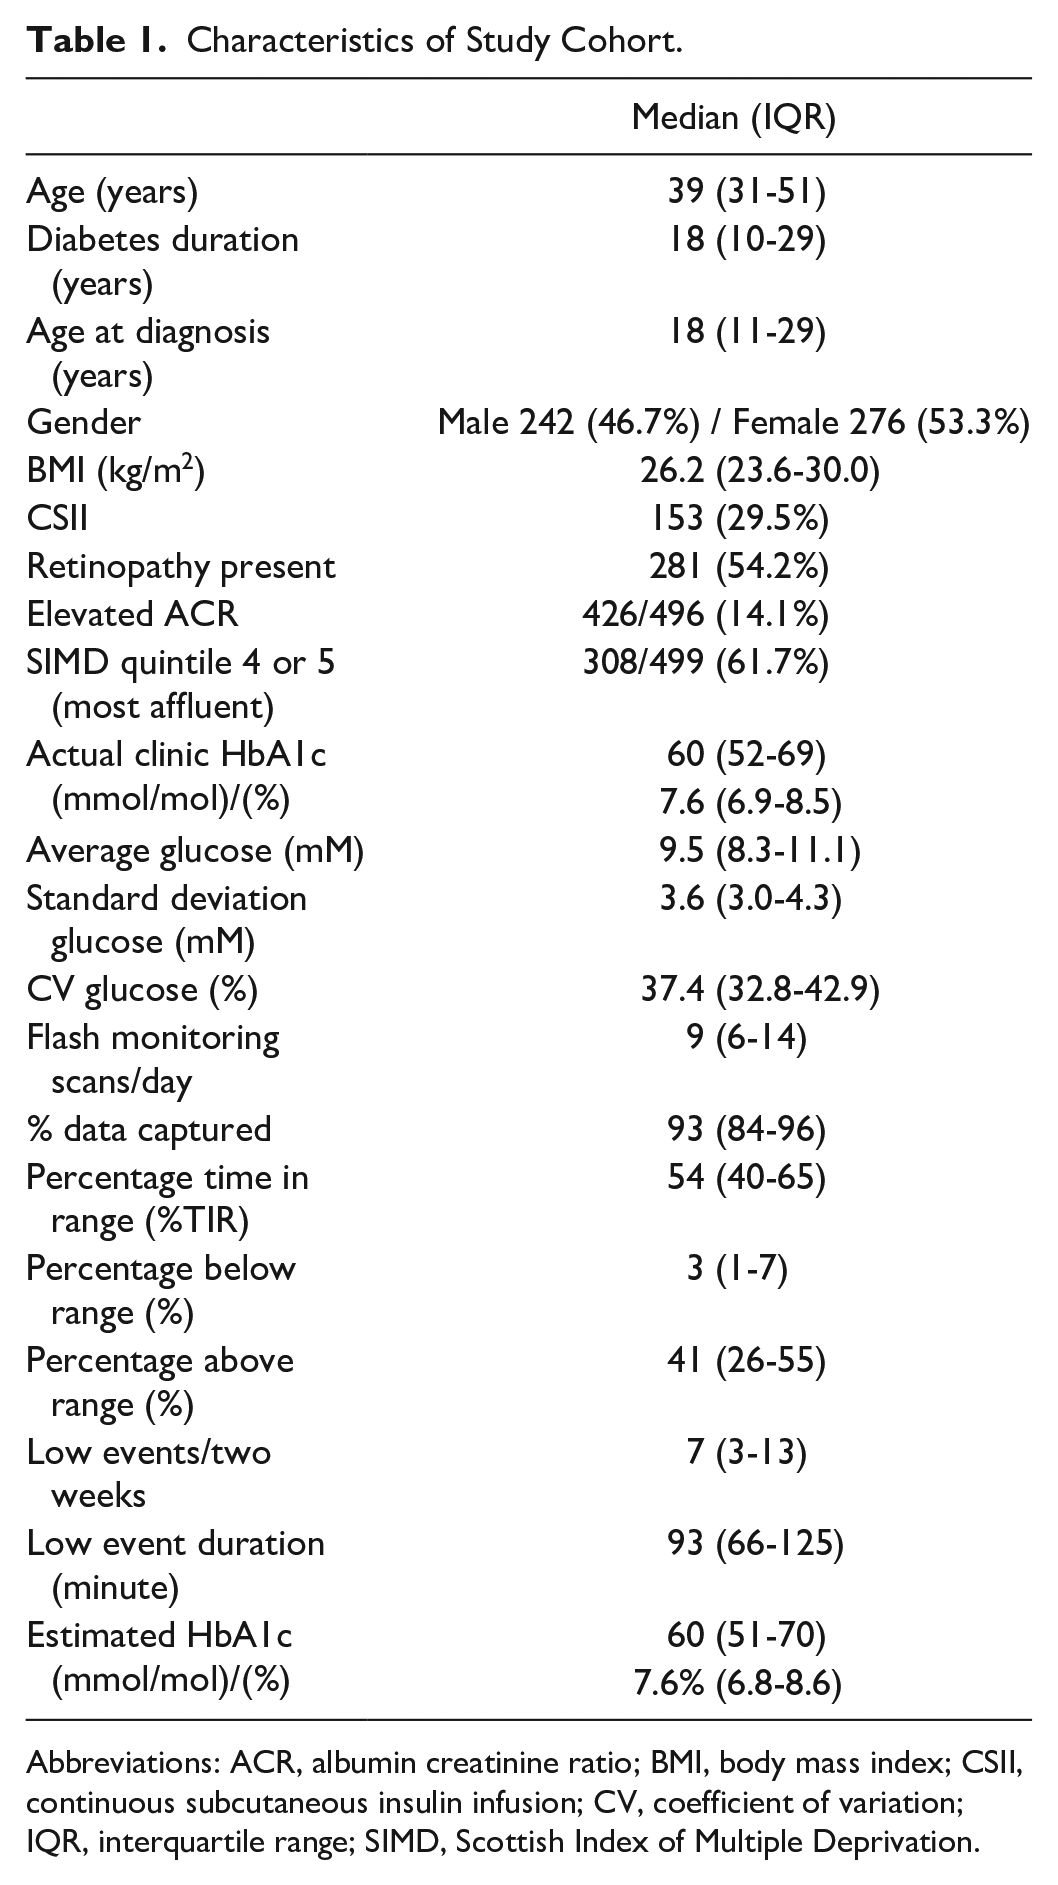
Abbreviations: ACR, albumin creatinine ratio; BMI, body mass index; CSII, continuous subcutaneous insulin infusion; CV, coefficient of variation; IQR, interquartile range; SIMD, Scottish Index of Multiple Deprivation.
Relationship Between Clinic HbA1c and Estimated HbA1c
The correlation between a single flash monitoring estimated HbA1c (two-week snapshot) and clinic measured HbA1c was r = .779, P < .001 for the complete cohort (Figure 1), with the Bland-Altman plot suggesting systematically lower actual HbA1c at the upper end of the range and higher actual HbA1c with lower values of HbA1c (Figure 1). When limited to the cohort where flash monitoring data were available on the month of clinic HbA1c and the two preceding months (n = 223), the effect of adding additional flash monitoring data was as follows: single flash monitoring data, r = .803, P < .001; two months’ flash monitoring data, r = .821, P < .001; three months’ flash monitoring data, r = .845, P < .001. There was no significant difference between correlation coefficients derived from one month’s data compared to two months’ data (P = .582) and three months’ data (P = .168). Within the cohort with three months’ data, the median deviation (all negative values converted to positive values) between clinic HbA1c and estimated HbA1c was 5.0 mmol/mol (3.0-9.5) (0.46% [.27-.76]) with one month of flash monitoring data, 4.5 mmol/mol (2.5-8.3) (0.41% [.23-.76]) with two months of flash monitoring data (P
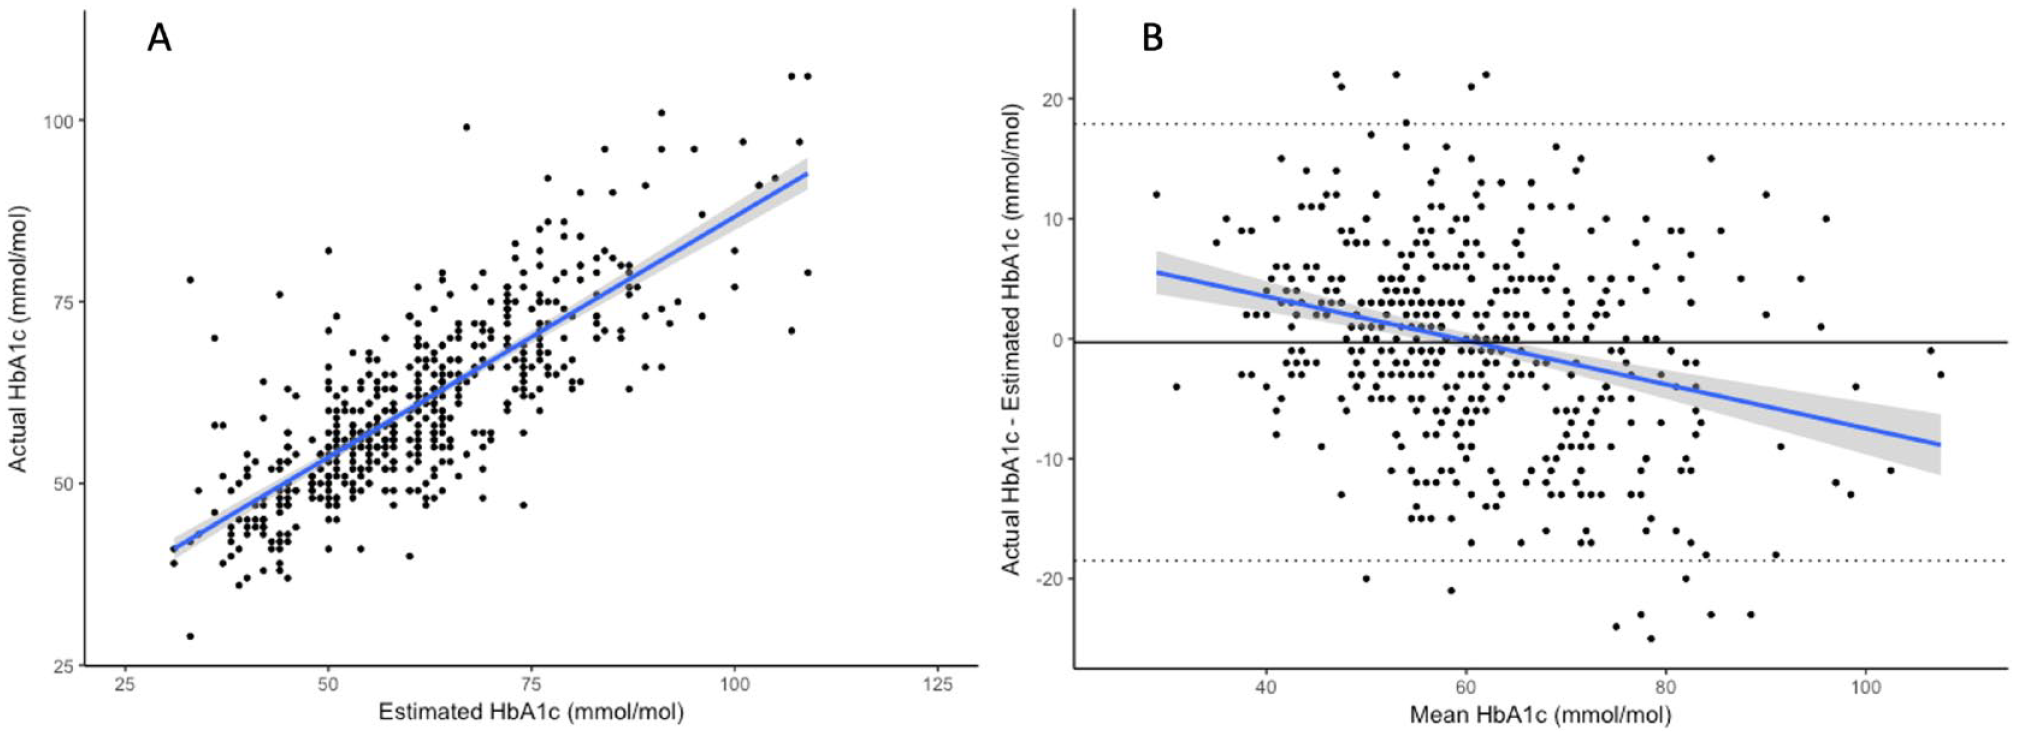
(a) Scatterplot and regression line showing relationship between estimated HbA1c (single two-week data capture in the same month as the clinic HbA1c) and actual clinic HbA1c in the complete cohort (r = .779, P < .001). (b) Bland-Altman plot with overlying regression line (r = -.278, P < .001), dotted lines represent SDx1.96 and solid line represents mean of difference between actual HbA1c and estimated HbA1c. Shading on regression lines represents 95% CI.
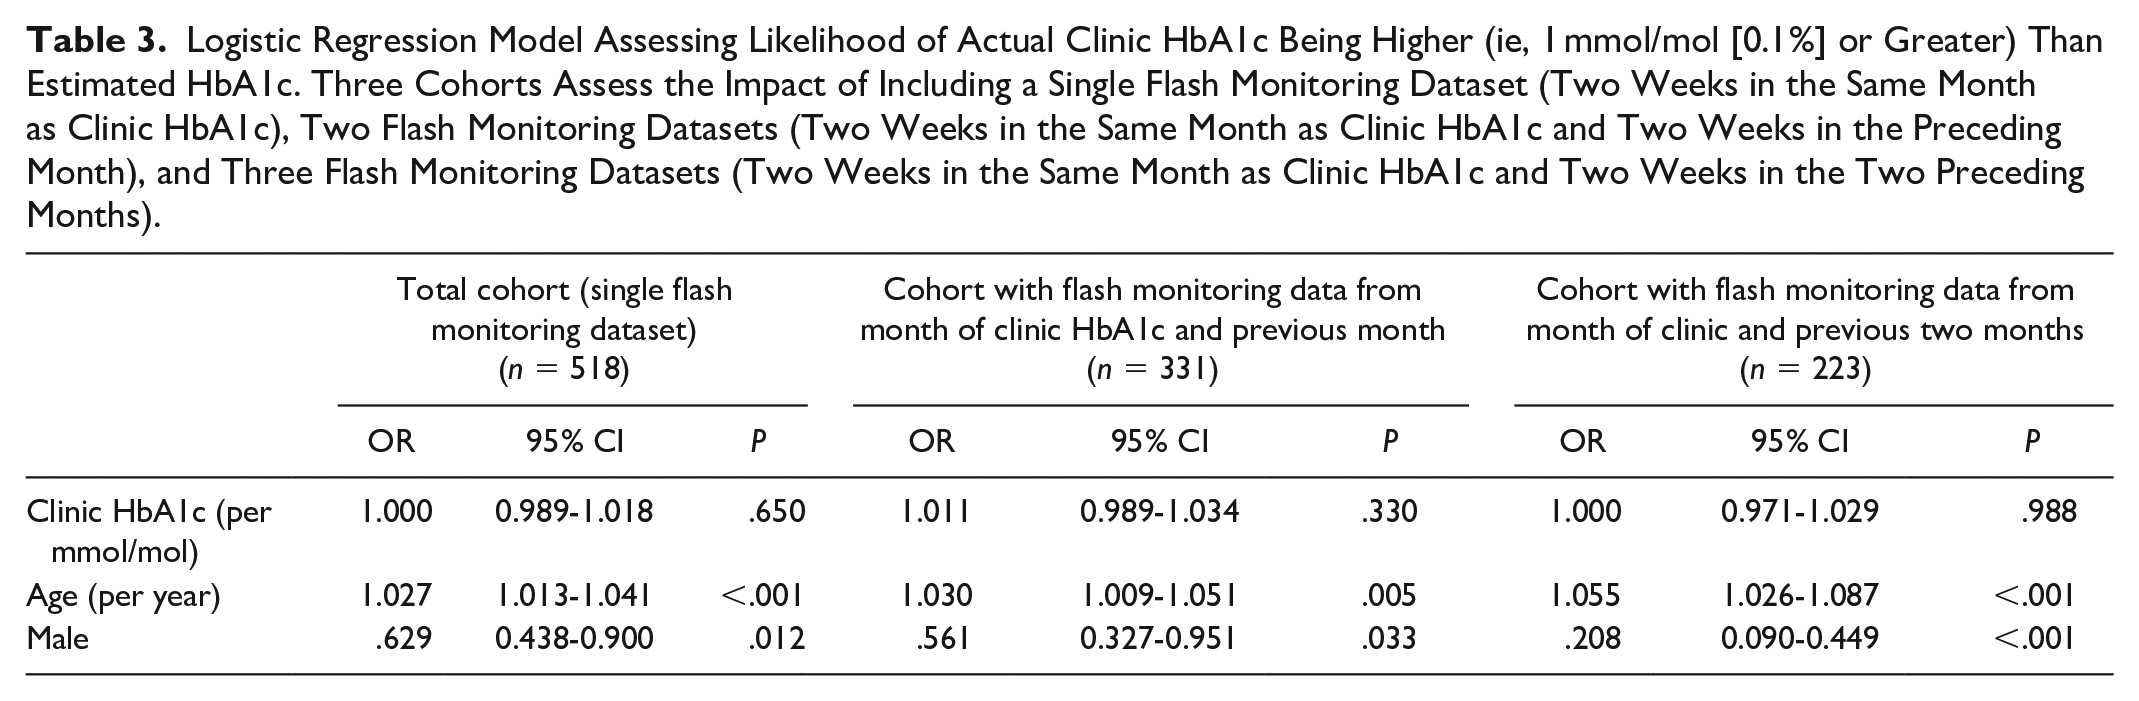
Factors Associated With Discordance Between Clinic HbA1c and Estimated HbA1c
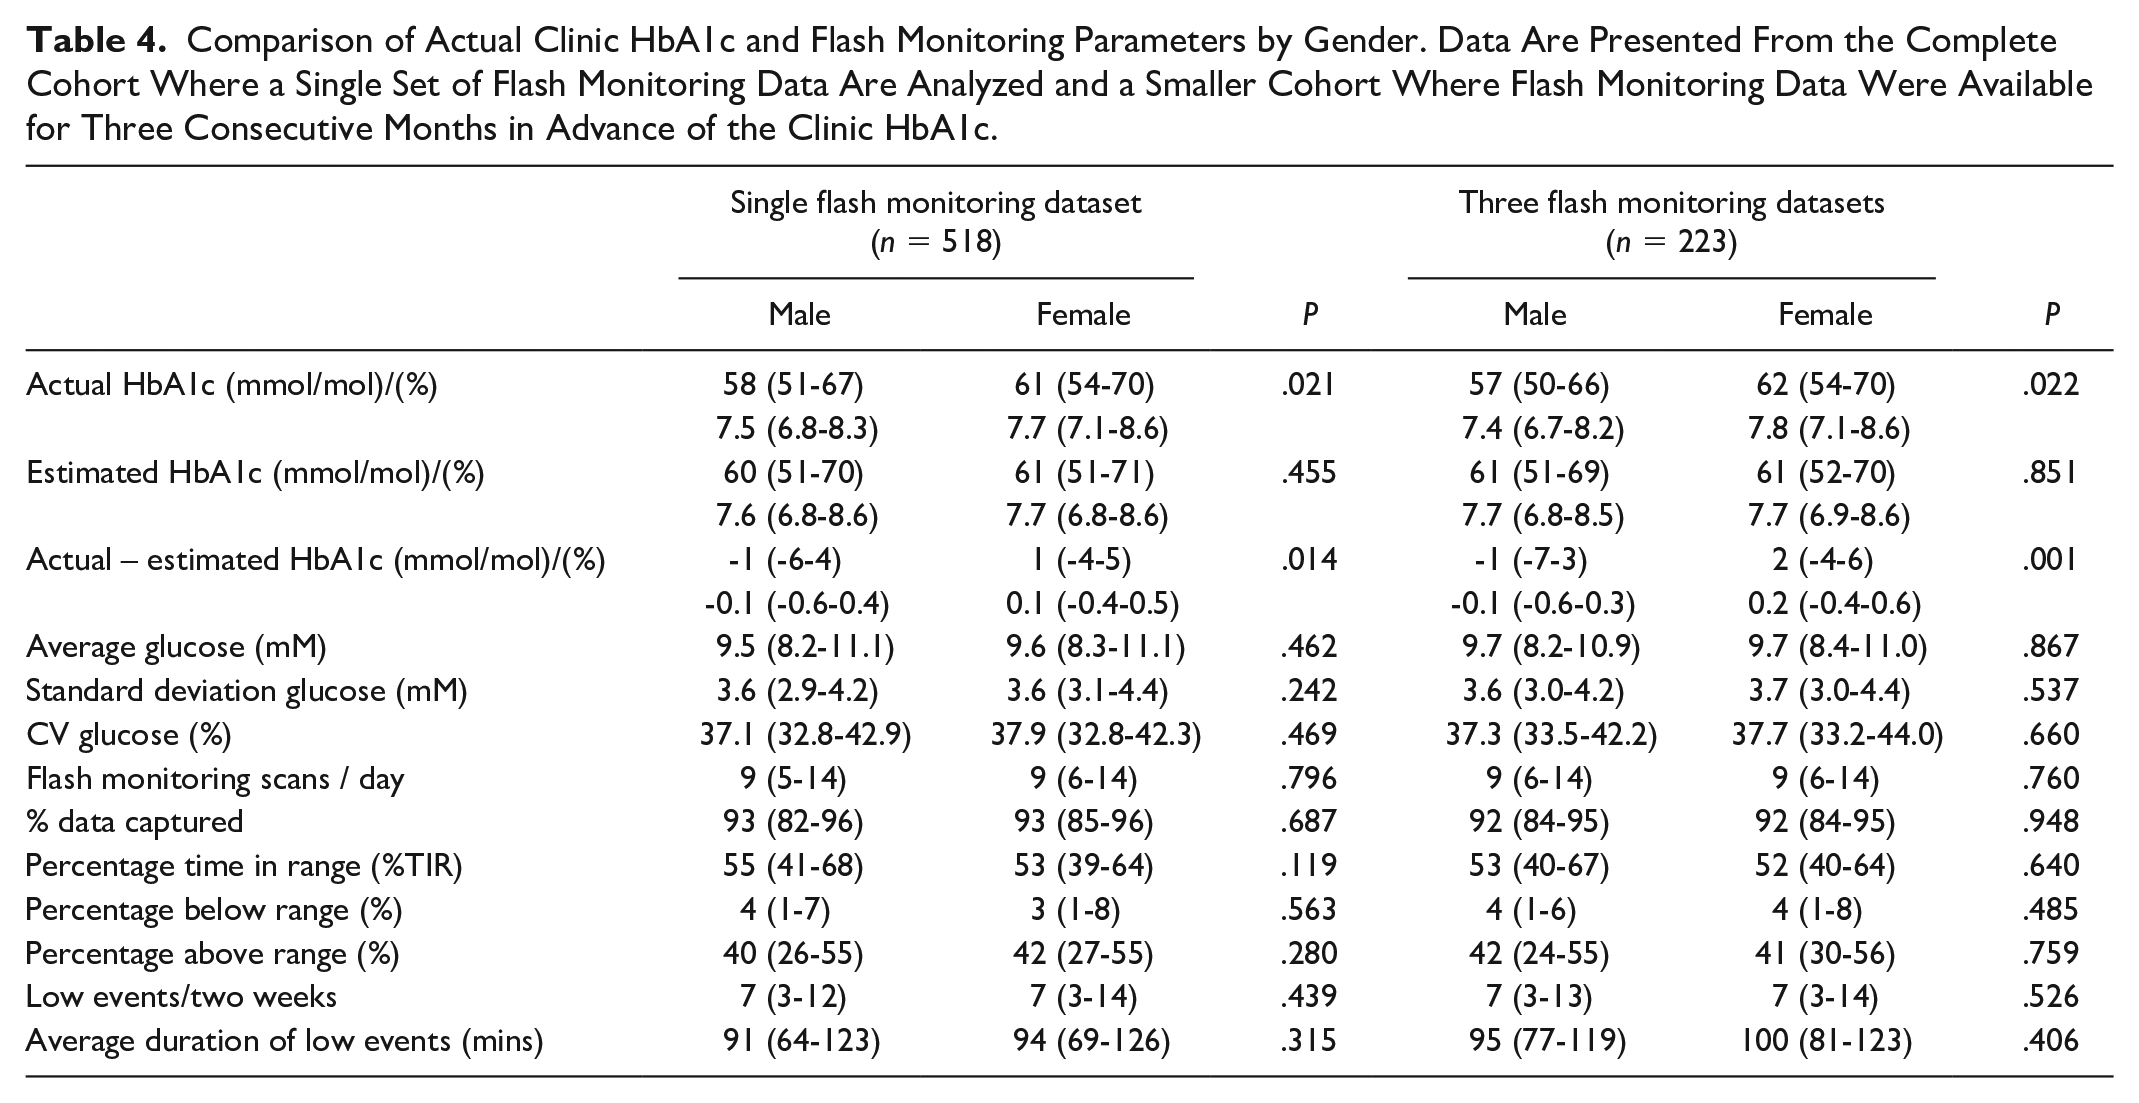
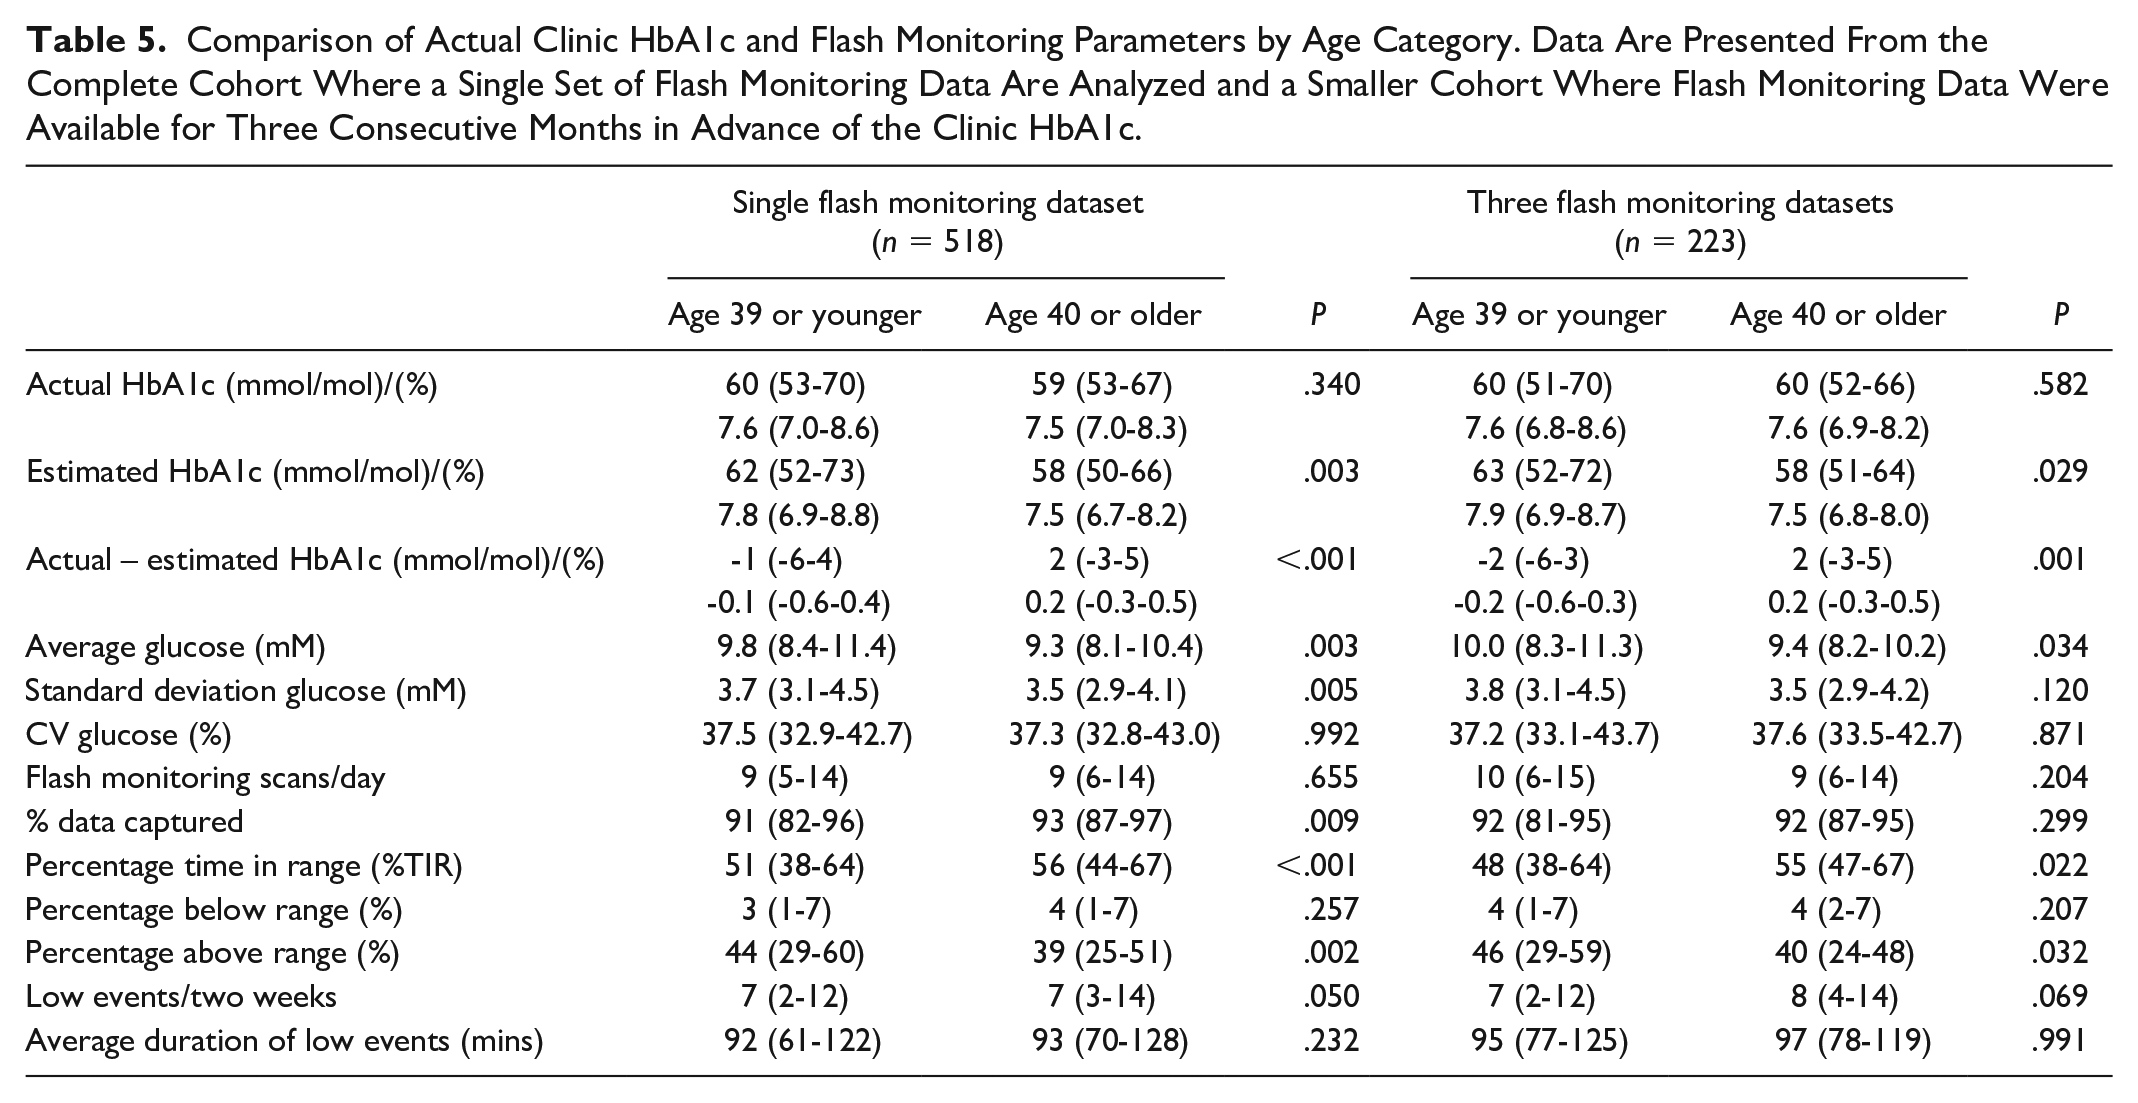
Factors associated with clinic HbA1c being substantially higher or lower (either ≥5 mmol/mol [0.5%] above or below estimated HbA1c) are presented in Table 2. Lower average glucose, greater time in range, and more low glucose events were associated with a higher clinic than estimated HbA1c (Table 2). In addition, female sex (+1 mmol/mol (-4-5) vs -1 (-6-4) in men, P = .014) (0.1% [-.3-.5] vs -0.1 [-.6-.4]) (Figure 2) and older age (Figure 3) were associated with clinic HbA1c being higher than the estimated HbA1c. In the logistic regression analysis, age and female sex, but not clinic HbA1c, were independently associated with a greater likelihood of clinic HbA1c being higher than estimated HbA1c (Table 3). When stratified by age (above or below median age of 39 years), the association between female sex and higher clinic HbA1c, compared to estimated HbA1c, was present in the younger cohort (45.7% females vs 31.4% males, P = .020) but attenuated in the older cohort (61.4% females vs 52.6% males, P = .159). Differences related to sex and age were not limited to estimated HbA1c. Women had significantly higher clinic HbA1c despite no significant difference across all flash monitoring parameters (Table 4). Clinic HbA1c was not significantly different between older and younger individuals despite multiple flash monitoring parameters consistent with lower glucose levels in the older group (Table 5). Hemoglobin concentration was available within one year of clinic HbA1c measurement in 204/518 (39.4%) of individuals. There was no significant correlation between hemoglobin concentration and difference between clinic and estimated HbA1c (r = -.084, P = .234).
Comparison of Cohort Stratified by: Actual HbA1c Higher (Where Actual HbA1c is ≥5 mmol/mol [0.5%] Higher Than Estimated HbA1c); Actual HbA1c and Estimated HbA1c Are Similar; Actual HbA1c Lower (Where Actual HbA1c is ≥5 mmol/mol [0.5%] Lower Than Estimated HbA1c).
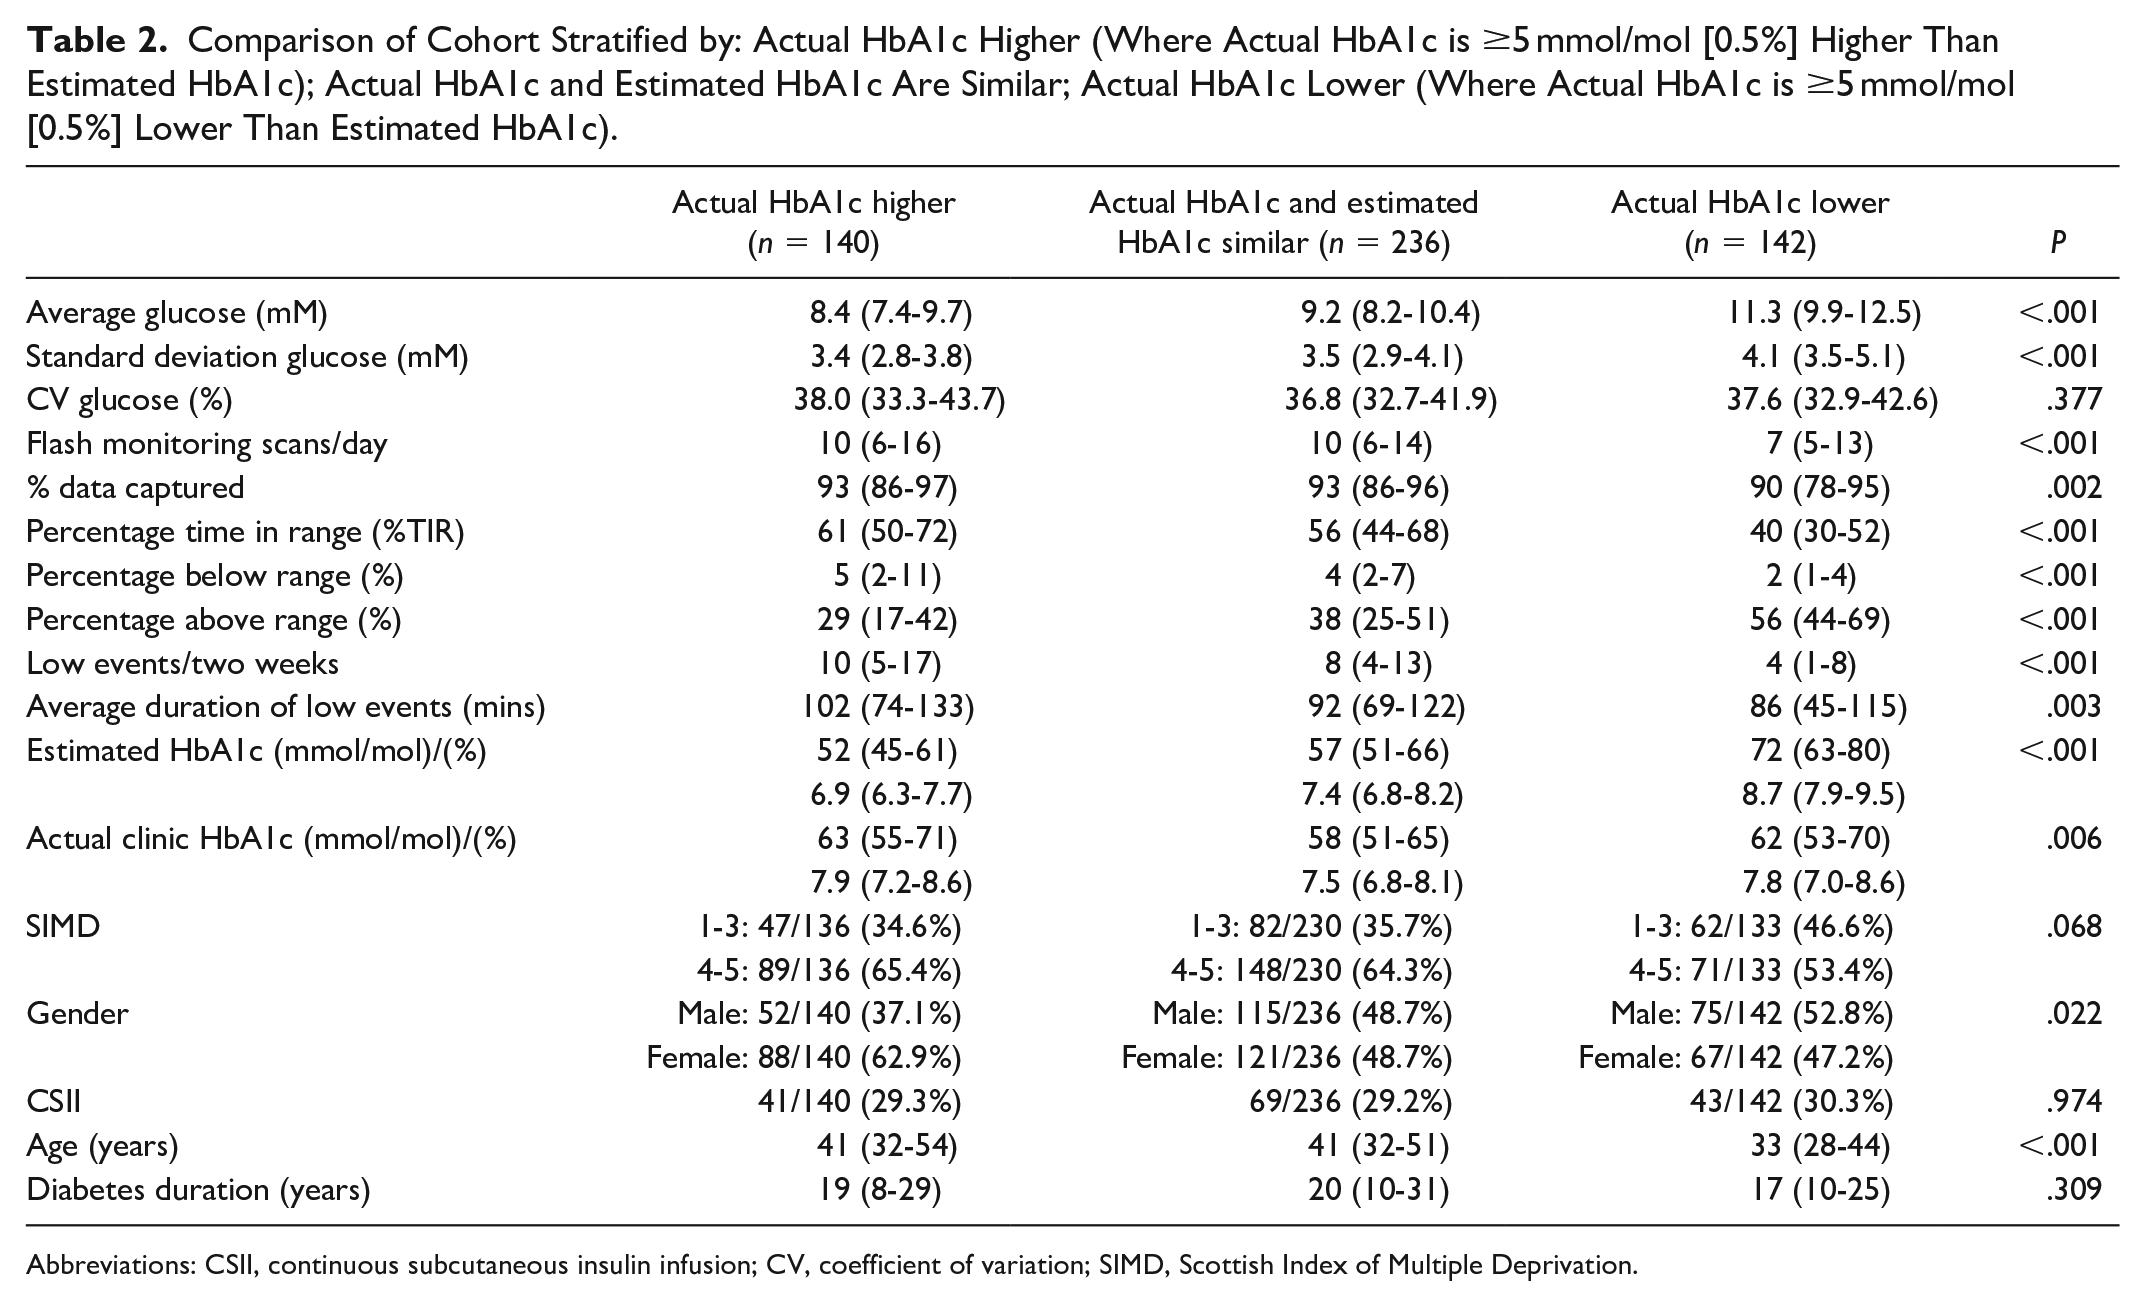
Abbreviations: CSII, continuous subcutaneous insulin infusion; CV, coefficient of variation; SIMD, Scottish Index of Multiple Deprivation.
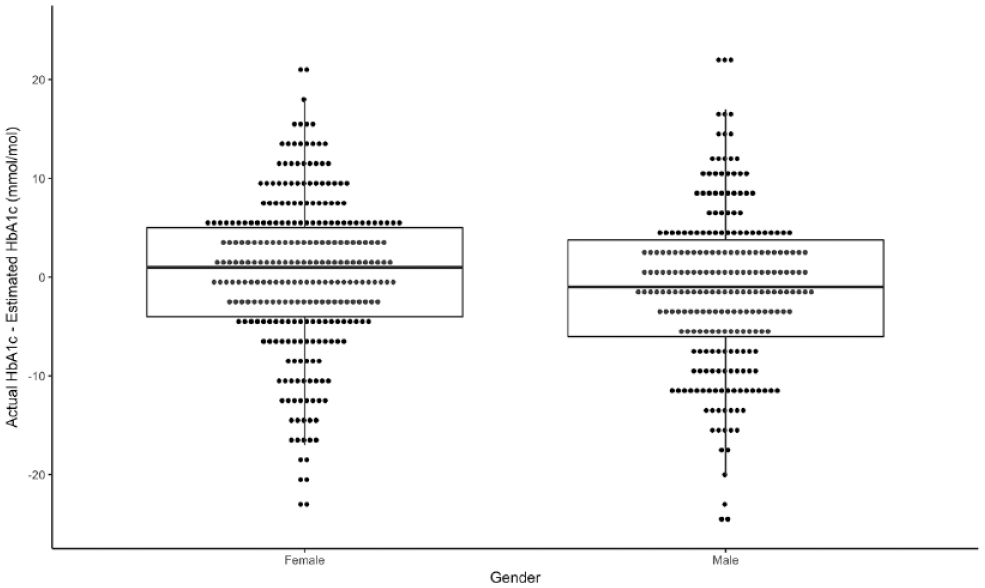
Difference between actual clinic HbA1c and estimated HbA1c (based on single two-week data capture in the same month as clinic HbA1c measured) in complete cohort by gender, P = .014.
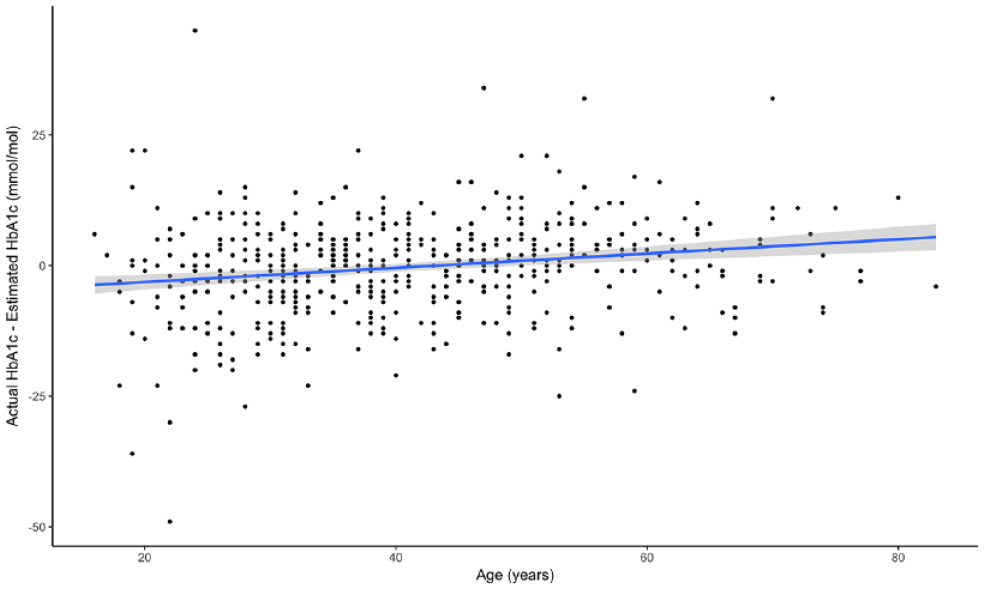
Relationship between age and difference between actual clinic HbA1c and estimated HbA1c (based on single two-week data capture in same month as clinic HbA1c measured) in the complete cohort (r = .204, P < .001).
Logistic Regression Model Assessing Likelihood of Actual Clinic HbA1c Being Higher (ie, 1 mmol/mol [0.1%] or Greater) Than Estimated HbA1c. Three Cohorts Assess the Impact of Including a Single Flash Monitoring Dataset (Two Weeks in the Same Month as Clinic HbA1c), Two Flash Monitoring Datasets (Two Weeks in the Same Month as Clinic HbA1c and Two Weeks in the Preceding Month), and Three Flash Monitoring Datasets (Two Weeks in the Same Month as Clinic HbA1c and Two Weeks in the Two Preceding Months).
Comparison of Actual Clinic HbA1c and Flash Monitoring Parameters by Gender. Data Are Presented From the Complete Cohort Where a Single Set of Flash Monitoring Data Are Analyzed and a Smaller Cohort Where Flash Monitoring Data Were Available for Three Consecutive Months in Advance of the Clinic HbA1c.
Comparison of Actual Clinic HbA1c and Flash Monitoring Parameters by Age Category. Data Are Presented From the Complete Cohort Where a Single Set of Flash Monitoring Data Are Analyzed and a Smaller Cohort Where Flash Monitoring Data Were Available for Three Consecutive Months in Advance of the Clinic HbA1c.
Complications
In total, 281/518 (54.2%) individuals had evidence of retinopathy (ie, background retinopathy or greater). The presence of retinopathy was significantly lower in those where clinic HbA1c was higher than estimated HbA1c (48.6% vs 59.5%, P = .013). In the logistic regression analysis, actual HbA1c higher than estimated HbA1c was independently associated with lower prevalence of retinopathy (OR = .55 [95% 0.37-0.82], P = .004) as was increasing age (OR = .96 per year [95% CI 0.94-0.98], P < .001), whilst diabetes duration (OR = 1.10 [95% CI 1.07-1.12], P < .001) and clinic HbA1c (OR = 1.02 per mmol/mol [95% CI 1.00-1.03], P = .024) were associated with higher retinopathy prevalence. Male gender was not significantly associated with retinopathy in the logistic regression analysis (OR = 1.00 [95% CI 0.67-1.50], P = .989). In a similar model assessing renal disease (defined as microalbuminuria or greater, n = 70/496 [14.1%]), higher clinic than estimated HbA1c was not a significant association (OR = 1.96 [95% CI 0.70-2.05], P = .510). Clinic HbA1c (OR = 1.03 per mmol/mol [95% CI 1.01-1.05], P = .005) and greater diabetes duration (OR = 1.03 per year [95% CI 1.01-1.05], P = .009) were independently associated with renal disease but gender (P = .999) and age (P = .589) were not.
Discussion
We have shown reasonable agreement between actual clinic HbA1c and flash monitoring estimated HbA1c, with only modest improvements when considering data from three months rather than a single snapshot. We have demonstrated a tendency for actual HbA1c to be lower at the high end of the HbA1c spectrum and higher at the lower end, compared to the flash monitoring derived estimate. Increasing age is associated with higher HbA1c than would be expected for the prevailing flash glucose metrics. Female sex is also associated with higher than expected HbA1c, although this association appears to be most marked in younger women. Individuals with a higher than expected HbA1c appeared to have an independently lower risk of having retinopathy (compared to those with a lower than expected HbA1c based on flash monitoring data), perhaps contrary to expectations based on the glycation gap hypothesis. 1
Previous studies assessing discrepancies between glucose exposure and HbA1c are varied both in terms of their study cohorts and methods for determining glucose exposure.5-8 In particular, there are very few studies that compare HbA1c and CGM metrics in people with type 1 diabetes. The largest study, to date, revealed significant racial disparity in HbA1c in people with type 1 diabetes when adjusted for mean interstitial glucose concentration. 5 It is striking that associations with higher HbA1c, in relation to metrics of glucose exposure, and age are not consistent between studies with disparate clinical and demographic characteristics. Women were over-represented in the highest hemoglobin glycation index (HGI) groups in one study of individuals without diabetes 7 and in a post-hoc analysis of the ACCORD trial in type 2 diabetes, 6 but the opposite was true in another cohort of individuals without diabetes. 8 Similarly, higher HGI was associated with older age in one study (no diabetes) 8 and younger age in the ACCORD study (type 2 diabetes), 6 but no significant age relationship was observed in another (no diabetes). 7 These studies were conducted in people with type 2 diabetes or in individuals at significant risk of developing the condition. Consequently, the average age of participants was substantially higher than in our cohort of people with type 1 diabetes. These studies, in contrast to our cohort, also included a substantial proportion of black and Hispanic participants. Given the substantial clinical and demographic differences relating to participants in previously published studies, it is hard to extrapolate their findings to our study and to individuals with type 1 diabetes. These studies also used fasting plasma glucose6,7 or oral glucose tolerance test plasma glucose results 8 to define discrepancy between HbA1c and glucose exposure in contrast to the comprehensive data gleaned from interstitial glucose monitoring.
The association between higher than expected HbA1c at the lower end of the range and lower than expected HbA1c at the upper end of the range may simply reflect a regression to the mean in people where flash monitoring data were unrepresentative of the preceding months. However, this cannot fully explain this pattern as even when factoring in data from three months the relationship persisted. Flash monitoring is recognized to produce slightly lower results than plasma glucose, 12 particularly at the lower end of range, but this also appears insufficient to explain the linear relationship demonstrated in the Bland-Altman plots comparing estimated and actual HbA1c. It is difficult to explain why increasing age and female sex were independently associated with relatively higher HbA1c concentration in our cohort, although HbA1c has previously been observed to increase with age in people without diabetes. 13 There did not appear to be a relationship between hemoglobin concentration and the disparity between estimated and actual HbA1c in the subset of individuals where a contemporaneous hemoglobin concentration was available. Heterogeneity in mean red blood cell age has been associated with clinically meaningful variation in HbA1c, 14 although no evidence exists to suggest an effect of age or gender upon this relationship. One potential contributor, in females, could be differences in red cell turnover, as a consequence of menstrual blood loss. Another potential explanation for discrepancies between HbA1c and flash monitoring metrics would be a systematic bias related to interstitial glucose measurement by age or gender. However, we are not aware of any evidence to support age or gender differences in the measurement of interstitial glucose concentration.
The independent association between higher than expected clinic HbA1c and a lower likelihood of prevalent retinopathy is an intriguing, albeit tentative, finding. Previous research has focused on potentially increased risk in those individuals with disproportionately high HbA1c (based on comparison with fructosamine, plasma glucose, or capillary blood glucose profiles). An analysis of the Diabetes Control and Complications Trial cohort refuted an independent relationship between glycation index and risk of subsequent complications in type 1 diabetes. 15 In a mixed diabetes population (predominantly type 2 diabetes), a positive glycation gap was significantly associated with microvascular complications. 16 Our study is the first to report comparisons based on continuous interstitial glucose data but is limited by being cross-sectional rather than prospective. It is conceivable that individuals with disproportionately low HbA1c (in comparison to flash monitoring metrics) are offered false reassurance and, to their detriment, are less likely to intensify glycemic management. These data do not support the hypothesis that “high glycators” are at elevated risk of microvascular complications and imply that information provided by flash monitoring contributes independently to predicting the presence of retinopathy (in addition to current HbA1c and diabetes duration).
A particular strength of our study is that it represents one of the largest assessments of the relationship between interstitial glucose monitoring metrics and HbA1c in type 1 diabetes. Intuitively, direct measurement of daily glucose profiles should provide a more robust comparator than those derived from fasting plasma glucose, glucose tolerance tests, or fructosamine, when assessing discrepancies between glucose exposure and HbA1c. We were also able to report a comprehensive set of clinical and demographic characteristics for our study cohort. As we have previously reported, 17 flash monitoring use is skewed toward more affluent, younger individuals, with lower HbA1c. Within our center’s flash monitoring cohort, those with data available for analysis were also disproportionately younger, more affluent, and with lower HbA1. Consequently, the study cohort is generalizable to flash monitoring users engaged in regular data sharing but not necessarily to the wider type 1 diabetes population. Unlike previous studies, which have been racially diverse,5,7,8 our type 1 diabetes clinic population is almost entirely Caucasian, which reduces generalizability to other populations but also reduces the influence of an important confounding variable. Although it would potentially have been preferable to report flash monitoring data for a complete 90-day period prior to clinic HbA1c, this information was not available. In some respects, comparison with the two-week flash monitoring data is more clinically relevant, as these are typically the data discussed during a diabetes clinic consultation. Furthermore, recent evidence suggests 14 days is sufficient to extrapolate a representative estimation of glucose metrics over a three-month period. 18 We have also been able to show that combining data from the three months, which contribute to a clinic HbA1c, did not materially alter the results derived from a single flash monitoring dataset. The demonstration of independent age and gender effects upon the discrepancy between glucose exposure and HbA1c raises the question of whether age- and gender-specific HbA1c targets may be appropriate. This would require both verification in other populations and also prospective evidence that interstitial glucose metrics are more discriminatory in predicting diabetes complications. Our findings may also have implications with respect to the HbA1c threshold used for diagnosing type 2 diabetes. However, our study cohort is very different from those at risk of (or diagnosed with) type 2 diabetes, and these findings require verification in the appropriate populations.
Conclusion
With increasing access to flash monitoring and CGM, the reliance upon HbA1c to guide intensification of glycemic control is diminishing. This study suggests that, in type 1 diabetes, HbA1c may significantly overestimate glucose exposure in women and older people (the opposite being true in men and younger individuals), with potentially important clinical implications for HbA1c targets. These findings will require verification in larger cohorts and the potential impact of mismatch between HbA1c and glucose exposure upon microvascular risk will require a prospective assessment. Given the increasing reliance upon HbA1c for the diagnosis of type 2 diabetes, these data suggest that evaluation of continuous glucose metrics and their relationship with HbA1c would also be of value in this context.
Supplemental Material
ESM_Figure_1 – Supplemental material for HbA1c Is Disproportionately Higher in Women and Older People With Type 1 Diabetes Compared With Flash Glucose Monitoring Metrics of Glycemic Control
Supplemental material, ESM_Figure_1 for HbA1c Is Disproportionately Higher in Women and Older People With Type 1 Diabetes Compared With Flash Glucose Monitoring Metrics of Glycemic Control by Roland H. Stimson, Anna R. Dover, Shareen Forbes, Mark W. J. Strachan, John A. McKnight and Fraser W. Gibb in Journal of Diabetes Science and Technology
Supplemental Material
STROBEchecklist_4 – Supplemental material for HbA1c Is Disproportionately Higher in Women and Older People With Type 1 Diabetes Compared With Flash Glucose Monitoring Metrics of Glycemic Control
Supplemental material, STROBEchecklist_4 for HbA1c Is Disproportionately Higher in Women and Older People With Type 1 Diabetes Compared With Flash Glucose Monitoring Metrics of Glycemic Control by Roland H. Stimson, Anna R. Dover, Shareen Forbes, Mark W. J. Strachan, John A. McKnight and Fraser W. Gibb in Journal of Diabetes Science and Technology
Footnotes
Abbreviations
BMI, body mass index; CSII, continuous subcutaneous insulin infusion; iscCGM, intermittent-scanning continuous glucose monitoring; IQR, inter-quartile range; MDI, multiple daily injections; NHS, National Health Service; rt-CGM, real-time continuous glucose monitoring; SIMD, Scottish Index of Multiple Deprivation.
Declaration of Conflicting Interests
The author(s) declared the following potential conflicts of interest with respect to the research, authorship, and/or publication of this article: FWG has received speaker fees from Abbott Diabetes Care. ARD has received speaker fees from Abbott Diabetes Care.
Funding
The author(s) received no financial support for the research, authorship, and/or publication of this article.
Supplemental Material
Supplemental material for this article is available online.
References
Supplementary Material
Please find the following supplemental material available below.
For Open Access articles published under a Creative Commons License, all supplemental material carries the same license as the article it is associated with.
For non-Open Access articles published, all supplemental material carries a non-exclusive license, and permission requests for re-use of supplemental material or any part of supplemental material shall be sent directly to the copyright owner as specified in the copyright notice associated with the article.