
Abstract
Background
We examined whether dynamic color range indicator (DCRI) and blood sugar mentor (BSM) features in a new blood glucose meter could improve interpretation of results and encourage patient action.
Methods
One hundred and thirty three people with type 2 (T2D) (n = 73) or type 1 diabetes (T1D) (n = 60) evaluated information first without and then with DCRI or BSM guidance using interactive exercises.
Results
Subjects improved their ability to categorize results into low, in range, or high glycemic ranges by 29% (T2D) and 22% (T1D) (each P < .001). There was significantly greater willingness to act on high and low results shown with DCRI or BSM screens. Subjects also expressed a high degree of satisfaction with these features.
Conclusions
Use of DCRI and BSM in this meter may help patients improve their diabetes management decisions.
Keywords
Introduction
“Self-monitoring is not dead.” 1 This dramatic headline highlights how changing attitudes to blood glucose (BG) monitoring have encouraged healthcare professionals (HCPs) to reevaluate self-monitoring of blood glucose (SMBG) and the potential adoption of continuous glucose monitoring (CGM). Despite demonstrated benefits of CGM, there remains room for improvement.2,3 Increased CGM adoption from 7% to 30% in type 1 (T1D) diabetes exchange patients has not translated into overall improvements in glycated hemoglobin A1c (A1c). 4 Fundamental changes are required in the relationship between patients and their devices to ensure patients receive more immediate context and actionable insights. We previously reported that BG meters utilizing a color range indicator (CRI) improved the ability of patients to interpret results and make decisions5,6 and lowered A1c compared to subjects using meters without a CRI. 7 In the current study, we investigated whether a meter with a dynamic CRI (DCRI) that provides richer information, and a blood sugar mentor (BSM) feature that automatically delivers timely and relevant on-screen guidance to patients improve the ability of patients to interpret glucose data and consider acting on this new advice.
Methods
Study Population
One hundred and thirty three adult subjects (≥16 years old) with a diagnosis of diabetes for at least three months were recruited from three National Health Service (NHS) hospital clinics in the United Kingdom. Demographics, SMBG frequency, and meter usage is shown in Table 1. Fourteen subjects had used CGM (12 Freestyle Libre, 2 Dexcom); nearly a third (32.3%) used Roche Accu-check meters; and 70% of subjects with type 2 diabetes (T2D) used some form of insulin. Subjects had a mean age of 55.7 years and mean A1c of 8.5% as obtained from the NHS database. At the beginning of the study, each subject completed a subjective numeracy survey based on Fagerlin et al. 8
Baseline Subject Demographics.
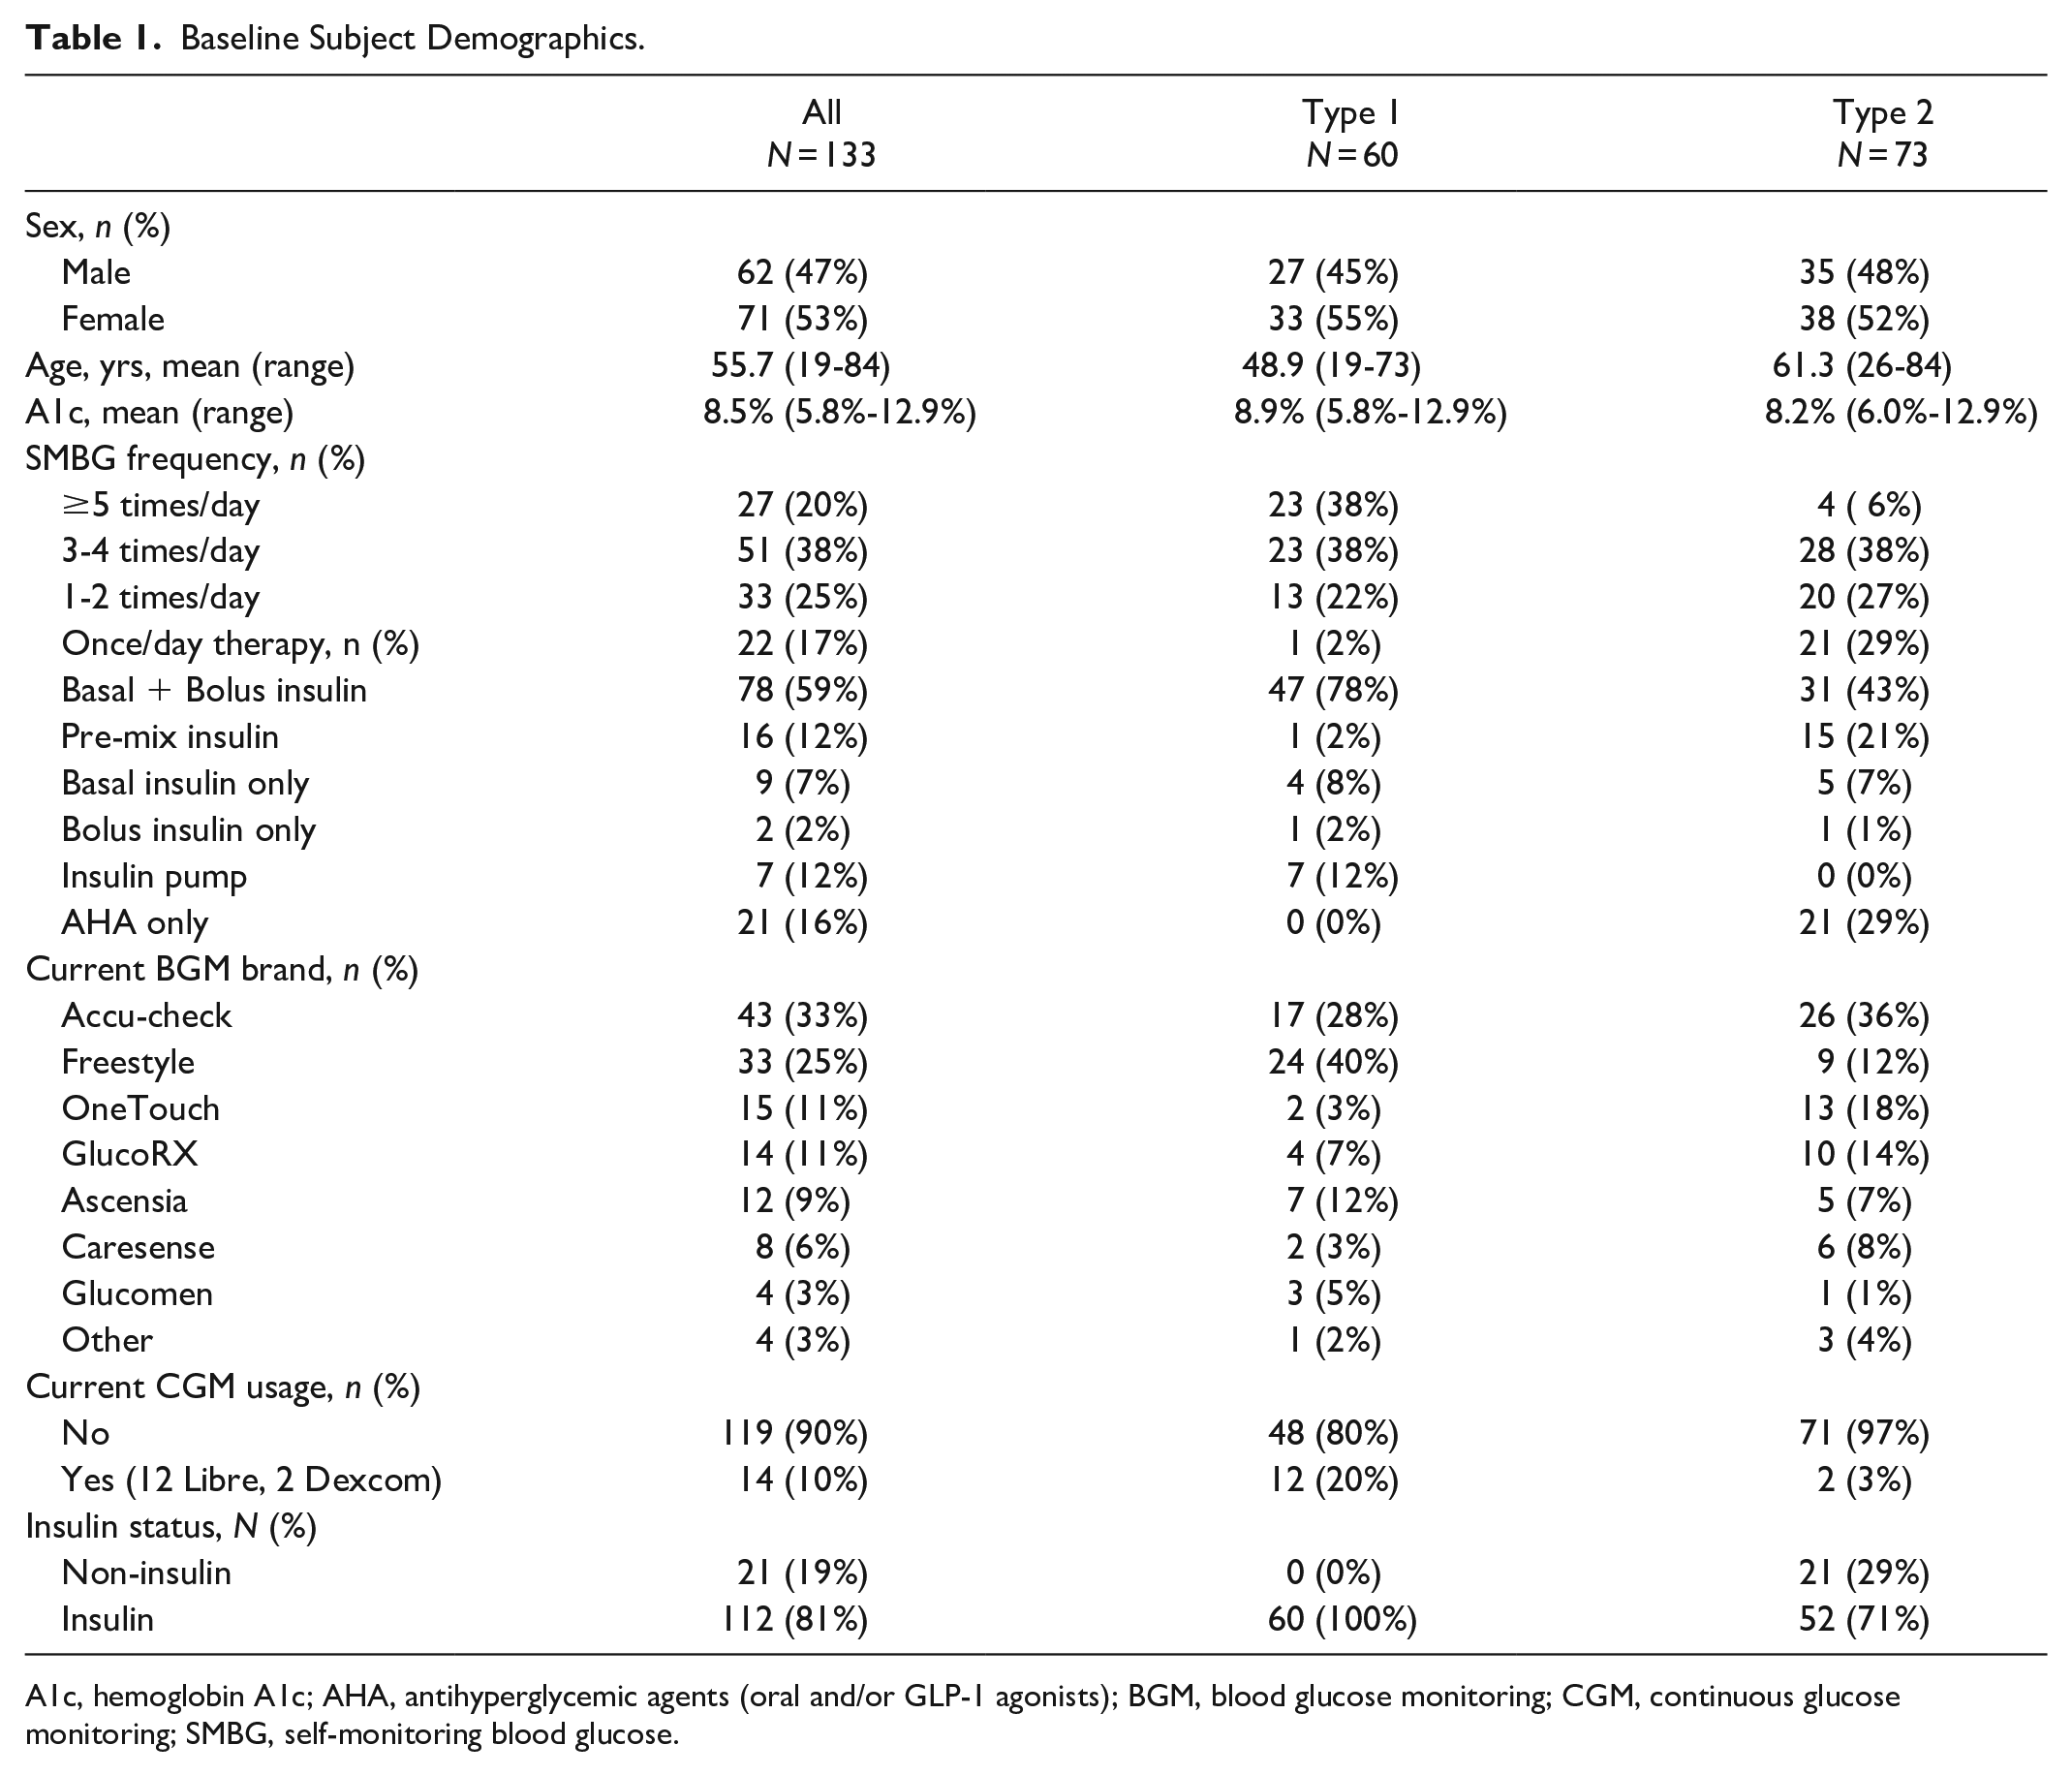
A1c, hemoglobin A1c; AHA, antihyperglycemic agents (oral and/or GLP-1 agonists); BGM, blood glucose monitoring; CGM, continuous glucose monitoring; SMBG, self-monitoring blood glucose.
Study Design
Before conducting any test exercises, subjects rated their ability to recognize BG results as low, in-range, or high as very easy, easy neither easy nor difficult, difficult, or very difficult to recognize.
Eight exercises were facilitated by administrative site staff using a standardized script. In exercises 1-4 (Figure 1), subjects were tested as to their ability to classify results with or without DCRI and how they would act on these results. First, 25 BG values without DCRI were shown to subjects in random order on a tablet computer. The same 25 values with DCRI were then shown to subjects in a different random order. In each case, subjects evaluated if values were low, near low, in-range, near high, or high. Then, six pairs of low or high BG values were presented with or without DCRI and subjects were asked to select the six screens on which they would be more inclined to act.
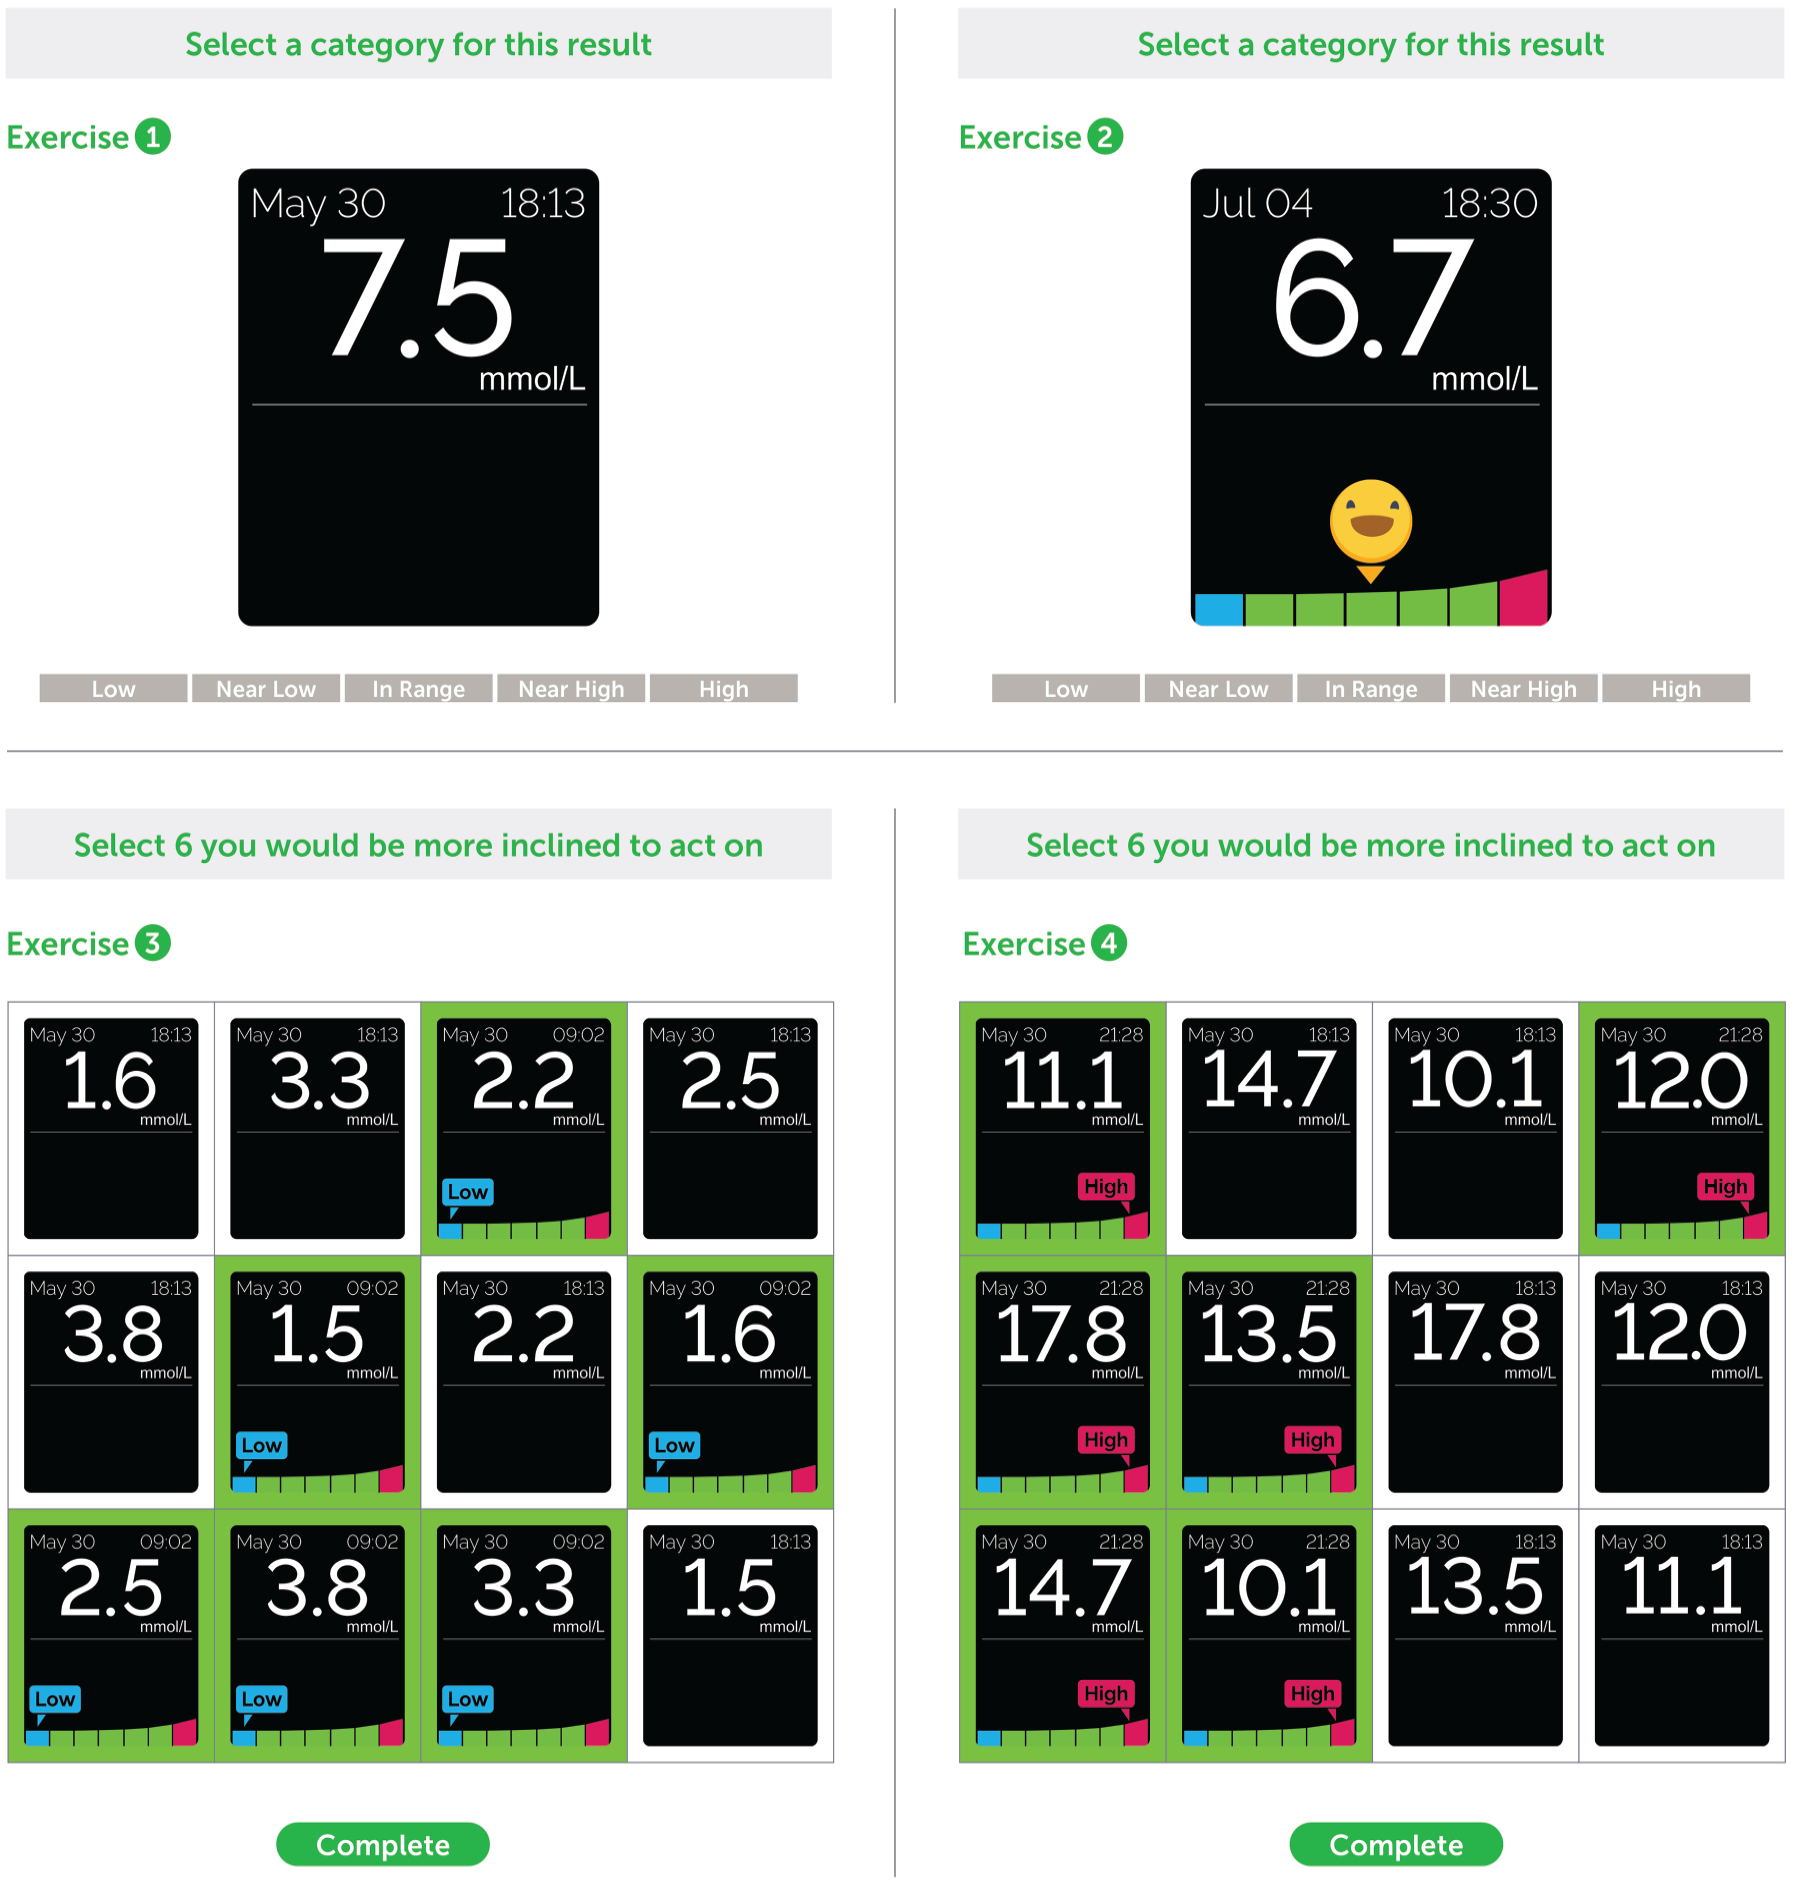
Classifying blood glucose (BG) results and taking action. Exercise 1: 25 BG values in black and white were shown to subjects in random order on a tablet computer and asked if each value was low, near low, in-range, near high, or high glucose values. Exercise 2: The same 25 BG values were shown in random order in association with a dynamic color range indicator (DCRI) and subjects were again asked to decide if values was low, near low, in-range, near high, or high glucose values. Exercise 3: Six pairs of low BG values were presented on a tablet computer in random order. Subjects were asked to click on the six screens showing the value on which they would be more inclined to take action. Exercise 4: A similar exercise was then conducted using six pairs of high BG values in random order. (n = 133 for each exercise).
In exercises 5-8 (Figure 2), the propensity of subjects to take specific actions based on meter displays and the ability to estimate results in ranges with and without DCRI was investigated. Subjects were asked to review a card showing eight screens with a variety of “high” BG messages and to imagine they received these messages during that week. Subjects were then asked to select on the tablet computer any actions (or none) they would have taken based on this information that they would not have taken with their current glucose meter (Table 2). Different lists of five actions were shown depending on whether the subject was an insulin- or non-insulin-user. Similarly, a card showing eight screens with a variety of “low” BG-related messages was also shown. Next, subjects reviewed, without time constraint, a card showing multiple results without DCRI to evaluate how well they could estimate what percentage of results were low, in-range, or high. Three sliders on the tablet computer allowed subjects to select a percentage for each range with the total automatically equaling 100%. Lastly, subjects repeated the same methodology on values with DCRI.
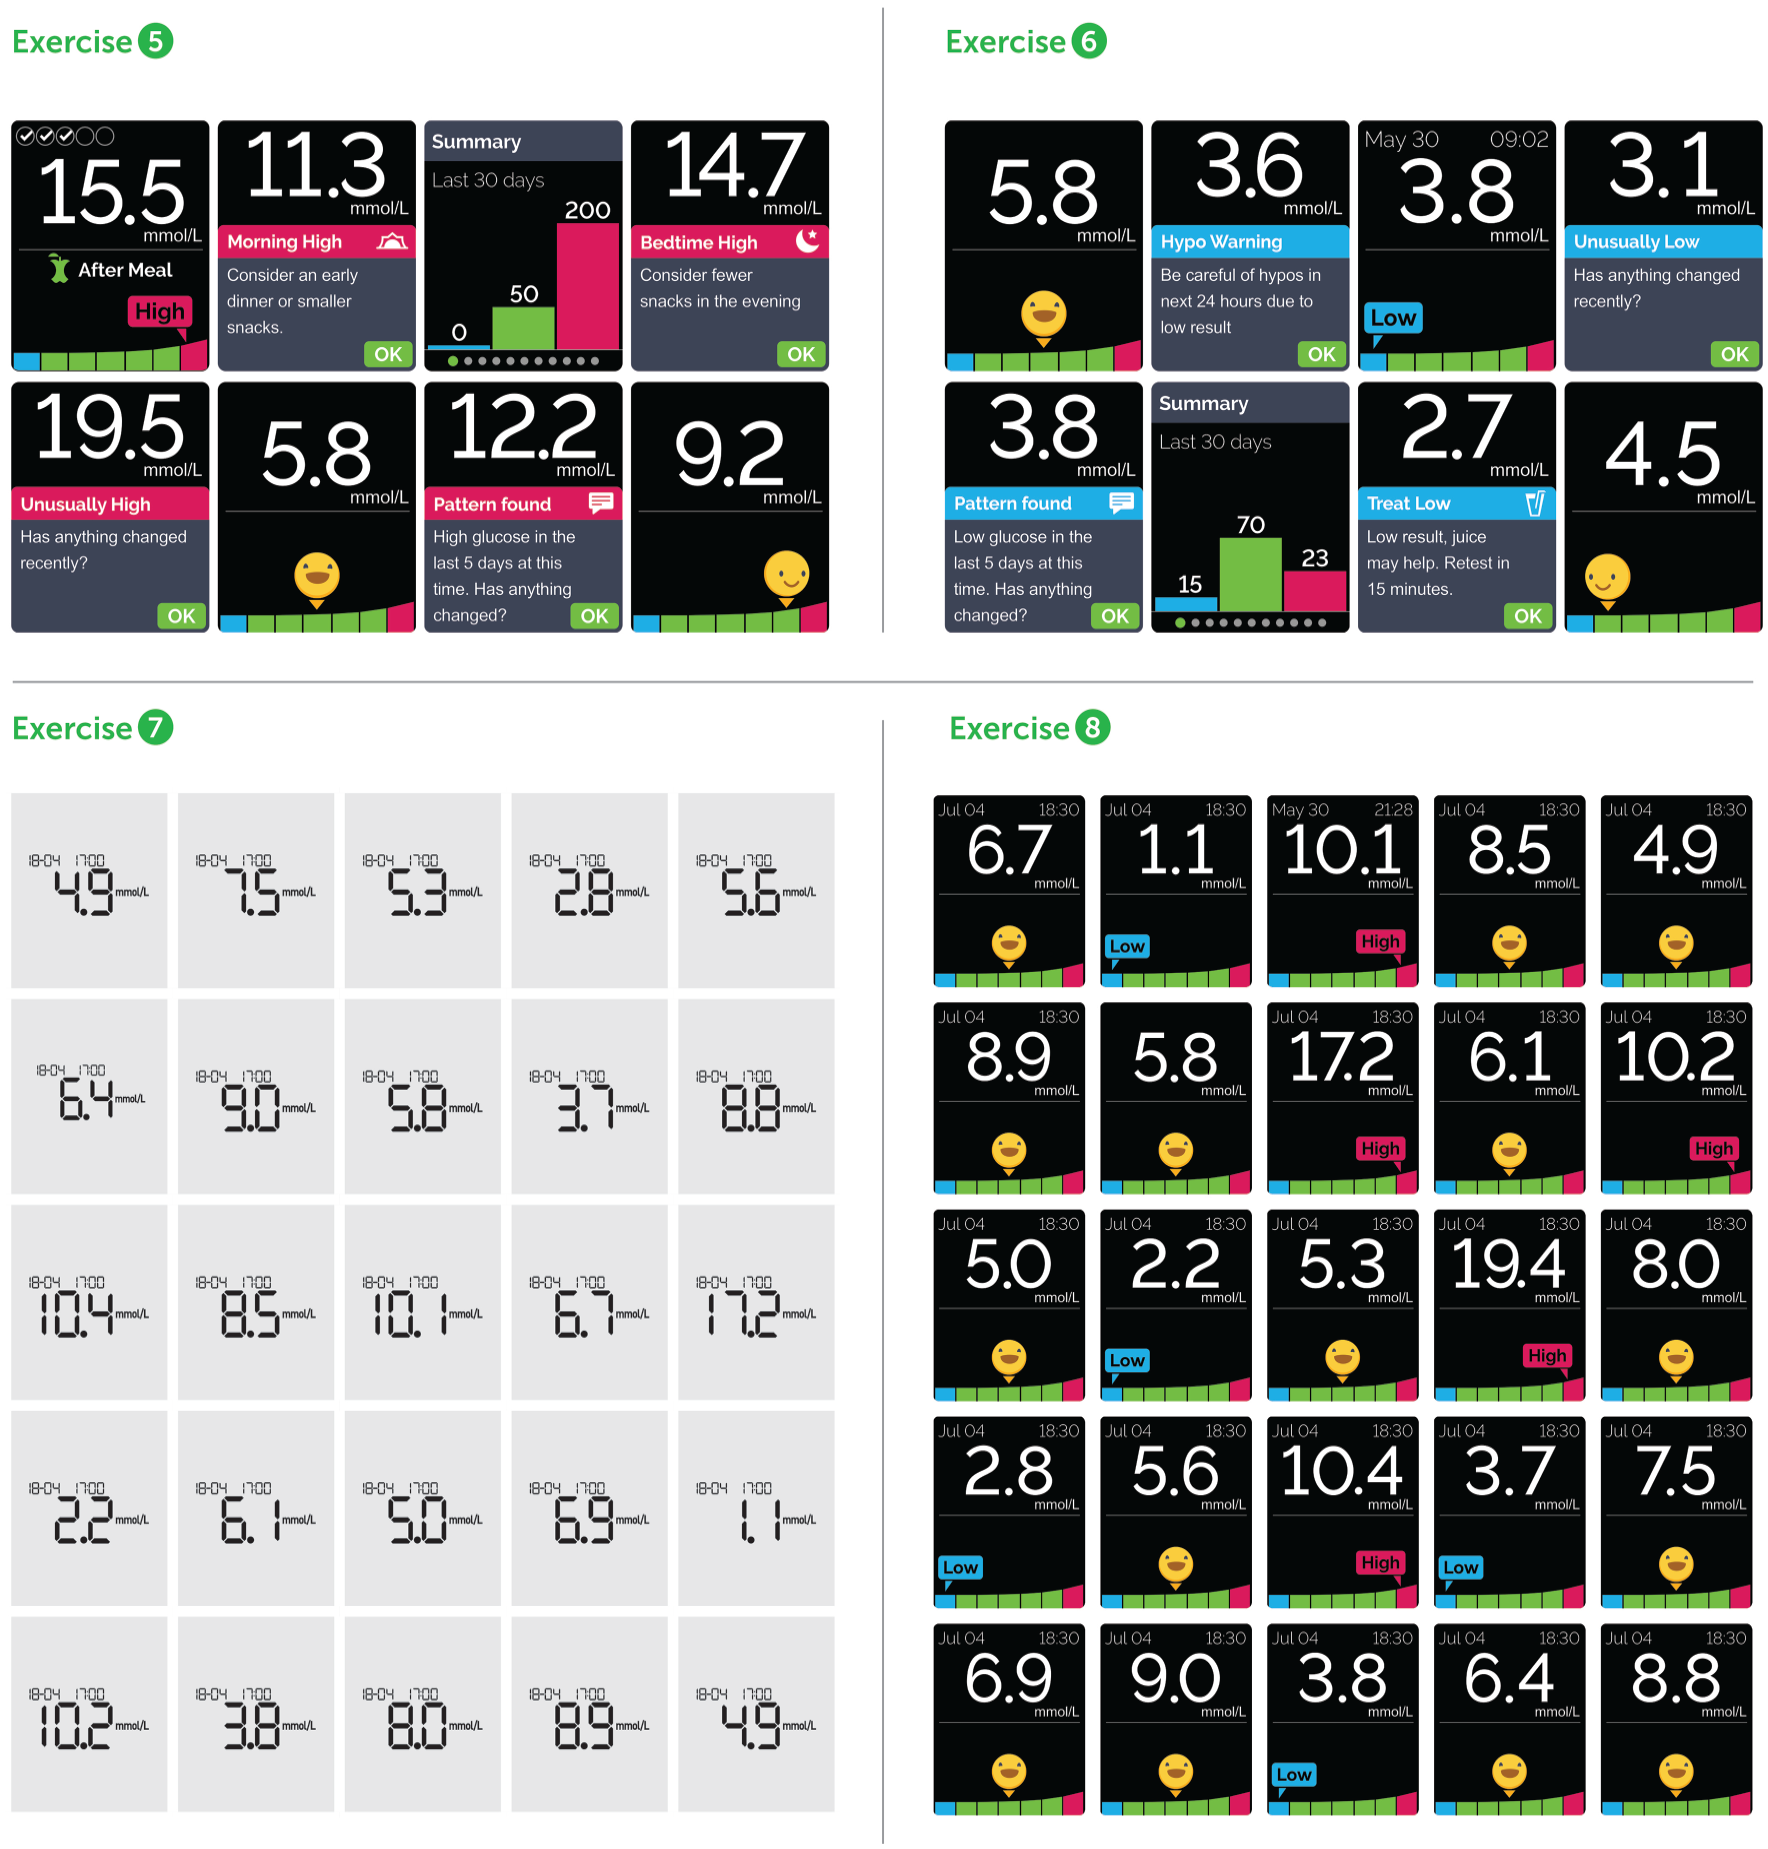
Taking action based on meter messages and estimating glucose range values. Exercise 5: Subjects were presented a card showing “high” blood glucose (BG)-related messages. Subjects were asked to select any actions (or none) they would have taken based on this information that they would not have ordinarily taken with their current meter. Exercise 6: Subjects were presented a card showing “low” BG-related messages. Subjects were again asked to select any actions (or none) they would have taken based on this information that they would not have ordinarily taken with their current meter. Exercise 7: Subjects were asked to review, with no time constraint, a card showing multiple results without dynamic color range indicator (DCRI) to evaluate how well they could estimate what percentage of results were low, in-range or high. Exercise 8: Subjects were then asked to review in a similar manner a card showing multiple results with DCRI and asked to estimate the percentage of results were low, in range or high. (n = 133 for each exercise).
Propensity to Take Specific Actions Based on Meter Displays.
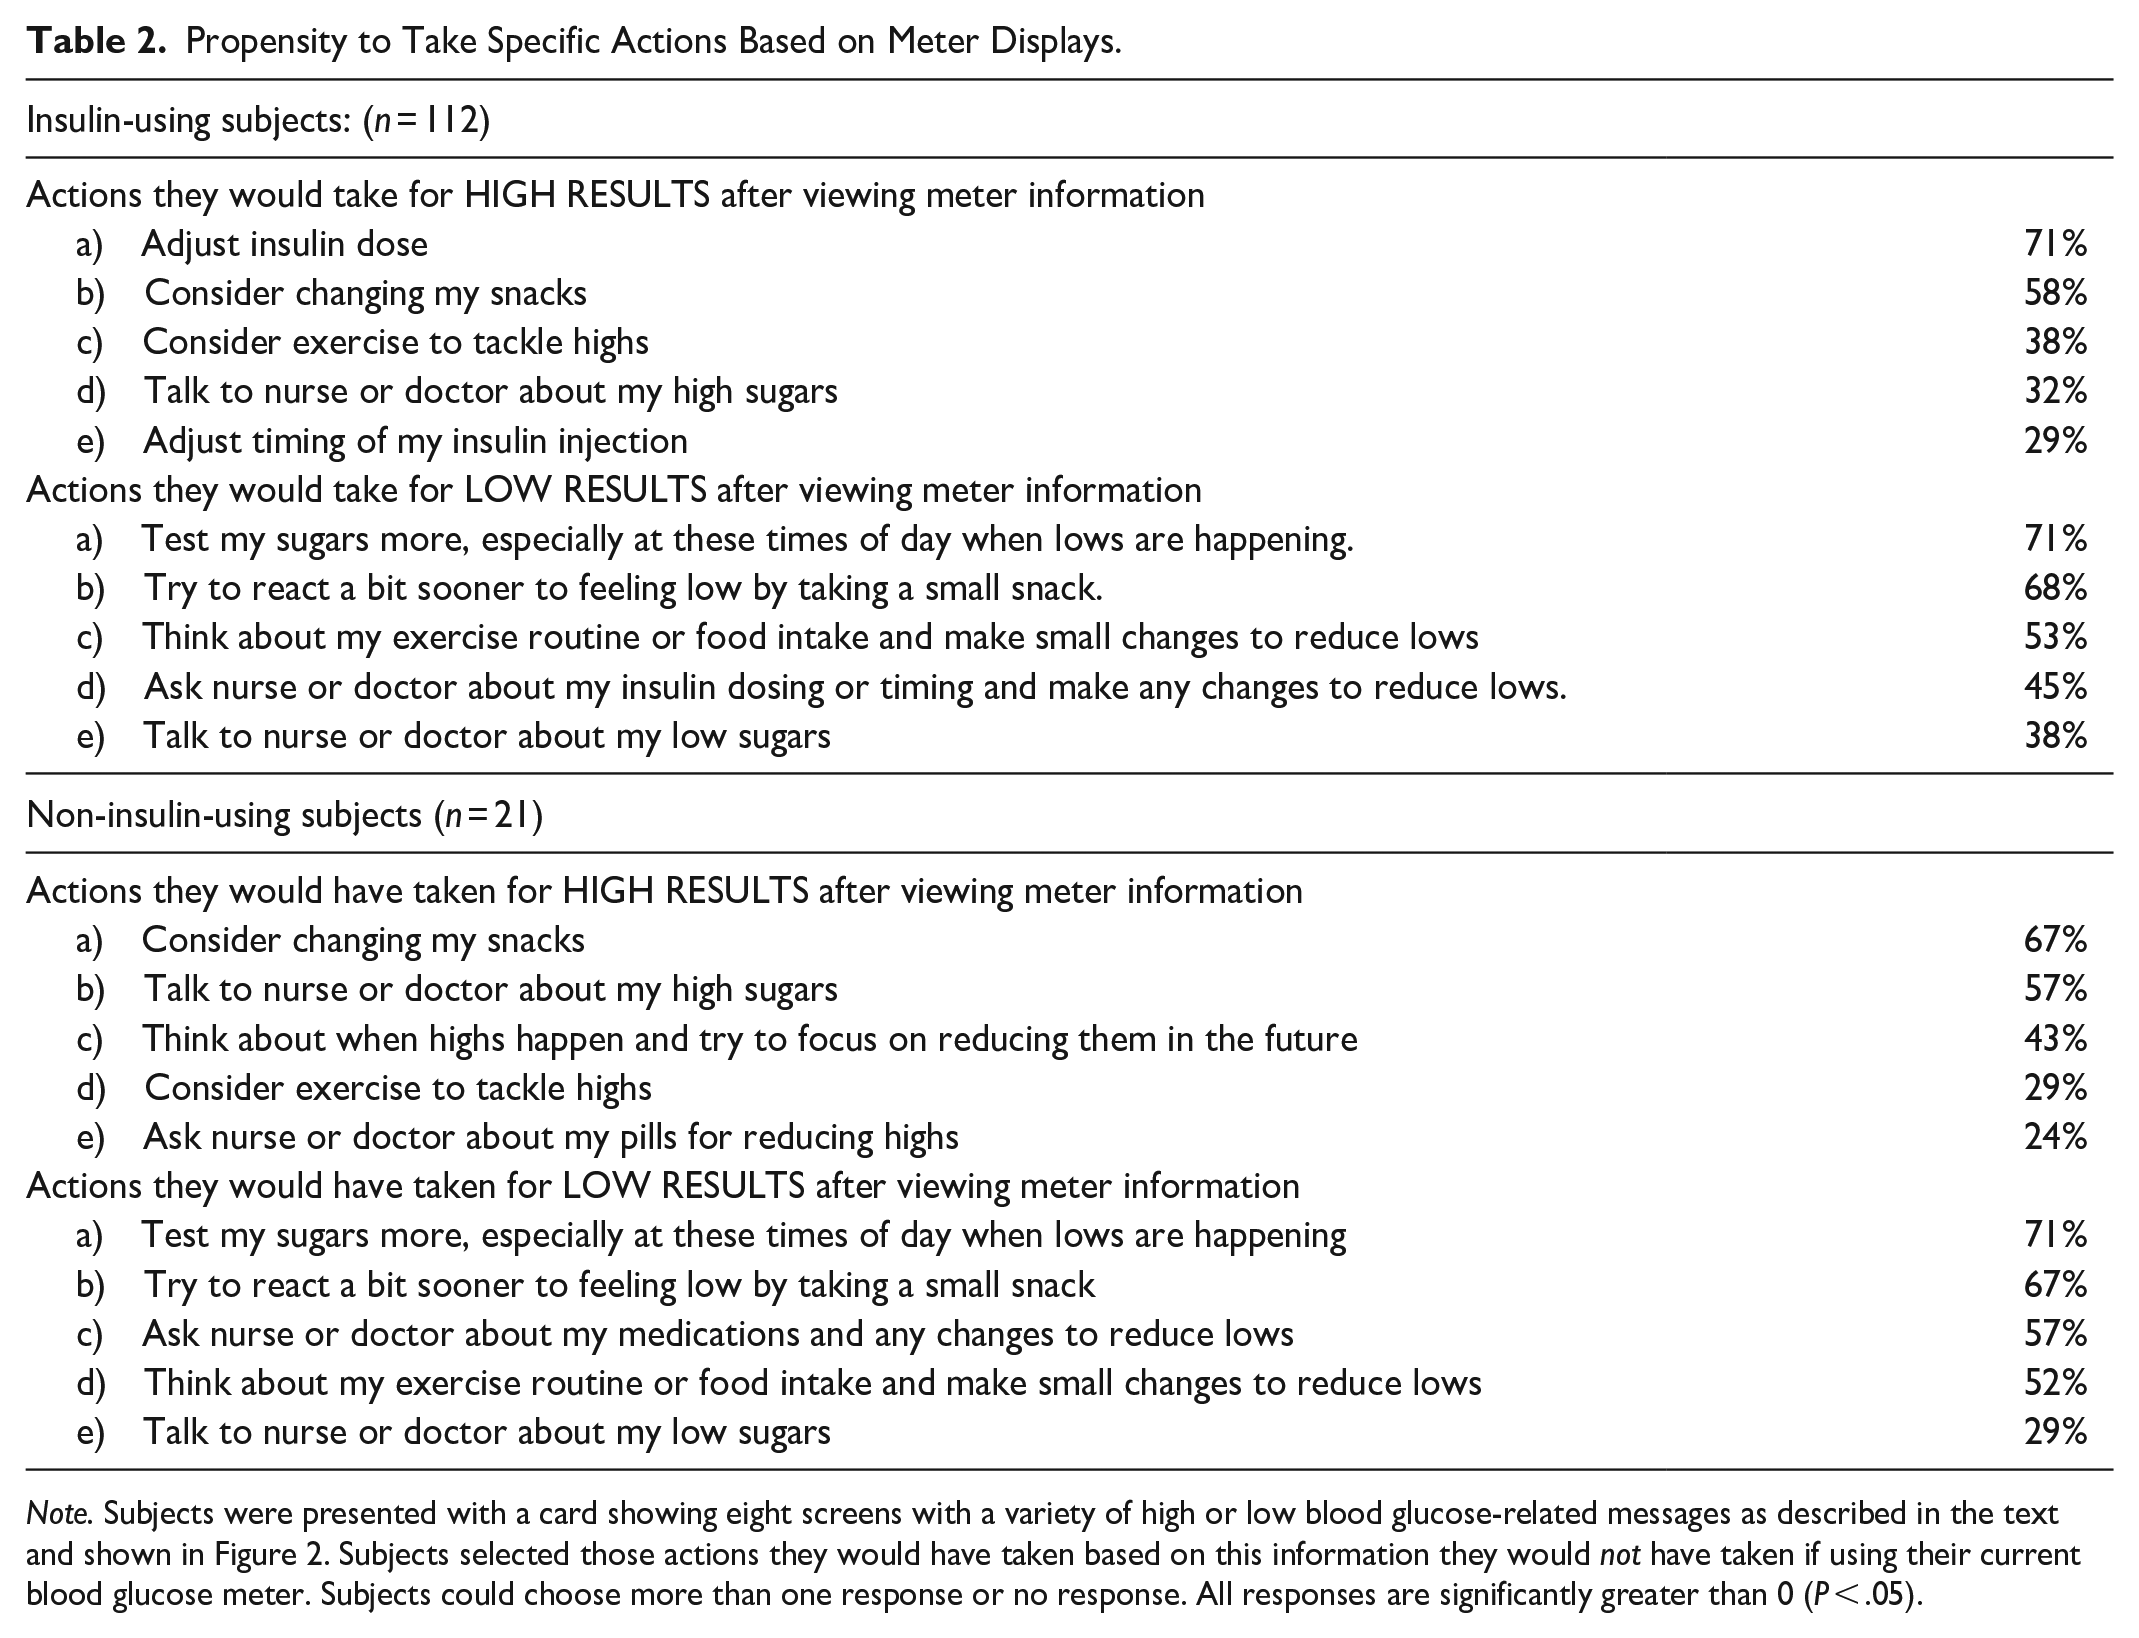
Note. Subjects were presented with a card showing eight screens with a variety of high or low blood glucose-related messages as described in the text and shown in Figure 2. Subjects selected those actions they would have taken based on this information they would not have taken if using their current blood glucose meter. Subjects could choose more than one response or no response. All responses are significantly greater than 0 (P < .05).
After finishing these exercises with unbranded screens, subjects viewed branded animations of the OneTouch Reflect BG meter and answered a series of survey questions (Table 3) regarding features of the product.
Subject Acceptance Survey.
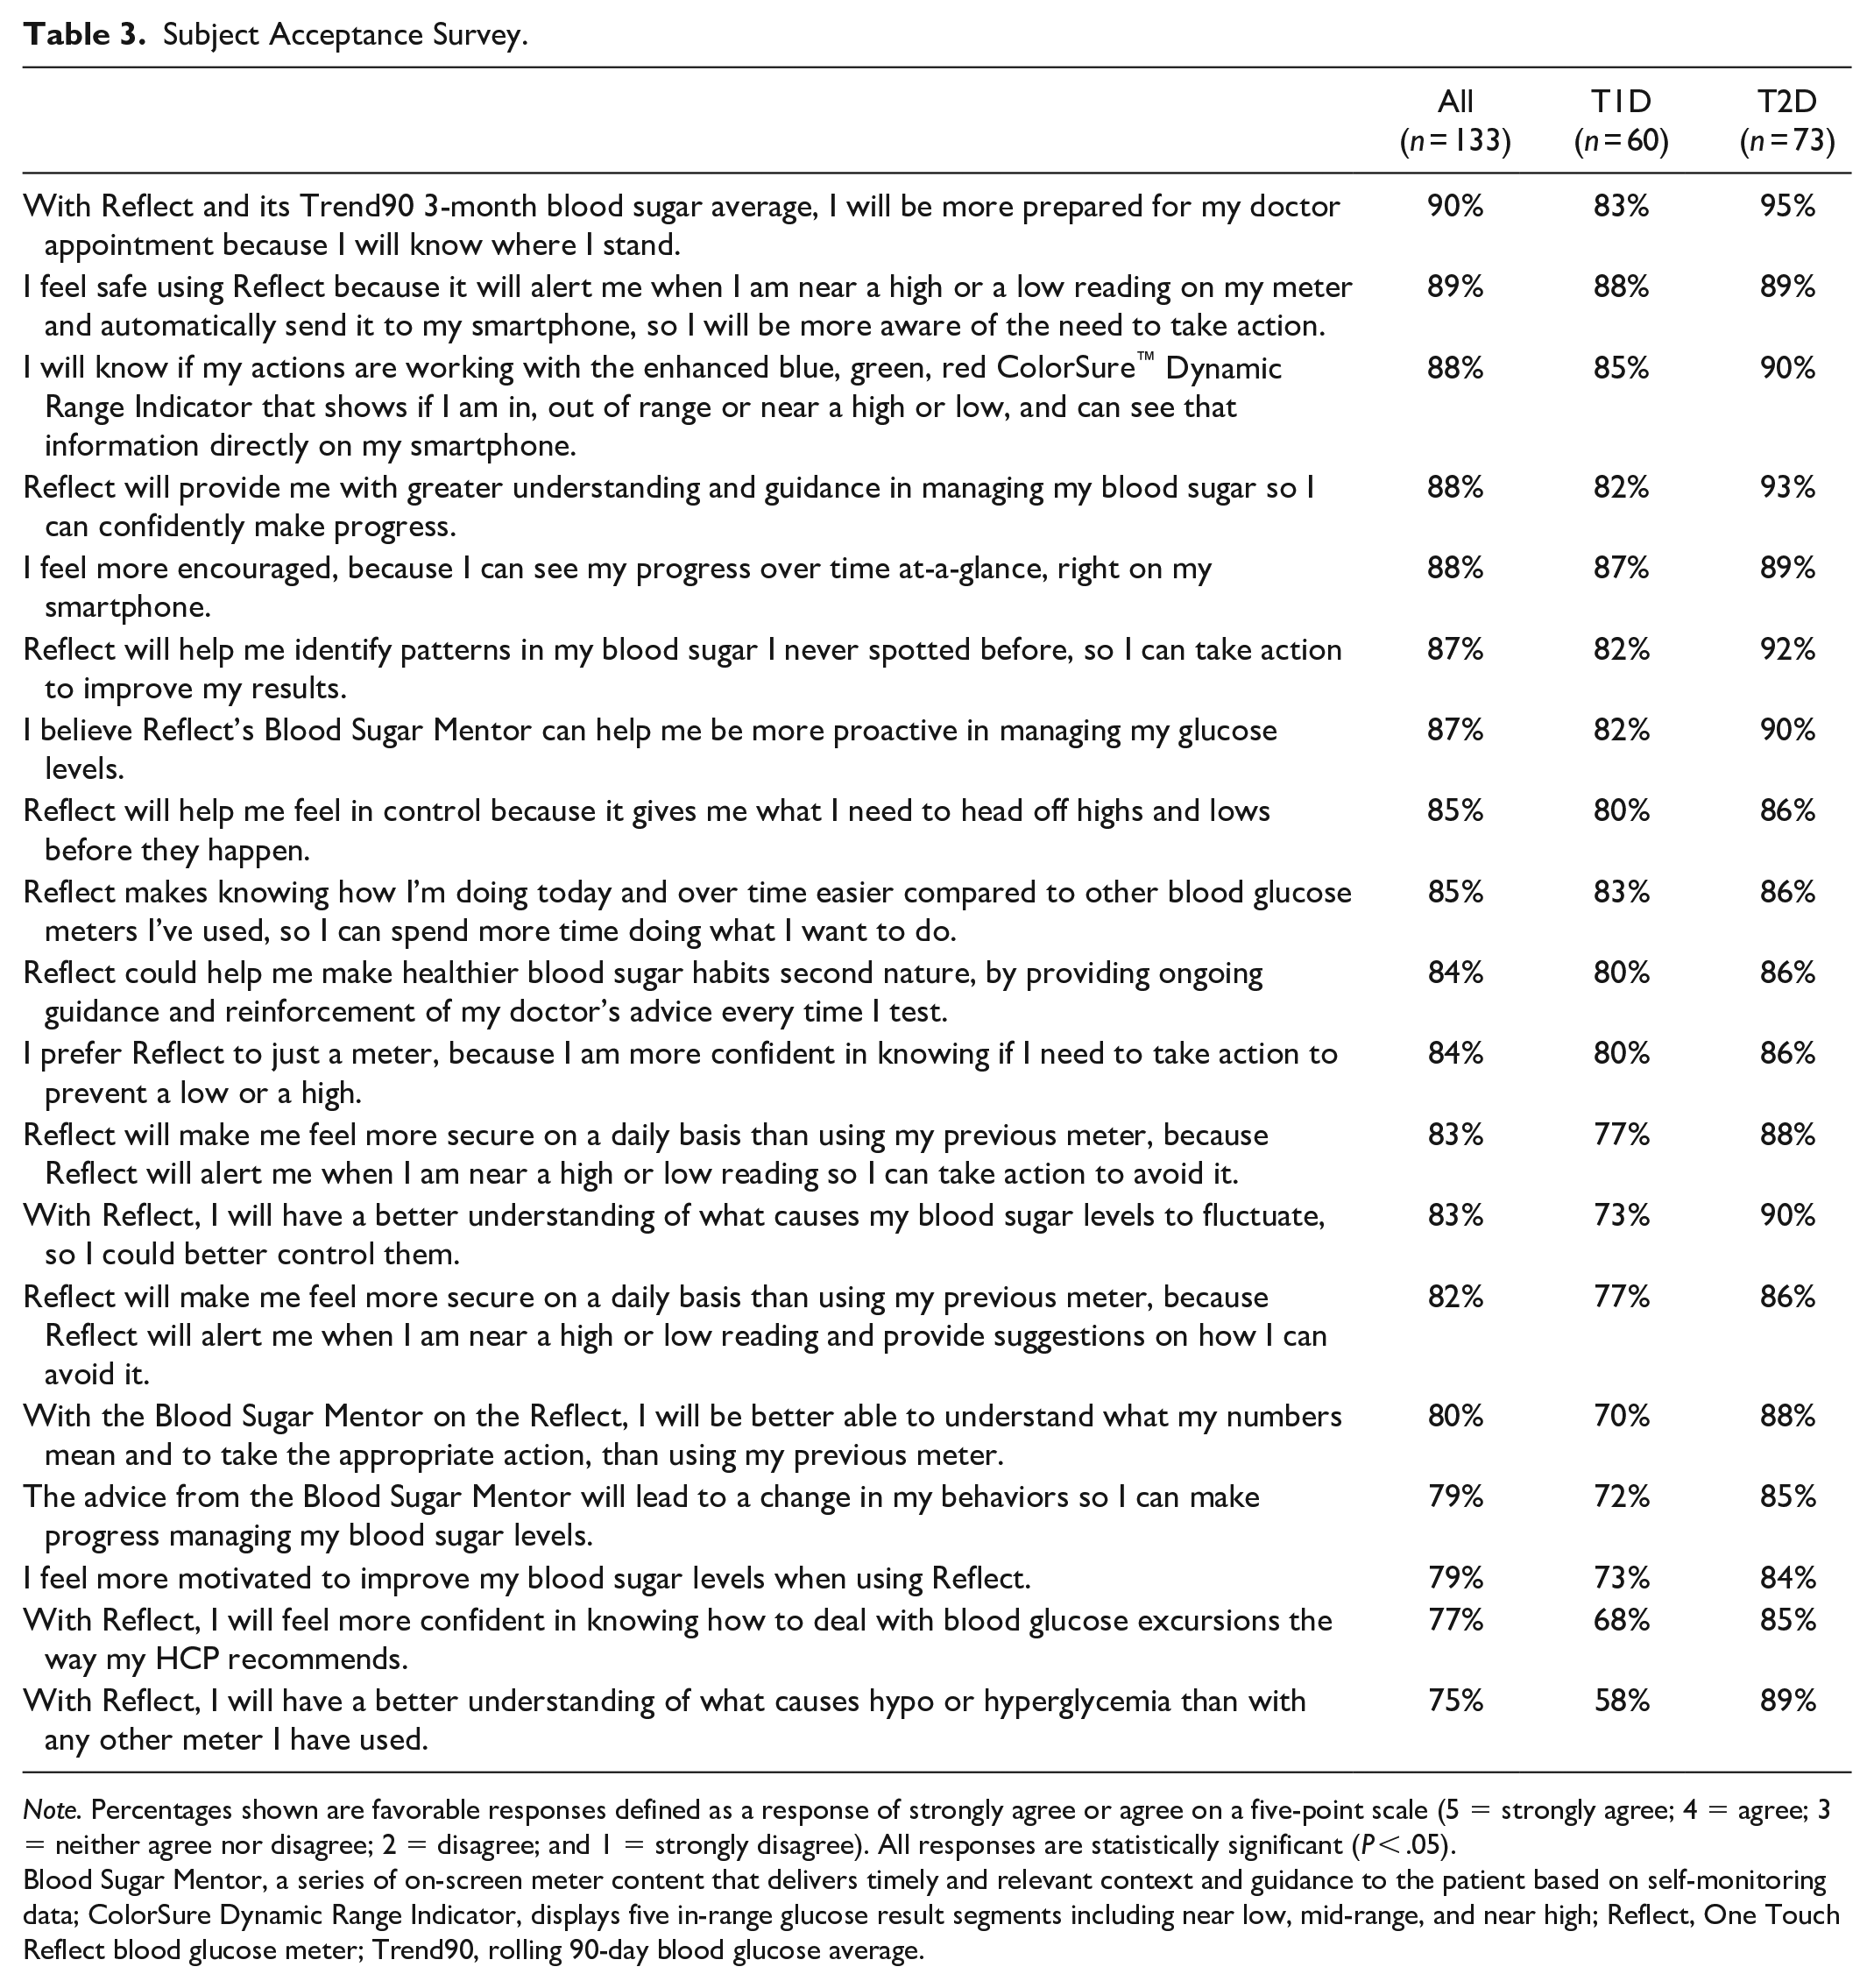
Note. Percentages shown are favorable responses defined as a response of strongly agree or agree on a five-point scale (5 = strongly agree; 4 = agree; 3 = neither agree nor disagree; 2 = disagree; and 1 = strongly disagree). All responses are statistically significant (P < .05).
Blood Sugar Mentor, a series of on-screen meter content that delivers timely and relevant context and guidance to the patient based on self-monitoring data; ColorSure Dynamic Range Indicator, displays five in-range glucose result segments including near low, mid-range, and near high; Reflect, One Touch Reflect blood glucose meter; Trend90, rolling 90-day blood glucose average.
Statistical Analyses
Continuous demographic variables were described as median and range or mean and standard deviation. Categorical demographic variables were described as percentages within categories. Test score changes were calculated as the percentage change from baseline. The null hypothesis “H0: Pre-score = post-score” was tested using a paired t test with significance level α = 0.05. Correlations with A1c and other variables were assessed using the Pearson correlation coefficient and were deemed significant with P value <.05. Minitab 16.1.1 and SPSS 21.0 were used for all analyses.
Results
Prior to conducting any exercises, 87.2% of subjects said they could easily or very easily recognize low or high BG results and 80.4% said they could easily or very easily recognize in-range results when performing SMBG (Figure 3). Less than 5% (low results), 8% (high results), and 7% (in-range results) said these BG results were difficult or very difficult to recognize.
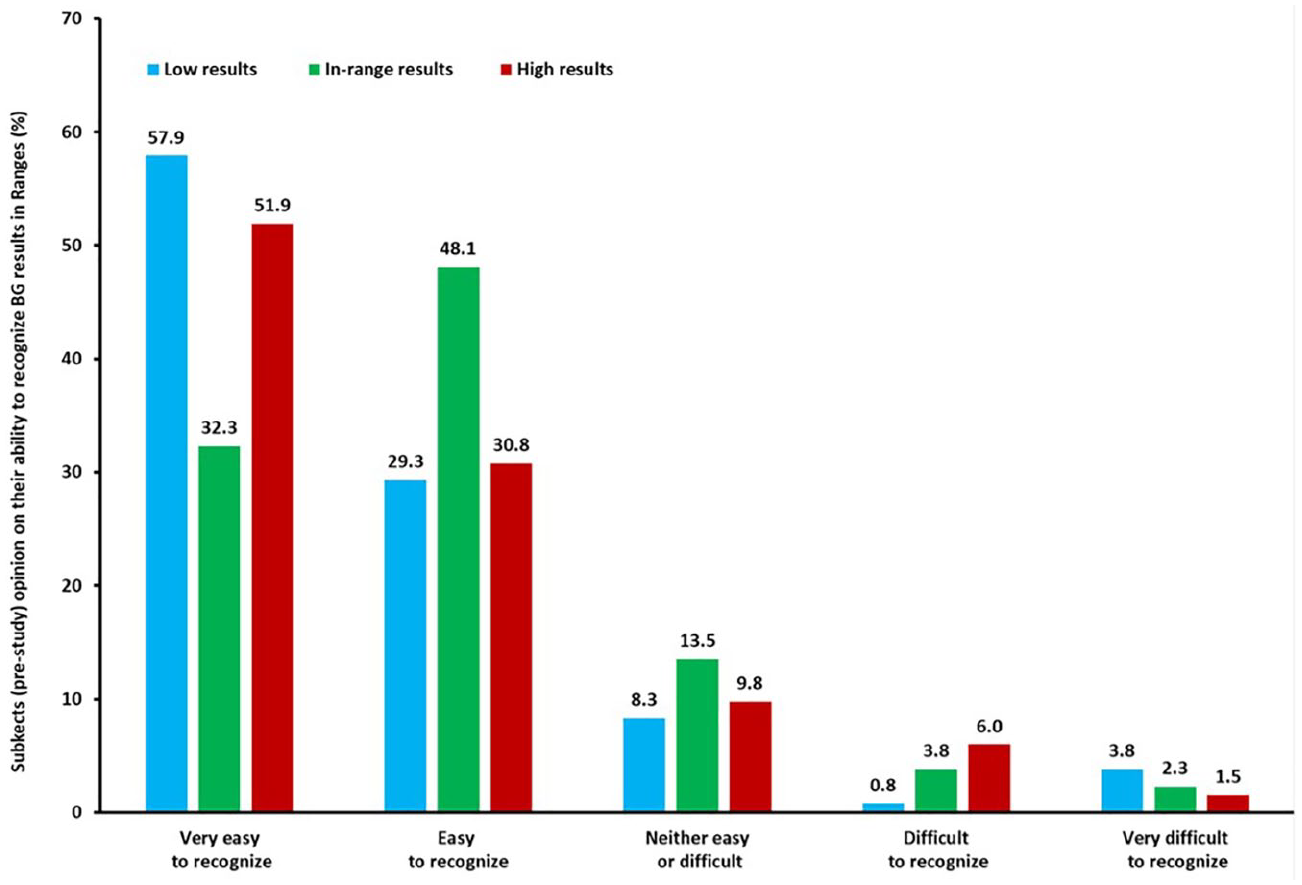
Baseline perceptions of patients on their ability to recognize blood glucose (BG) results. One hundred and thirty three subjects were asked to rate their ability to identify BG results as low, in-range, or high using the categories.
After using the DCRI tool, subjects on average significantly improved their ability to correctly classify readings by 26.0% ± 4.2% (all subjects); 22.0% ± 4.8% (T1D subjects); and 29.3% ± 6.5% (T2D subjects) (all P < .001 [Figure 4]). Notably, subjects with lower than median numeracy exhibited similar improvement in successfully classifying results as subjects with higher than median numeracy (29% vs 23%, respectively). When identical low results were shown with and without DCRI, there was a significant increase in subjects willing to act on results with DCRI (68%) compared to without DCRI (32%) (P < .001) regardless of whether subjects had T1D or T2D (Figure 5). Similar results were seen for high BG values, with 66% of subjects willing to act on high BG results with DCRI compared to 34% without DCRI (P < .001 [Figure 5]), again regardless of whether subjects had T1D or T2D.
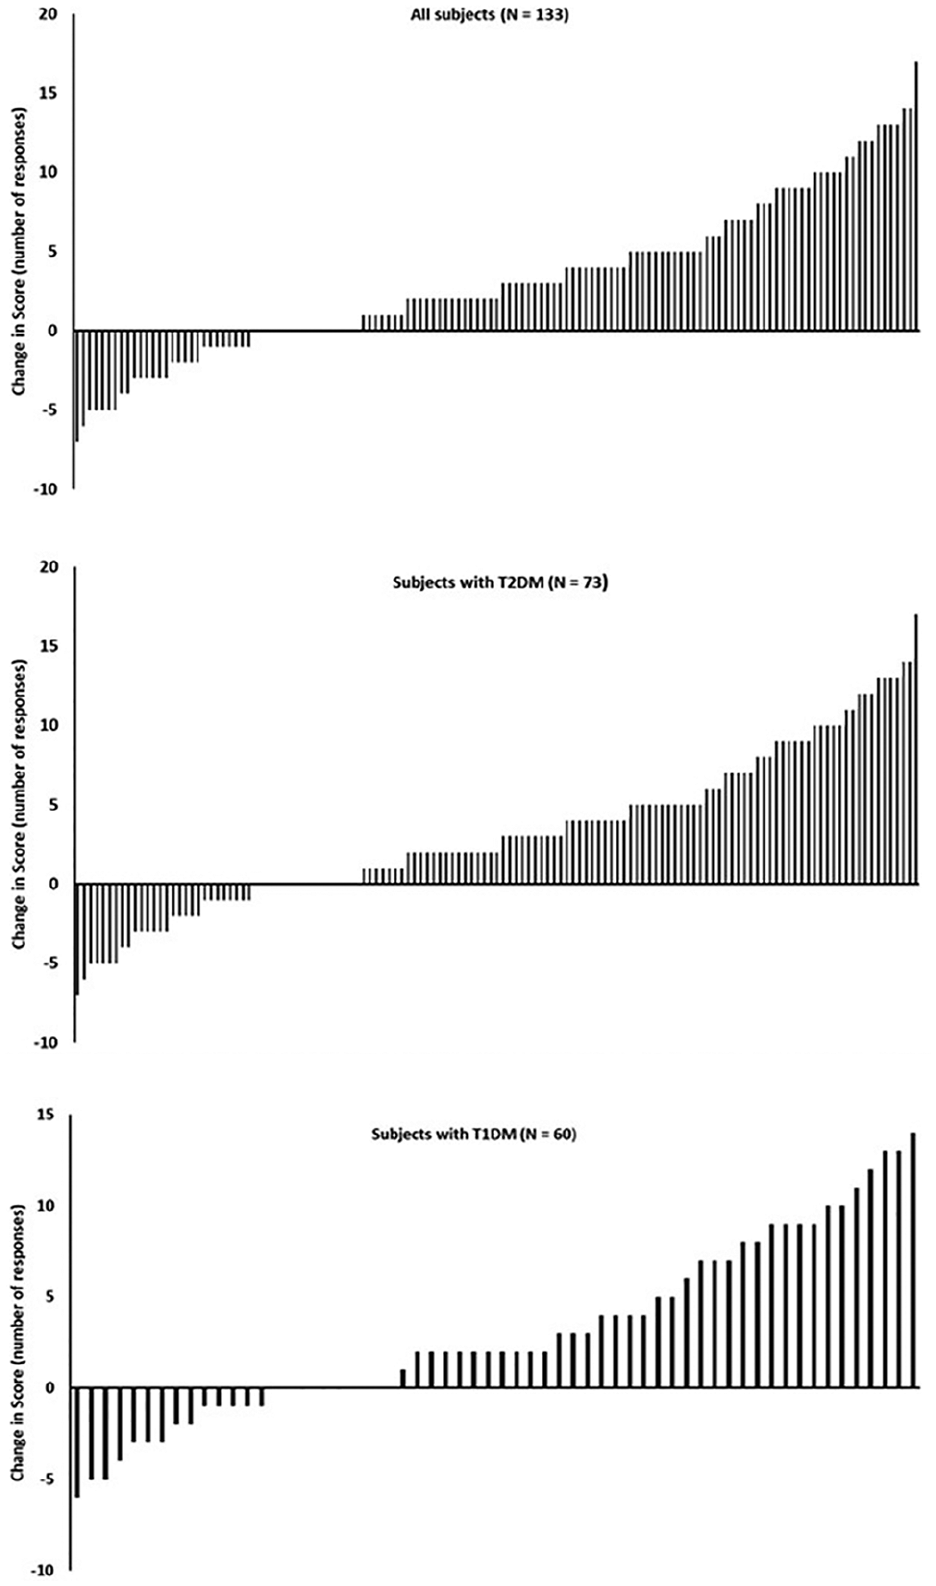
Classifying results with or without a dynamic color range indicator (DCRI)—133 subjects conducted Exercises 1 and 2 as described in the text and shown in Figure 1. Each bar represents an individual subject’s change in correct responses after being shown blood glucose values using a DCRI. Seventeen of 133 subjects had no change in correct responses. Individual results are also shown for subjects with type 2 (n = 73) and type 1 diabetes (n = 60).
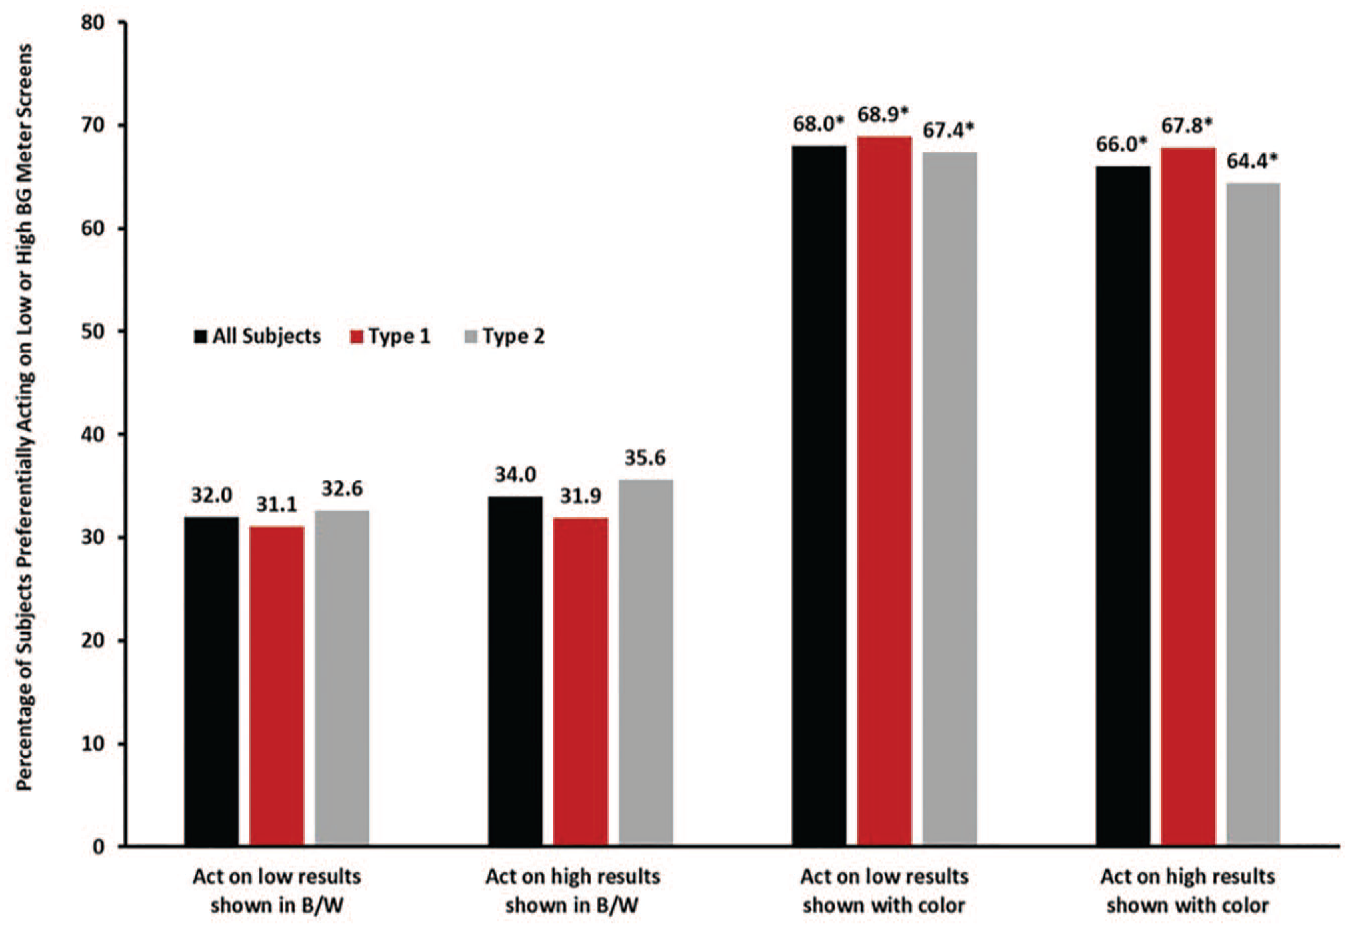
Willingness to act upon identical results shown with or without a color range indicator. Each bar represents the mean percentage of subjects who would act on the blood glucose results shown in Exercises 3 and 4 as described in the text and shown in Figure 1. *Significantly different than blood glucose results shown in black and white (b/w) (P < .001). n = 133 (all subjects), n = 60 (type 1), n = 73 (type 2).
When subjects were asked to consider whether they would be more likely to take specific actions if they received new meter information, 71% of insulin-using subjects ranked “adjusting insulin dose” as a top high result action they would not have taken based on their current meter (Table 2). For non-insulin subjects, the top response was “consider changing their snacks” (67%). Seventy one percent of insulin- and non-insulin subjects ranked “testing my sugars more” as their top low result diabetes management response they would not have taken based on their current meter (Table 2).
When subjects reviewed a grid of 25 BG results shown with DCRI, they were more successful (57%) at correctly identifying low, in-range, and high results in comparison to a grid of BG results without DCRI (26%) (Figure 6). This benefit was apparent whether subjects had T1D or T2D. Interestingly, a statistically higher (P < .001) percentage of subjects with T1D correctly identified the ranges with and without DCRI (68% vs 32%, respectively) compared to T2D subjects (48% vs 21%, respectively).
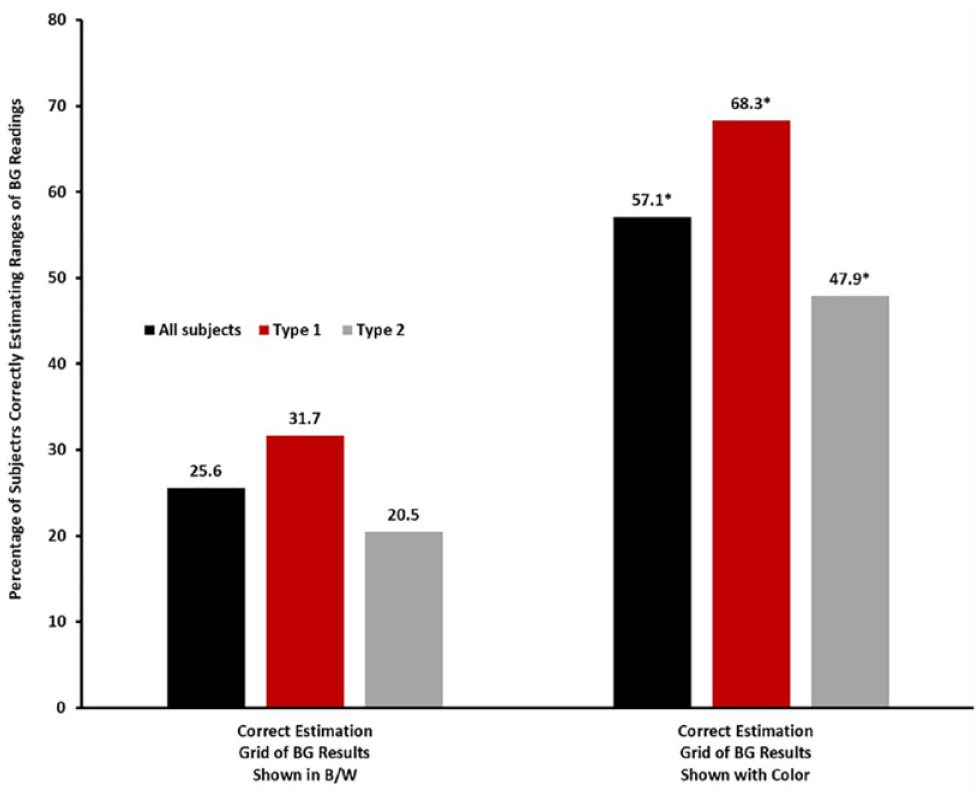
Estimation of blood glucose (BG) results within glucose ranges. Ability of subjects to estimate percentages of results that were low, in-range, or high with or without a dynamic color range indicator (DCRI) in Exercises 7 and 8 as described in the text and shown in Figure 2. Each bar represents the mean of correct estimation. *Significantly different than BG results shown in black and white (b/w) (P < .001). n = 133 (all subjects), n = 60 (type 1), n = 73 (type 2).
When subjects were presented animations of the OneTouch Reflect meter to demonstrate meter features, a high percentage of subjects with T1 and T2D had favorable responses to survey statements regarding meter features (Table 3).
Discussion
People with diabetes believe they can easily identify low, high, and in-range glucose values, but evidence shows that they need to improve their ability to interpret BG information and know what to do with this information. Even in the current study, over 80% of subjects felt they could easily or very easily interpret BG values. However, this study demonstrated that subjects were consistently less competent at identifying BG ranges with results that did not utilize a CRI. These results are similar to a recent study in which use of Contour Next One glucometer, which uses a color range indicator, improved glucose monitoring satisfaction survey scores. 9
Interestingly, a large proportion of the subjects in the current study had been using a Roche Accu-Check meter which does provide context to glucose information. However, these subjects did not perform any more successfully in this study than subjects using other meters. Furthermore, the 14 patients in the current study who previously were using CGM and who arguably might be expected to have greater insight or knowledge concerning data interpretation, did not perform more successfully in exercises than subjects using SMBG only. Admittedly, this is a small sample, but it highlights the importance of addressing patient deficiencies in data comprehension and knowledge before advancing patients to CGM. Moreover, data from a large registry database indicate that glycemic control has not improved significantly in US patients simply by advancing to CGM. 4
In the current study, no prior explanation, training, or introduction on the DCRI were provided to participants. Subjects appeared to intuitively grasp this new way of presenting data whether they self-reported high or low numeracy, and responded positively to the insights provided. Similarly, a previous study evaluating a simple three-color CRI found no correlation between numeracy scores and the ability of patients with T1D or T2D to classify BG results into glucose ranges. 5 A novel aspect of the DCRI is that it allows definition of a glucose result as either “near low” or “near high” with an emoji glancing in the direction of below or above range segments, to allow patients to consider taking action before they become low or high, or simply permit reflection on why “near low” or “near high” results occurred. In surveys, 88% of subjects “felt safe using this new meter because it will alert me when I am near a high or a low reading on my meter” supporting the view that patients may gravitate quickly to this new meter feature.
The variety of BSM guidance, support, and advice screens offered in the new meter were also well received by subjects. Without prior explanation or training before evaluating the screens, subjects said they would be inclined to take additional actions they would not have otherwise taken based on how their current meter presents information. This is similar to the response of patients in a previous study in which they expressed satisfaction with the meter features after a one-week home trial period. 10 Although this experiential design does not prove that patients would react to this extent during extended use, it does provide the basis for potential positive behavioral changes beyond what patients do presently when using meters that do not provide automatic guidance or advice messages in real time. In addition, strong support for the features of the meter was expressed by 355 HCPs including endocrinologists, nurses, and primary care doctors across seven countries. 11
In summary, interaction with a DCRI and BSM screens present in a new BG meter improved the ability of people with T1D and T2D to interpret results and make diabetes management decisions. The beneficial insights and actions expressed by subjects in this study may translate into behavioral changes that could result in improved glycemic control and diabetes management in real-world situations.
Footnotes
Acknowledgements
The authors would like to thank Laura Ritchie and the NHS site staff at each of the UK clinics for study conduct and Vividfix for help with the preparation of selected figures.
Declaration of Conflicting Interests
The author(s) declared the following potential conflicts of interest with respect to the research, authorship, and/or publication of this article: MG and HC are employees of LifeScan Scotland, Ltd. LK is an employee of LifeScan Global Corporation.
Funding
The author(s) disclosed receipt of the following financial support for the research, authorship, and/or publication of this article: This study was funded by LifeScan, Inc.