
Abstract
Background:
Previously we have introduced the eA1c—a new approach to real-time tracking of average glycemia and estimation of HbA1c from infrequent self-monitoring (SMBG) data, which was developed and tested in type 2 diabetes. We now test eA1c in type 1 diabetes and assess its relationship to the hemoglobin glycation index (HGI)—an established predictor of complications and treatment effect.
Methods:
Reanalysis of previously published 12-month data from 120 patients with type 1 diabetes, age 39.15 (14.35) years, 51/69 males/females, baseline HbA1c = 7.99% (1.48), duration of diabetes 20.28 (12.92) years, number SMBG/day = 4.69 (1.84). Surrogate fasting BG and 7-point daily profiles were derived from these unstructured SMBG data and the previously reported eA1c method was applied without any changes. Following the literature, we calculated HGI = HbA1c – (0.009 × Fasting BG + 6.8).
Results:
The correlation of eA1c with reference HbA1c was r = .75, and its deviation from reference was MARD = 7.98%; 95% of all eA1c values fell within ±20% from reference. The HGI was well approximated by a linear combination of the eA1c calibration factors: HGI = 0.007552*θ1 + 0.007645*θ2 – 3.154 (P < .0001); 73% of low versus moderate-high HGIs were correctly classified by the same factors as well.
Conclusions:
The eA1c procedure developed in type 2 diabetes to track in real-time changes in average glycemia and present the results in HbA1c-equivalent units has shown similar performance in type 1 diabetes. The eA1c calibration factors are highly predictive of the HGI, thereby explaining partially the biological variation causing discrepancies between HbA1c and its linear estimates from SMBG data.
In early 2014 we published a new approach to real-time estimation of HbA1c from infrequent self-monitoring (SMBG) data. The method we introduced was designed to track changes in average glycemia and was based on a conceptually new approach to the retrieval of SMBG using a mathematical model to estimate HbA1c as the measurable aggregated effect of the action of an underlying dynamical system which translates ambient blood glucose (BG) levels into HbA1c values through hemoglobin glycation. 1 We adopted this model-based approach because, while it is generally true that HbA1c is roughly proportional to the average BG of a person over the past 2-3 months and a number of linear and nonlinear formulas have been used to describe this relationship,2-11 it is also established that average BG estimated from HbA1c using a linear formula and average BG estimated from SMBG are discordant measures of glycemic control. 12 The discrepancies have been quantified by the hemoglobin glycation index (HGI, equal to observed HbA1c – predicted HbA1c), where the prediction is a linear regression formula based on average BG derived from 7-point daily profiles collected quarterly, 13 or on average fasting BG. 14 Because the regression coefficients were study specific, derived from DCCT data in the case of 7-point profiles 13 or from ACCORD study data in the case of fasting BG, 14 the calculation of the HGI was also study-specific. Nevertheless, it was determined that DCCT patients in the high-HGI group (those with HbA1c higher than the estimate provided by linear regression) had 3 times greater risk of retinopathy and 6 times greater risk of nephropathy compared with the low-HGI group. 13 Similarly, the reanalysis of the ACCORD study data determined that higher total mortality in intensively treated patients was confined to the high-HGI subgroup, and high HGI was associated with a greater risk for hypoglycemia in the standard and intensive treatment groups. Thus, these studies have confirmed the clinical significance of the biological variation in HbA1c that is not explained by linear models using SMBG data. It was further concluded that nonlinear dynamics methods should be employed to approximate HbA1c values instead of proportions based on average BG.
In our previous work, 1 we introduced a dynamical tracking algorithm—a new 2-step procedure that computes real-time estimates of HbA1c (eA1c) from fasting glucose readings, which are updated with any new incoming fasting SMBG data point. The eA1c is first initialized and then calibrated periodically with 7-point daily SMBG profiles taken approximately every month. The eA1c algorithm was developed using training data comprised of daily fasting SMBG readings and monthly 7-point daily profiles collected by patients with type 2 diabetes. 1 Then all model parameters were fixed and the algorithm was applied without further modification to independent test data, also collected in patients with type 2 diabetes. The mean absolute relative difference (MARD)—the metric that is typically used to assess accuracy of any direct measurement or other assessment of unknown analyte—was <7%. Achieving such MARD signified that the method was capable of providing accurate and precise tracking of changes in average glycemia over time. 1 Specifically, the eA1c algorithm tracks average glycemia from SMBG data and then derives eA1c values that could be available daily. The key feature of this approach is that it is capable of working with infrequent SMBG data typical for type 2 diabetes, for example, fasting readings on most days and occasional (monthly) 7-point SMBG profiles. Thus, the eA1c algorithm differed from all previously introduced techniques by its use of an underlying model that “filled in” the gaps between sparse SMBG values, thereby allowing continuous tracing of average glycemia. In this article, we use the exact same method without any parameter alteration to take 3 new steps:
Reconstruct 7-point daily profiles from nonstructured episodic SMBG data, thus eliminating the need for collecting special profiles, provided that sufficient SMBG readings are available
Evaluate the performance of the eA1c algorithm in type 1 diabetes
Correlate the results from the eA1c algorithm with the HGI as defined by Hempe et al 14 to gauge whether eA1c accounts for at least some of the biological variation causing discrepancies between HbA1c and its linear estimates from SMBG data
Methods
Data Set
To validate the eA1c algorithm in type 1 diabetes we used previously published data collected by 120 patients over the course of a 12-month behavioral training. 15 As previously described, the participants in this study had average age 39.15 (SD = 14.35) years, there were 51/69 males/females, the average baseline HbA1c was 7.99% (SD = 1.48), and the average duration of diabetes was 20.28 (SD = 12.92) years. Of these subjects, 32% reported severe hypoglycemia during the year prior to the study, and 47 subjects met the criteria for hypoglycemia unawareness. 15 During the study, subjects were instructed to perform SMBG 4-5 times per day. As a result, the average number of SMBG readings per person per day was 4.69 (SD = 1.84), for a total of 188,219 readings collected during the study. HbA1c was assessed at the baseline and then approximately every 4 months, yielding 457 HbA1c values used for the analyses in this article. All HbA1c values were assayed at the University of Virginia laboratory, thereby eliminating interlab differences. Ninety-seven subjects completed the 12-month protocol and during the study their HbA1c improved to 7.58% (SD = 1.08) as a result of the behavioral training procedure—an improvement that was entirely accounted for by those subjects who had baseline HbA1c > = 8.0% (see Kovatchev et al 15 ; Figure 1). Overall, the behavioral training resulted in sufficiently large changes in HbA1c to allow for adequate testing of the eA1c procedure in type 1 diabetes.
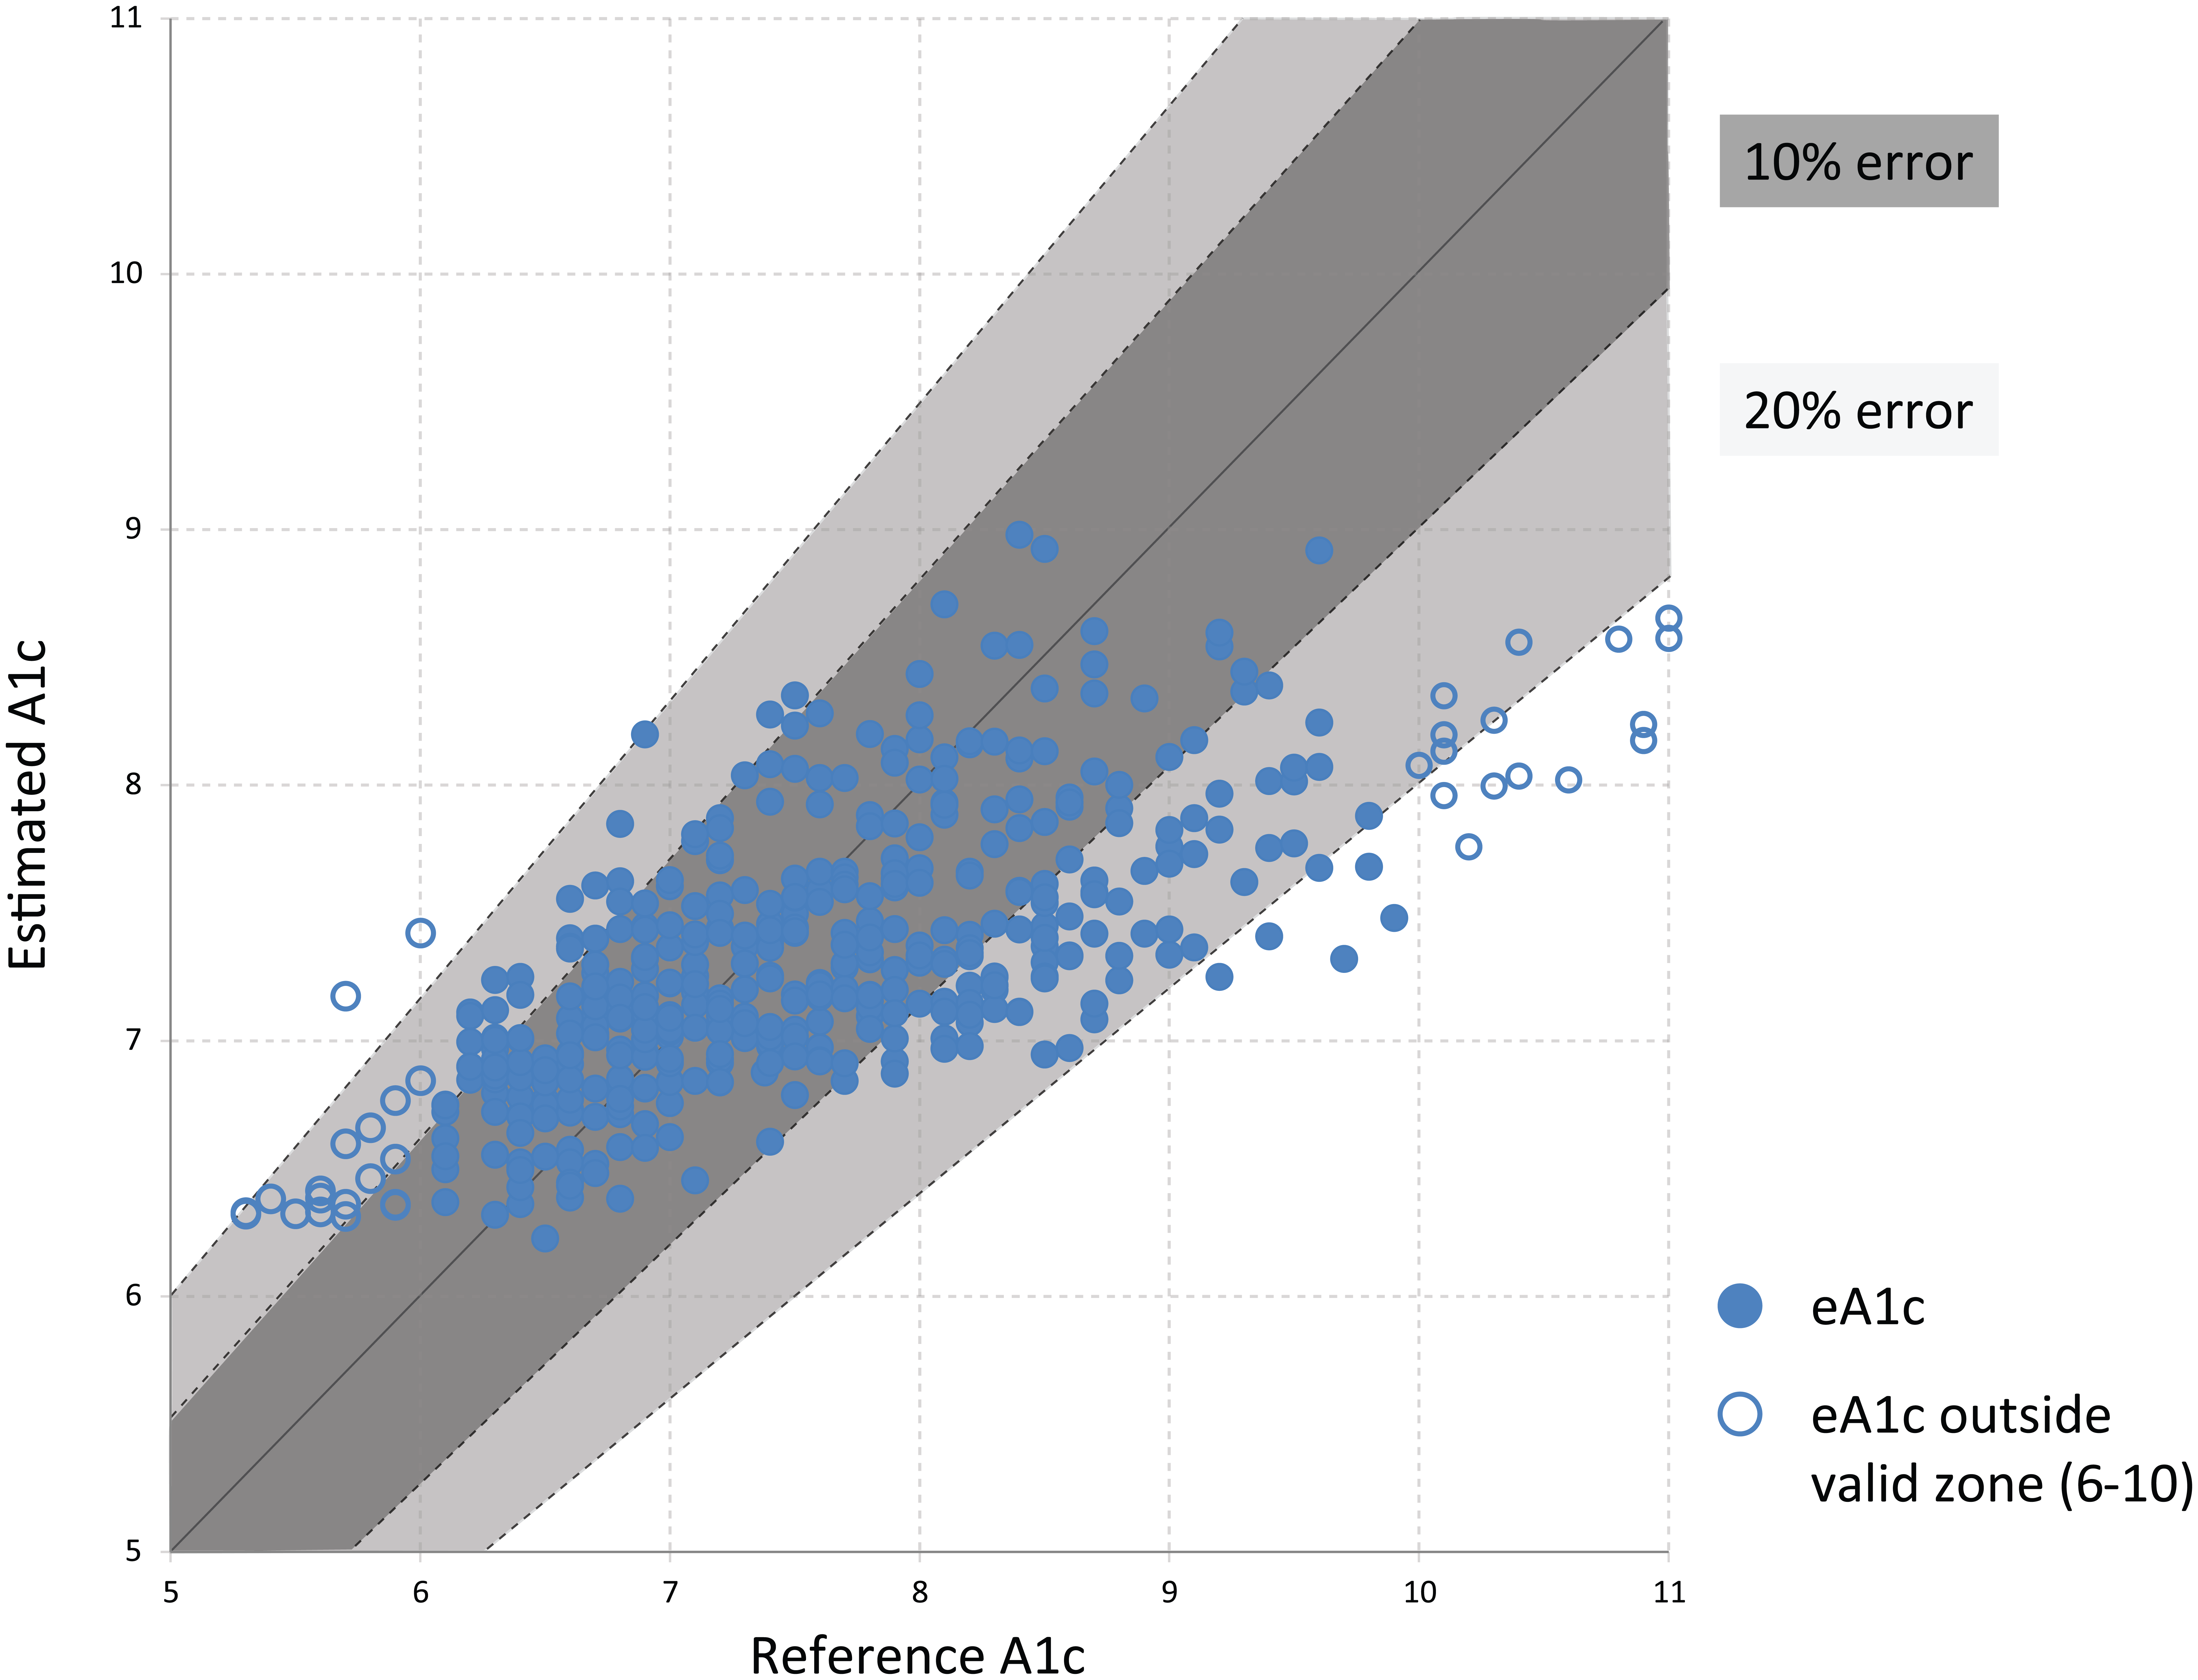
Hemoglobin A1c error grid for the dynamical hemoglobin A1c tracking procedure. The data are stratified by reference hemoglobin A1c values below 6% and above 10% (open circles) and between 6% and 10% (solid circles). A zone: the estimation of A1c (eA1c) is within 10% of reference hemoglobin A1c value or both reference hemoglobin A1c and eA1c are <6% or >10%; B zone: the estimation of A1c (eA1c) is within 20% of reference hemoglobin A1c value.
The eA1c algorithm used here is identical to the previously presented algorithm that was developed and tested in type 2 diabetes. 1 To reiterate, a dynamical model of hemoglobin glycation and clearance was constructed that corresponded to a first order differential equation:
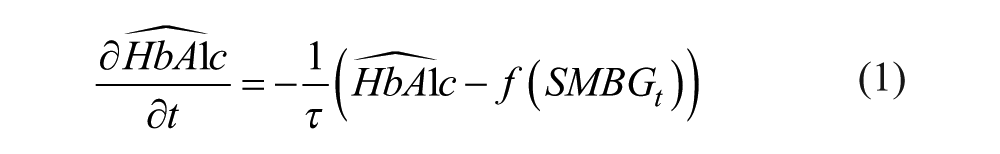
where the function f (SMBGt) is a function using self-monitoring data to track glucose exposure over time. The parameter τ is fixed at τ = 20. The function f (SMBGt) was defined as follows:
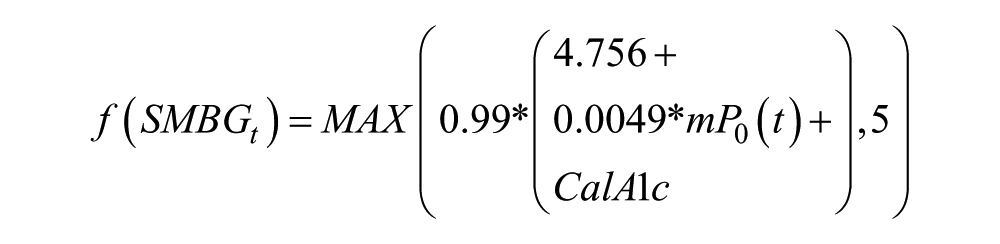
Where: mP0(t) is the average fasting glucose over the past 6 days (current day included) and is updated every time a new fasting glucose is measured. The function f (SMBGt) was originally calibrated using data from 7-point SMBG profiles collected approximately every month. The calibration offset is computed as:

where θ1 and θ2 were the principal components of the 7-point profiles derived via standard data rotation. Because 7-point profiles were not available in the type 1 diabetes data used here, the profiles were reconstructed as described below, after which the iterative eA1c procedure remained the same: First we compute an initial estimate:

Then, we compute daily runtime estimate:

The runtime estimate tracks average glycemia and presents the data in A1c units.
Reconstructing 7-Point Daily Profiles and Fasting BG
While routine SMBG data do not provide specific information whether a reading is taken before or after meal (which would be required for a 7-point profile), data density of 4-5 SMBG readings per day, which is typical for type 1 diabetes, allows for reconstructing daily profiles taking SMBG readings from several sequential days as follows: First, the day was split into 6 time bins: (6:00-10:00), (10:00-13:00), (13:00-16:00), (16:00-19:00), (19:00-21:00), (21:00-0:00). Surrogate for daily fasting glucose was calculated as a 3-day average of SMBG between 6:00-10:00 because these readings were not available every day. Surrogates for 7-point profiles were computed from a week of data as follows: prebreakfast = mean of values falling in the 6:00-10:00h time bin; postbreakfast BG = maximum BG value in the 10:00-13:00h bin; prelunch BG = minimum BG value in that same time bin. Postlunch, pre- or postdinner, and bedtime values were determined as the averages of the (13:00-16:00h), (16:00-19:00h), (19:00-21:00h), and (21:00-0:00h) time bins, respectively.
The HGI was computed as the difference between laboratory HbA1c and predicted HbA1c, where for the prediction we used surrogate fasting BG values and the exact formula proposed by Hempe et al: Predicted HbA1c = 0.009*Fasting BG + 6.8. 14 To keep the HGI results compatible with literature findings, we did not derive new HGI formula using a linear regression in this particular data set.
Data Analysis
Accuracy of the estimation procedure was evaluated in the test data set by computing mean absolute deviation (MAD), MARD, correlation between the estimate eA1c and reference HbA1c, and parameters of the distribution of the eA1c estimation error. Correlations between eA1c and HGI values were computed as well.
Results
Accuracy of eA1c in Type 1 Diabetes
In this data set, the correlation of eA1c with reference HbA1c was r = .75, that is, similar to the correlation previously observed in type 2 diabetes data. 1 The mean absolute and relative deviations were MAD = 0.64 HbA1c units, and MARD = 7.98%. The distribution of estimation errors was as follows: 95% of eA1c values fell within ± 20% from reference and 51% of all eA1c values fell within ± 7% from reference corresponding to roughly half of the eA1c values within ± 0.5 HbA1c units of the laboratory value. Figure 1 presents the HbA1c error-grid plot for eA1c in type 1 diabetes data stratified by reference HbA1c values below 6% and above 10% (open circles) and between 6-10% (closed circles). A total of 67.66% of all eA1c values fell within 10% from reference HbA1c (A zone) and 95.4% fell within 20% from reference (A+B zones). If limited to a reportable HbA1c range (6-10%), the accuracy of eA1c was 72.8% (A zone) and 98.6% (A+B zones). In terms of eA1c trend, there was no difference in the distributions of the HbA1c daily rate of change observed in reference HbA1c values and in eA1c values, with 95% of all estimated trends within ± 0.02 HbA1c units/day from reference and 81% of all estimated trends within ± 0.01 HbA1c units/day from reference.
Comparison to Established Linear Methods
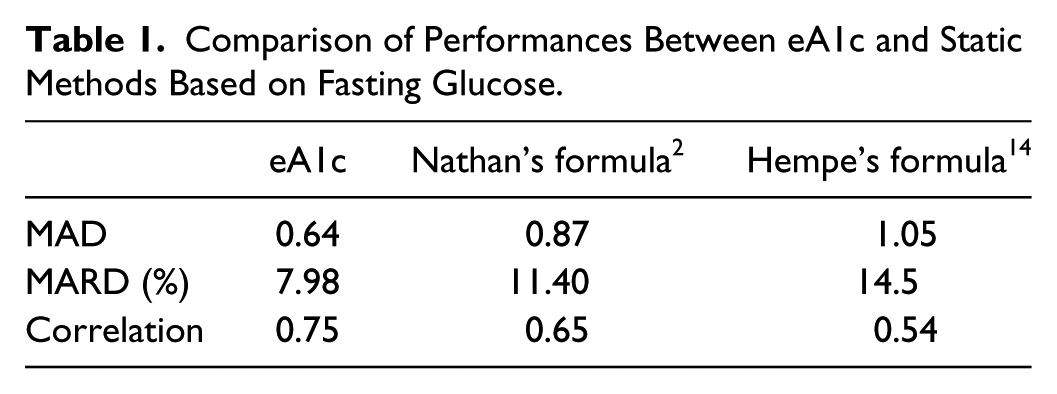
To compare the accuracy of eA1c to established linear formulas, we used 2 previously published linear approximations: the inverse of Nathan’s formula translating the A1C assay into estimated average glucose values 2 and the formula introduced by Hempe et al, 14 which uses only fasting BG readings to estimate HbA1c. We kept unchanged the coefficient introduced in the original publications and computed MAD, MARD, and correlations with reference HbA1c of eA1c and the 2 linear estimates. Table 1 summarizes the results.
Comparison of Performances Between eA1c and Static Methods Based on Fasting Glucose.
Robustness Analysis
Stratifying the data by reference HbA1c, the dynamical method was most accurate in the 7-8% HbA1c range, with minimal bias and 4.6% MARD (Table 2). Bias of eA1c was mostly below 1% HbA1c and MARD ≤10%, but for the 9-10 categories, in which we had limited data. Stratifying the data by eA1c and not reporting values below 6% and above 10% resulted in HbA1c biases between −0.66% and 0.07% and MARDs between 6.74% and 10.3%. Performance at the initial eA1c for each subject was similar to overall performance (MARD 8.49% vs 7.98%; MAD 0.71 vs 0.65). The larger initial MAD was not associated with the initial HbA1c values being significantly higher than subsequent values (7.71% vs 7.59%, ns).
Performance of the eAc1 Algorithm by HbA1c and eA1c Ranges.
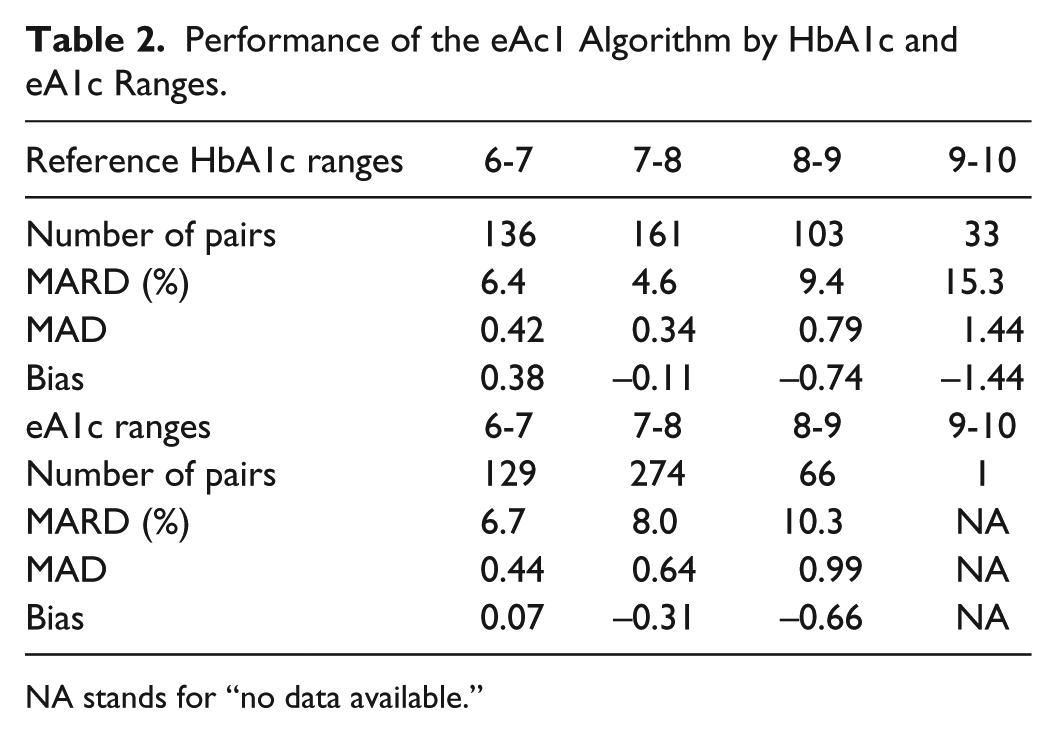
NA stands for “no data available.”
Relationship Between HGI and eA1c
To determine whether the calibration factors of eA1c can predict the difference between lab HbA1c and Hempe’s linear model, 14 we performed a regression of HGI with the calibration factors θ1 and θ2, which resulted in a highly significant linear model (F = 158.4, P < .0001) and multiple r = .63 (R2 = .40). This suggests that HGI can be approximated by the following linear combination of the eA1c calibration factors: HGI = 0.007552*θ1 + 0.007645*θ2 – 3.154. In addition, the direct correlation between HGI and eA1c was .51, P < .001. The low versus moderate-high HGI groups defined by Hempe et al as HGI ≤ –0.520, versus HGI > –0.520 were predicted by discriminant analysis using θ1 and θ2, which resulted in a highly significant discriminant model (chi-square = 133.1, P < .0001) and correct overall classification of 73%. The correct classification of the low HGI group was 78.5% and of the moderate-high HGI subgroup was 63.4%. We should note that the distribution of low-moderate-high HGI in this population was different than the distribution in the original article where these subgroups were defined by the sample tertiles: 14 here we observed 63%, 18%, 19%, low, moderate, high HGI, respectively. Thus, the biological variation causing discrepancies between HbA1c and its linear estimates from SMBG data can be at least partially explained by the eA1c calibration factors.
Discussion
Without changing a previously reported dynamical tracking eA1c Algorithm developed in a population of people with type 2 diabetes, we tested its ability to track HbA1c in a group of 120 patients with type 1 diabetes who were observed over a year as part of a behavioral intervention study. We have confirmed that the eA1c procedure works as designed and produces results similar to those achieved in the original type 2 population. The slight increase in MARD observed here is attributed to the significant departure of the structure of the data in hand from the data structure in our original studies. Specifically, the original algorithm design was based on daily fasting BGs and occasional (monthly) 7-point BG profiles taken at pre-post meal times and used for calibration of the fasting eA1c trace. Here, 7-point profiles were not available and there was no indication which SMBG readings were fasting, premeal, or postmeal. To compensate for this data deficiency, we reconstructed surrogate daily profiles using time bins that were for all subjects. The time bins were filled up with available SMBG readings acquired over 7 consecutive days of observation (3 days for fasting BG) and were then used in the exact same way as the 7-point profiles of the original algorithm. In addition to being necessary in this data set, such an approach allows the collection of structured 7-point daily profiles (which was found inconvenient by some users) to be abandoned and replaced by appropriate binning of routine SMBG data, provided that sufficient BG readings are collected to aggregate a profile over time (eg, 7 days). Moreover, structured “profile days” would become unnecessary and the profiles can be constructed and tracked on weekly basis. Given the need for a calibration profile approximately once a month as established by our original work, we can now speculate that routine SMBG yielding 1 week out of 5 weeks with good “profile-grade” data would be sufficient to run the eA1c estimation procedure without structured profile entries.
Despite the arbitrary interpretation of the available SMBG data, the eA1c procedure held its accuracy. Thus, the findings of this article can be viewed not only as a validation of the eA1c estimate in type 1 diabetes, but also as a test of the robustness of the procedure under extreme unstructured data conditions. The key to this level of robustness is our conceptually new approach to the retrieval of SMBG data: using compartmental modeling, we constructed a 2-step algorithm that includes real-time eA1c from fasting glucose readings, updated with any new incoming fasting SMBG data point, and initialization and calibration of the estimated HbA1c trace with daily SMBG profiles taken approximately every month. The model was originally developed using training data, then fixed and applied to independent test data, both of which were collected in type 2 diabetes. Now the eA1c is translated without any further changes to type 1 diabetes as well.
As in our previous article, we compared the eA1c procedure to established linear methods and verified that its accuracy in approximating laboratory HbA1c was still higher. We took this comparison 1 step further and evaluated the relationship between eA1c and the HGI (hemoglobin glycation index) in this population using the original HGI formula and cutoff points proposed by Hempe et al. 14 We found that the 2 factors used to calibrate the eA1c algorithm are highly (and equally) related to the HGI. Used in a regression or discriminant predictive models, these factors resulted not only in statistically significant relationships, but also in 73% accurate classification rate of low- versus moderate-high HGI groups. This would suggest that these factors (which are based on routine SMBG data alone) could be used as surrogate classifiers for low- versus moderate-high HGI. Given the clinical significance of the HGI for both prediction of complications of diabetes 13 and prediction of the effectiveness of diabetes treatment, 14 the ability to track HGI state in real time from routine SMBG opens new possibilities for patient assessment and fine-tuning of treatment aggressiveness. Such an application of the eA1c calibration factors is consistent with the original intent of the eA1c procedure: it is a method for tracking changes in average glycemia in-between laboratory HbA1c assessments.
The clinical utility of this method lies in its ability to present daily estimates of HbA1c and therefore trends in this most important marker of glycemic control, which in turn can result in patient motivation to pursue intensified treatment, or to identify which activities and lifestyle specifics are beneficial for better control of average glycemia. While routine laboratory HbA1c measurements are taken once every few months, this practice is not necessarily conducive to tracking of glucose control and of enhanced patient motivation to optimize their daily routine—the lab sampling of HbA1c is indeed a gold standard for assessment of glycemic control, but is too infrequent to serve as real-time motivation for behavioral changes and treatment optimization. With the advent of continuous glucose monitoring (CGM), the availability of frequent BG determination increases. We can speculate that the current formula would work with CGM as well: as shown in this article, defining appropriate bins for the data that produce a reasonably good daily profile is sufficient for the method to be adequately accurate. With CGM data, the daily profile is almost given (with some sensor noise and inaccuracy); thus the application of this method should be straightforward. However, we should keep in mind that the CGM time series provide data density that is well beyond the data density carried by fingersticks; thus, we can also speculate that deriving a new HbA1c tracking procedure using CGM data would be of interest, and would be more precise than the method described here.
Conclusions
The eA1c procedure developed in type 2 diabetes to track in real-time changes in average glycemia and present the results in HbA1c-equivalent units has now demonstrated strong performance in type 1 diabetes. In the process, 2 new findings have emerged: (1) appropriate aggregation of routine SMBG data into time bins would eliminate the need for taking structured 7-point SMBG profiles once a month, and (2) the calibration factors of the eA1c estimation procedure are highly predictive of the HGI, which opens possibilities for tracking the clinically relevant HGI in real time as well.
Footnotes
Abbreviations
BG, blood glucose; CGM, continuous glucose monitoring; eA1c, estimated HbA1c; HbA1c, hemoglobin A1c; HGI, hemoglobin glycation index; MAD, mean absolute deviation; MARD, mean absolute relative difference; SD, standard deviation; SMBG, self-monitored blood glucose.
Declaration of Conflicting Interests
The author(s) declared the following potential conflicts of interest with respect to the research, authorship, and/or publication of this article: BPK served as an advisor to Astra Zeneca, Becton, Dickinson, and Company and Sanofi-Aventis and has received research support from Animas Inc, BD, Dexcom, Insulet, Roche Diagnostics, Sanofi-Aventis, and Tandem Diabetes Care. Stock ownership: Inspark Technologies, Inc, and TypeZero Technologies. MDB has received research support from BD, Roche Diagnostics, Sanofi-Aventis, and Tandem Diabetes Care and has stock ownership in TypeZero Technologies.
Funding
The author(s) disclosed receipt of the following financial support for the research, authorship, and/or publication of this article: This study was supported by a grant from Sanofi-Aventis Deutschland GmbH. The data used were collected under NIH/NIDDK grant RO1 DK 51562 during a 2005-2010 behavioral intervention study.