
Abstract
Background:
Most standalone real-time continuous glucose monitoring (RT-CGM) systems provide predictive low and high sensor glucose (SG) threshold alerts. The durations and risk of low and high SG excursions following Guardian™ Connect CGM system predictive threshold alerts were evaluated.
Methods:
Continuous glucose monitoring system data uploaded between January 2, 2017 and May 22, 2018 by 3133 individuals using multiple daily injections (MDIs) or continuous subcutaneous insulin infusion (CSII) therapy were deidentified and retrospectively analyzed. Glucose excursions were defined as SG values that went beyond a preset low or high SG threshold for ≥15 minutes. For a control group, thresholds were based on the median of the low SG threshold limit (70 mg/dL) and the high SG threshold limit (210 mg/dL) preset by all system users. During periods when alerts were not enabled, timestamps were identified when a predictive alert would have been triggered. The time before low horizon was 17.5 minutes and the time before high horizon was 15 minutes, of all users who enabled alerts. Excursions occurring after a low SG or high SG predictive alert were segmented into prevented, ≤20, 20-60, and >60 minutes.
Results:
Excursions were prevented after 59% and 39% of low and high SG predictive alerts, respectively. The risk of a low or high excursion occurring was 1.9 (P < 0.001, 95% CI, 1.88-1.93) and 3.3 (P < 0.001, 95% CI, 3.20-3.30) times greater, respectively, when alerts were not enabled.
Conclusions:
The predictive alerts of the RT-CGM system under study can help individuals living with diabetes prevent some real-world low and high SG excursions. This can be especially important for those unable to reach or maintain glycemic control with basic RT-CGM or CSII therapy.
Keywords
Introduction
Professional continuous glucose monitoring (CGM) systems that allow health care provider assessment or retrospective analysis of captured interstitial glucose levels have been an important diabetes management technology since early clinical application. 1 Data from these systems have allowed quantitative analysis of glycemic metrics that include the percentages of time spent below, within, and above target glucose range; areas under the curve during hypoglycemic and hyperglycemic excursions; and within-period glucose variability on which ongoing therapy decisions can be made.2,3 Hypoglycemia and hyperglycemia are known to be linked to microvascular and macrovascular complications observed in individuals living with diabetes. Clinical access to retrospective CGM data acquired at 5-minute intervals and over extended periods of days and nights helped identify the unrealized extent of hyperglycemia 4 and hypoglycemia3,5-8 exposure.
Intensive glucose-lowering treatments used to reach or maintain glycemic objectives can increase the risk of hypoglycemia.9-11 Ongoing hypoglycemia exposure has been shown to cause future exposure and to increase the incidence of severe hypoglycemic events,12,13 as well as impaired hypoglycemia awareness. 14 Both randomized and observational studies of early15-18 and more recent19-22 standalone real-time CGM (RT-CGM) systems have demonstrated improved glycemic control (ie, reduced glucose variability, hypoglycemia, severe hypoglycemia, fear of hypoglycemia, and even impaired hypoglycemia awareness) compared to conventional self-monitoring of blood glucose (SMBG) measurements alone or blinded CGM use with multiple daily injections (MDIs) therapy. Improved quality of life and psychological wellbeing,23,24 as well as cost-effectiveness,25,26 have been reported with standalone RT-CGM system use. A similar trend of glycemic improvement with RT-CGM has been observed for individuals with type 2 diabetes (T2D) treated with MDI therapy or oral hypoglycemic agents (OHAs) versus SMBG alone with MDI therapy or OHA.27,28
One study has shown that participants benefiting from RT-CGM use with MDI therapy were reported to have experienced increased biochemical hypoglycemia after initial transition to continuous subcutaneous insulin infusion (CSII) therapy. 29 While sensor-integrated insulin delivery systems with threshold suspend30-32 or predictive threshold suspend33-35 are designed to address this complication, such technologies are not available to those using MDI therapy. Recently, RT-CGM with alarms has been recommended as a first-line monotherapy in a diabetes management technology pathway, for those with impaired hypoglycemia awareness or recurrent severe hypoglycemia. 36 The present study evaluated the predictive threshold alerts of a standalone RT-CGM system on real-world hypoglycemic and hyperglycemic excursions in individuals treating their diabetes with MDI or CSII therapy.
Methods
The Guardian Connect CGM System
The Guardian Connect CGM system (Medtronic, Northridge, CA, USA) (Figure 1), in this study, included the subcutaneous Enlite™ Enhanced glucose sensor and the Guardian Connect transmitter that receives sensor data and transmits it to the Guardian Connect application on a compatible mobile device via Bluetooth technology. The Guardian Connect application displays sensor glucose (SG) values, tracings, and trends; and a timer indicating when the next sensor calibration will be required. It accepts blood glucose values for glucose sensor calibration; allows users to enter exercise and meal marker information; can alert users and designated individuals (eg, health care professionals, care partners, and family members) via text messaging when SG is rising above or falling below a preset rate, has gone above or below a preset SG limit (Threshold Alert), or is predicted to go above or below a preset SG limit (Predictive Alert). Threshold alerts can be set from 60 to 400 mg/dL. Predictive alerts can be set from 10 to 60 minutes, before a low or high SG threshold and in 5-minute increments. The RT-CGM system provides a predictive alert that is based on the current SG level, the derivative of the current and previous SG readings, and the “time before high” or “time before low” duration that the user selects. If the predicted future SG value is above the high threshold limit or below the low threshold limit, then a predictive alert will sound. The RT-CGM data are automatically uploaded to the CareLink™ Personal software system (Medtronic) every 5 minutes and can be accessed from any Internet-accessible device for later viewing and/or retrospective analysis.
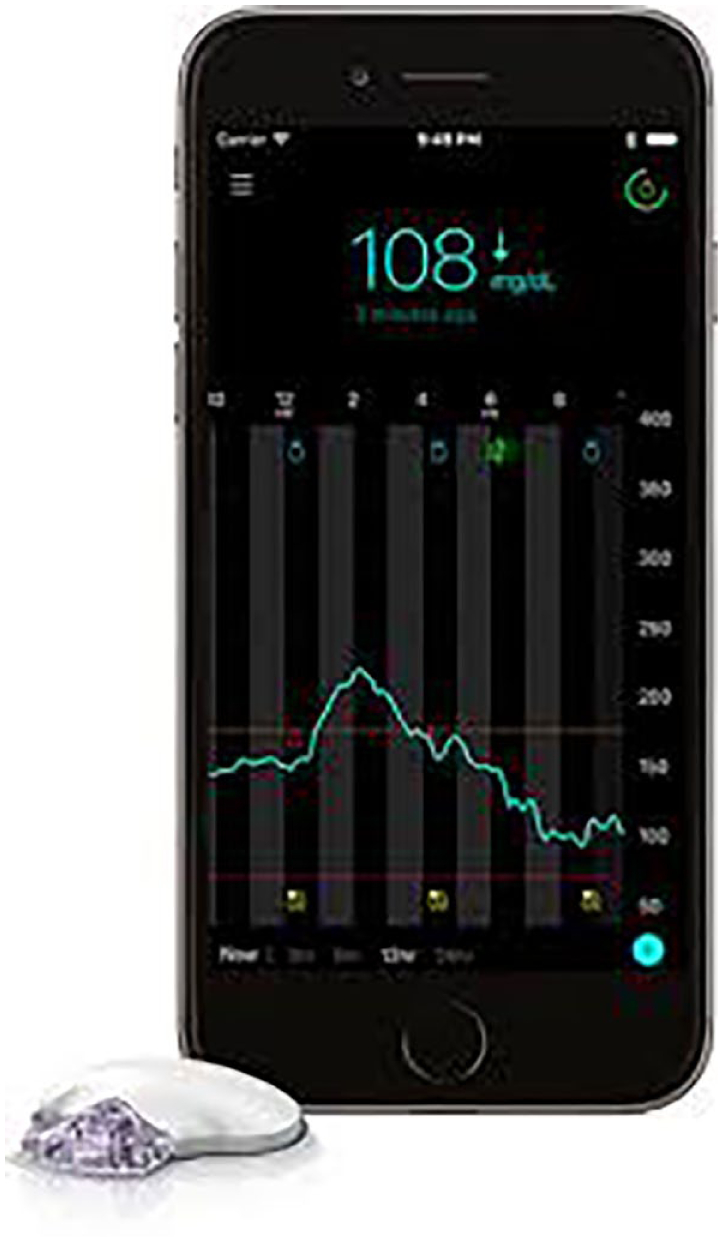
The Guardian™ Connect continuous glucose monitoring system displays sensor glucose data on a smartphone in real time and provides predictive threshold alerts 10-60 minutes before a preset low or high sensor glucose level, as well as threshold alerts when glucose reaches a preset low or high sensor glucose level. Sensor glucose data are recorded 24 hours/day and can be uploaded into CareLink™ Personal software for later review and analyses.
Study Cohort and RT-CGM Data Analysis
Deidentified RT-CGM system data uploaded to the software management system between January 2, 2017 and May 22, 2018, from system users living in Europe with type 1 (n=2692), type 2 (n=93), or gestational (n=5) diabetes and having >5 days of SG data were retrospectively analyzed. The deidentified data of system users that selected prediabetes (n=16) and other (n=204), and users who did not complete the diabetes type query (n=123) were also analyzed. There were 3017 users who enabled low threshold alerts, 2872 users who enabled high threshold alerts, 2315 users who enabled low predictive alerts, and 1391 users who enabled high predictive alerts.
Figure 2 illustrates how the occurrence and duration of SG excursions following representative low predictive alerts were evaluated. For a control (Alerts Not Enabled) data set, timestamps were indicated during threshold alert-disabled and predictive alert-disabled periods of all users, when a predictive alert would have been triggered according to the system’s proprietary algorithm.
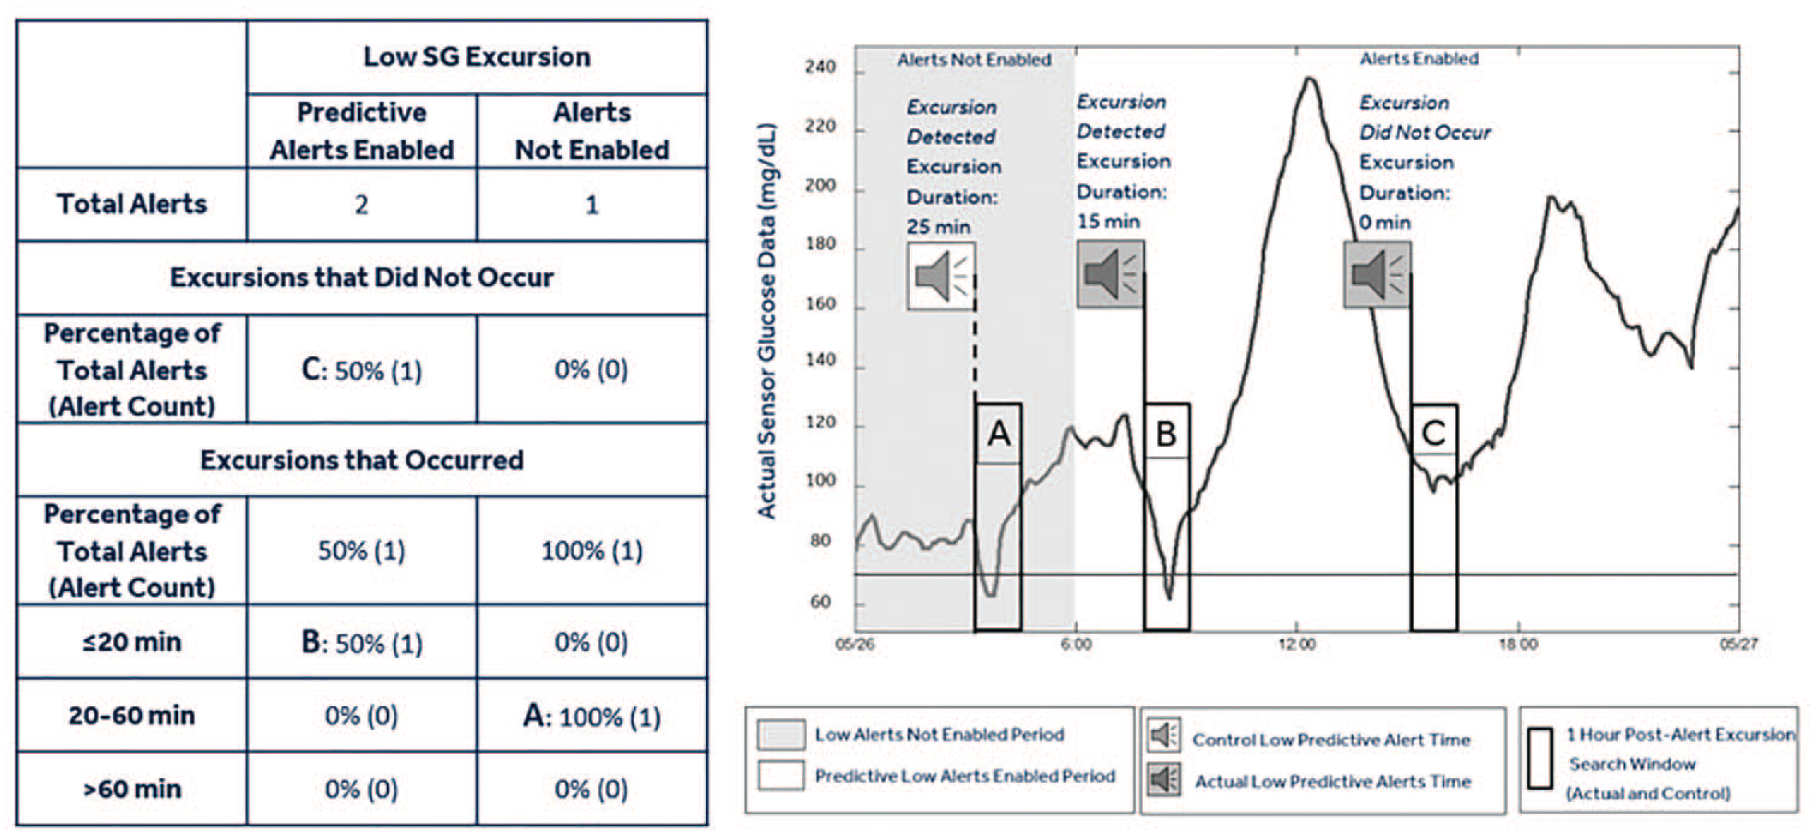
Graphical representation of low predictive alerts. The table shows the number and percentage of sensor glucose alerts surrounding low sensor glucose excursions. The continuous glucose monitoring trace displays time points during periods when low threshold alerts and low predictive alerts are not enabled (gray region) and periods when low predictive alerts are enabled (white region). During the time when alerts are enabled, the alert timestamp is identified (alert graphic) and the subsequent 1-hour window (rectangular box) is queried for an excursion below the threshold. In instances where an excursion is identified, the duration of the excursion below the threshold is measured and tracked per the example table to the left (B: Excursion that occurred, while predictive alerts were enabled, and lasted ≤20 minutes). Instances when an excursion is not identified (C: Excursion that did not occur while predictive alerts were enabled) are also tallied. During the time when alerts are not enabled, the alert timestamp is identified (alert graphic) according to the CGM system’s predictive alert algorithm using the median threshold and “time before” prediction horizon of the aggregated settings of the users in the analysis. Following the control alert, the actual CGM data are investigated for the existence of an excursion within the subsequent 1-hour window. In instances following the control alert where an excursion is identified, the duration of the excursion below the threshold is measured and tracked (A: Excursion that occurred, while alerts were not enabled, and lasted 20-60 minutes). Instances when an excursion is not identified are tallied as “Excursion that did not occur.”
Of the total 3133 users, 14% had time periods where both low threshold and low predictive alerts were not enabled, and 28% where high threshold and high predictive alerts were not enabled. Across the entire population, alerts were not enabled an average 2% of the time for low alerts and 13% of the time for high alerts. The control data set thresholds were based on the median of the preset low SG threshold limit (70 mg/dL) and the preset high SG threshold limit (210 mg/dL) horizons, of all users. The time before low (17.5 minutes) and the time before high (15 minutes) were the median of all users who enabled alerts. Excursions after a low SG or high SG predictive alert were segmented into prevented, ≤20, 20-60, and >60 minutes.
For comparisons to control, predictive alerts were filtered close to the median settings of the users (within ±10 mg/dL of the median threshold and within ±2.5 minutes of the median time before low/time before high duration) to mitigate bias during instances when actual thresholds were far from median values. The RDocumentation Epitab tool (DataCamp Inc., New York, NY, USA) was used to compute the relative risk ratio associated with having an excursion when predictive alerts were not enabled versus enabled. The risk ratios and confidence intervals were estimated using unconditional maximum likelihood and normal approximation (ie, Wald method), 37 respectively.
Results
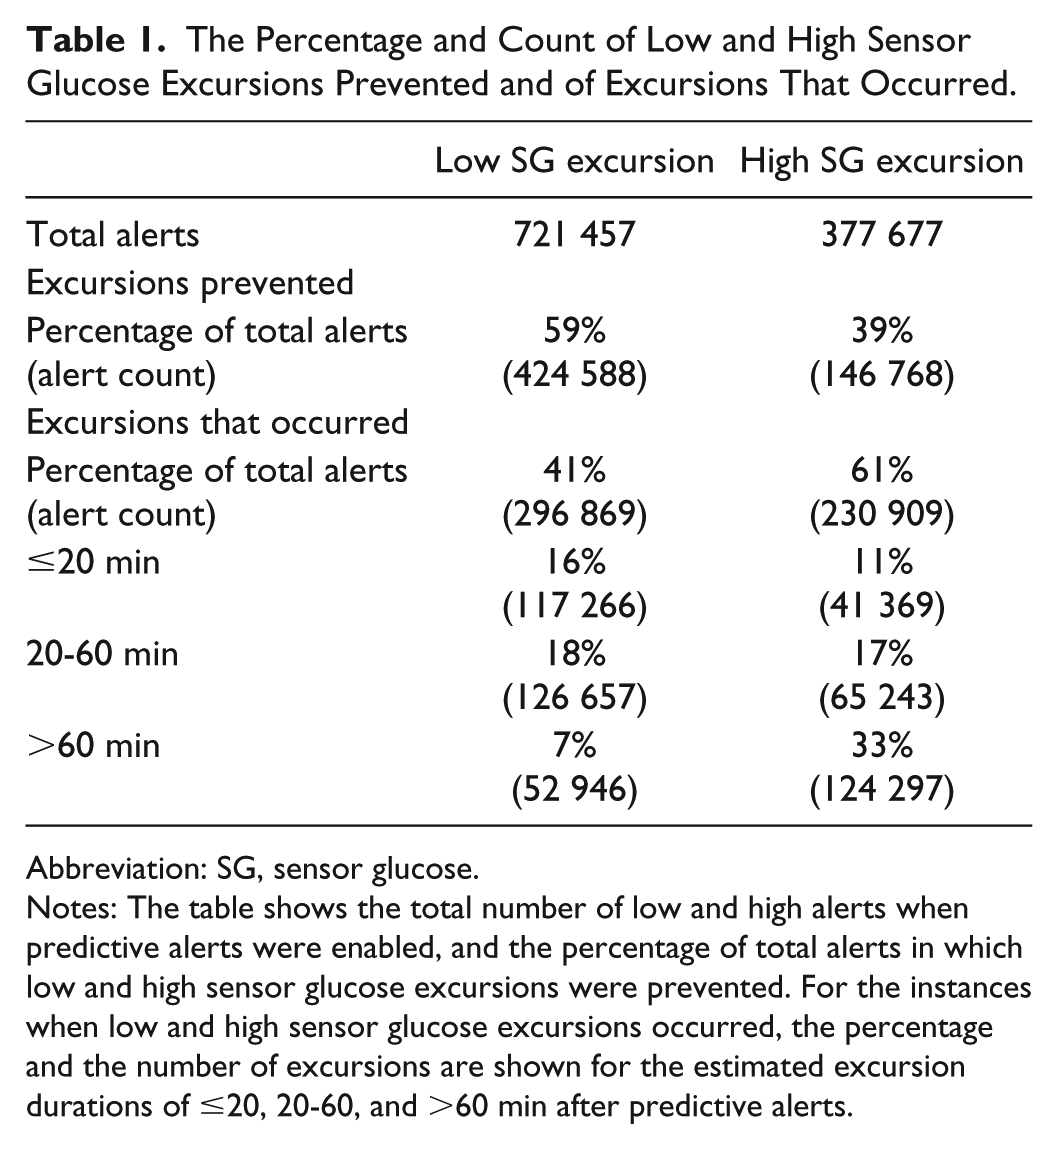
The number and percentage of low SG and high SG excursions based on the total number of predictive alerts distributed across excursions that were prevented and excursions lasting ≤20, 20-60, and >60 minutes in duration are shown in Table 1. When predictive alerts were enabled, 59% of low SG excursions and 39% of high SG excursions were prevented.
The Percentage and Count of Low and High Sensor Glucose Excursions Prevented and of Excursions That Occurred.
Abbreviation: SG, sensor glucose.
Notes: The table shows the total number of low and high alerts when predictive alerts were enabled, and the percentage of total alerts in which low and high sensor glucose excursions were prevented. For the instances when low and high sensor glucose excursions occurred, the percentage and the number of excursions are shown for the estimated excursion durations of ≤20, 20-60, and >60 min after predictive alerts.
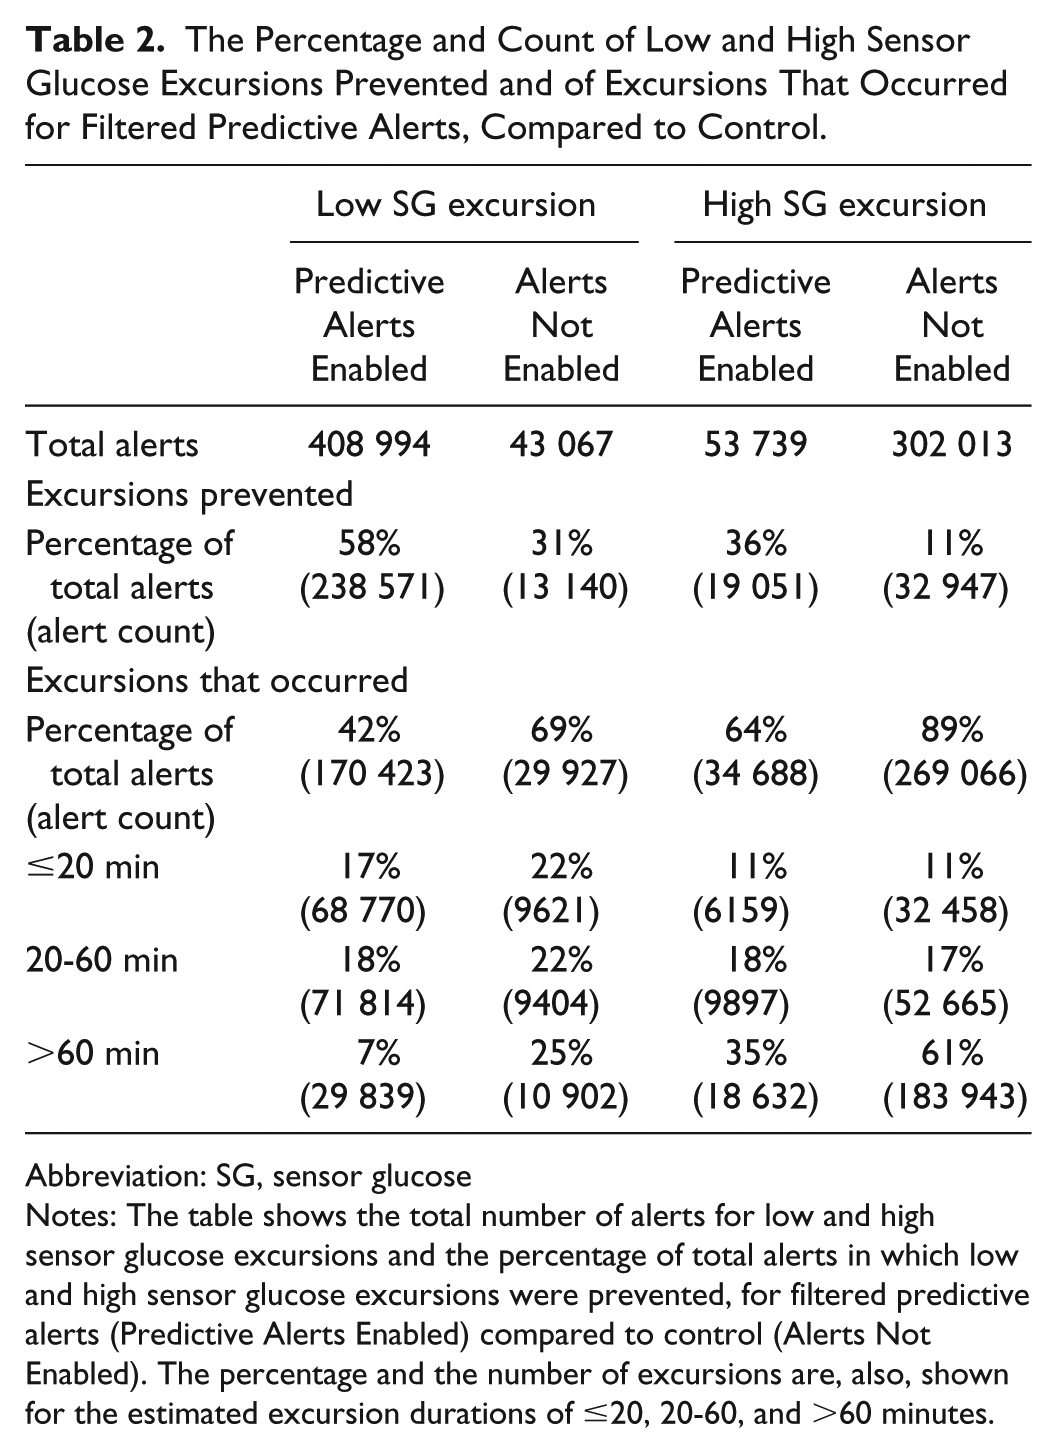
A comparison of filtered predictive alerts versus the control data set (Table 2) resulted in a similar percentage of excursions prevented when alerts were enabled versus not enabled: 58% of low (Figure 3(A)) and 36% of high (Figure 3(B)). The risk of an excursion was 1.9 [95% CI, 1.88-1.93, P < 0.001] times greater when low SG alerts were not enabled and 3.3 [95% CI, 3.20-3.30, P < 0.001] times greater when high SG alerts were not enabled. The percentage of low and high SG excursions lasting longer than 1 hour were 7% and 35% with predictive alerts enabled, versus 25% and 61% when alerts were not enabled, respectively.
The Percentage and Count of Low and High Sensor Glucose Excursions Prevented and of Excursions That Occurred for Filtered Predictive Alerts, Compared to Control.
Abbreviation: SG, sensor glucose
Notes: The table shows the total number of alerts for low and high sensor glucose excursions and the percentage of total alerts in which low and high sensor glucose excursions were prevented, for filtered predictive alerts (Predictive Alerts Enabled) compared to control (Alerts Not Enabled). The percentage and the number of excursions are, also, shown for the estimated excursion durations of ≤20, 20-60, and >60 minutes.
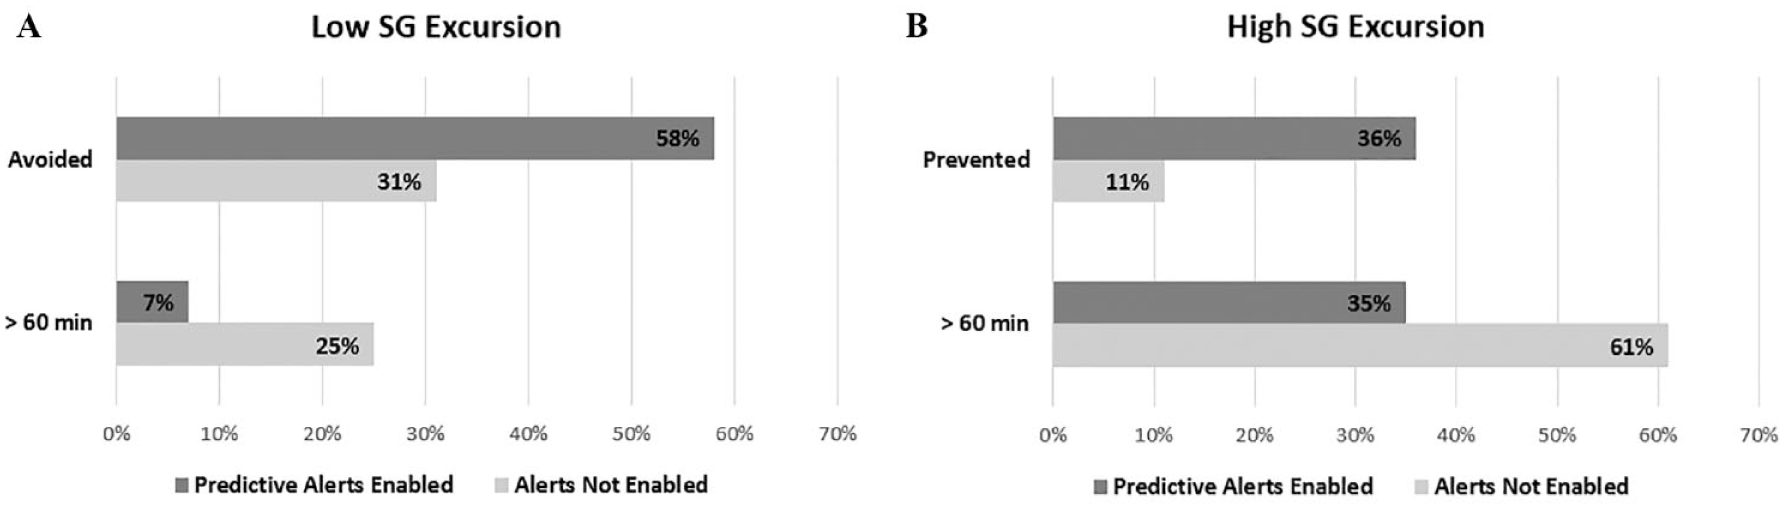
Sensor glucose excursions with and without alerts enabled: (A) low sensor glucose excursions and (B) high sensor glucose excursions. The percentages of low (A) and high (B) sensor glucose excursions in the control data set (Alerts Not Enabled: light bars) and the filtered alerts data set (Predictive Alerts Enabled: dark bars) are shown.
The profiles of the median (interquartile range) of SG values 1 hour before and up to 4 hours after a low SG excursion event when predictive alerts were enabled versus not enabled provide a visualization of SG excursion recovery (Figure 4). The control profile displayed a longer SG recovery over time, from the initiation of the alert event, and a longer duration of time below median SG levels <70 mg/dL.
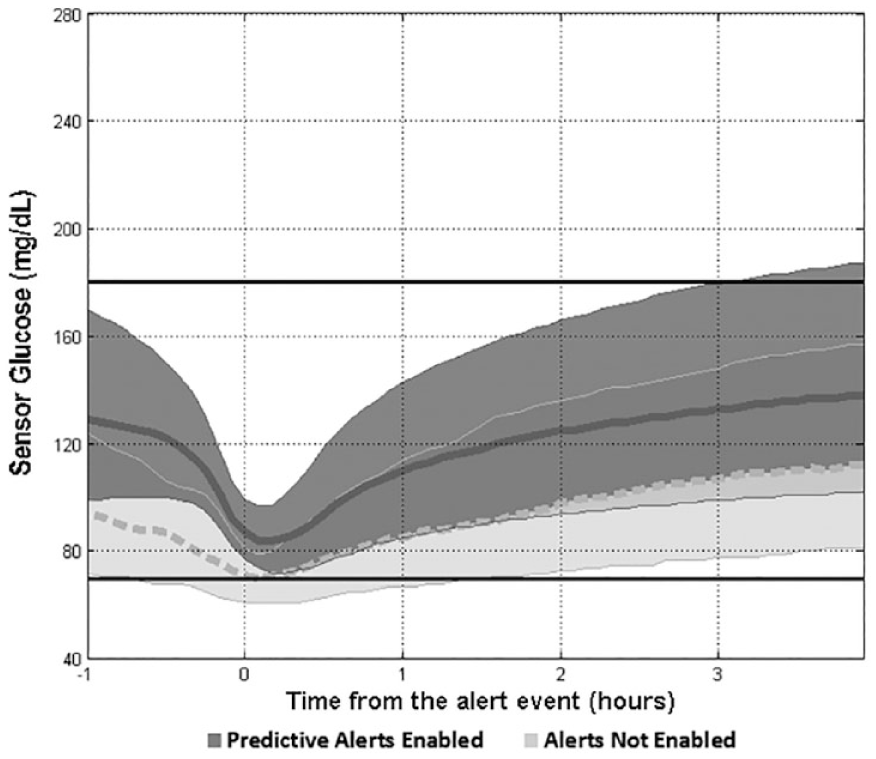
Low sensor glucose excursion and recovery. The median (thick curves) and interquartile ranges of sensor glucose values are shown 1 hour before and up to 4 hours after a predictive low sensor glucose alert event (time = 0). The Alerts Not Enabled control is shown as a light gray band with a dashed median curve, and the Predictive Alerts Enabled data set is shown as a dark gray band with a solid median curve. The horizontal lines at 70 and 180 mg/dL show the target glucose range.
Discussion
The present retrospective analysis of CGM system alerts from over 3000 users demonstrates that 59% of low SG excursions and 39% of high SG excursions were prevented. Enabling predictive alerts significantly reduced the number of low and high SG excursions to the effect that the risk of a low and high SG excursions was 1.9 and 3.3 times greater, respectively, if alerts were not enabled.
The glycemic control benefits of RT-CGM in individuals with suboptimally or well-controlled type 1 diabetes (T1D) or T2D using either MDI or CSII therapy have been notable.27,38,39 In addition to the availability of retrospective SG data for making treatment decisions or determining the extent of hyperglycemia and hypoglycemia exposure,4-8 RT-CGM systems have allowed individuals living with diabetes and their families the ability to immediately address glycemia throughout the 24-hour day and from one day to the next, for several days through visualization of current and trending SG levels.
Early randomized investigations of RT-CGM use with MDI therapy (RT-CGM + MDI) or CSII therapy (RT-CGM + CSII) demonstrated similar improvement in glycemic control or glucose variability.18,40,41 A more recent study has shown improved glycemic control, yet reported increased biochemical hypoglycemia, after CSII therapy initiation in study participants previously using RT-CGM + MDI; 29 which highlights the limitations of using RT-CGM without sensor-integrated insulin pump technology.30-35,42-45
A recently developed diabetes technology treatment pathway suggests either flash glucose monitoring, RT-CGM, or CSII as a first-line monotherapy for individuals with T1D who are unable to reach glycemic targets with an optimized minimum standard of care. 36 More specifically, RT-CGM with alarms is recommended for those burdened by impaired hypoglycemia awareness or severe hypoglycemia. While an observational study of a new standalone RT-CGM system by individuals using either CSII or MDI therapy revealed an 85% detection rate of impending SG <70 mg/dL within 30 minutes, 46 the present study is the first to assess SG excursions with predictive SG alerts as early as 60 minutes. The ability of a RT-CGM system to mitigate hypoglycemia and hyperglycemia exposure is important given the microvascular and macrovascular complications associated with both over time; the risk of severe hypoglycemia;12,13 and the associated burden47,48 and fear49,50 experienced with these complications.
Limitations of this report include its retrospective design, lack of an alerts-disabled comparator over long duration (≥6 months), limited medical history and demographic information on the RT-CGM system users, as well as knowledge of the ongoing standard of care information received by system users. An important strength is that RT-CGM data spanning months in duration and including a very large population of real-world individuals living with diabetes was analyzed. While the standalone RT-CGM system assessed predictive alerts after low and high SG excursions, it is important to note that system performance should be evaluated in individuals most susceptible to hypoglycemia. Thus, future studies should continue to assess system features in longer and more comprehensive (ie, patient-reported outcomes or ambulatory glucose profile report utilization) investigations with specific demographic populations (ie, pediatric and geriatric).
Conclusion
The Guardian Connect CGM system is the first and only stand-alone RT-CGM device that can alert individuals of potential low and high SG excursions up to 60 minutes in advance. This study demonstrates that the system’s predictive alerts significantly reduce glycemic excursions that would have otherwise occurred.
Footnotes
Declaration of Conflicting Interests
The author(s) declared the following potential conflicts of interest with respect to the research, authorship, and/or publication of this article: All authors are employees of Medtronic (Northridge, CA, USA) or Medtronic International Trading Sarl (Tolochenaz, Switzerland). Toni L. Cordero, PhD, an employee of Medtronic, served as medical writer. The Guardian Connect continuous glucose monitoring system is approved by the Food and Drug Administration for individuals with diabetes aged 14-75 years.
Funding
The author(s) disclosed receipt of the following financial support for the research, authorship, and/or publication of this article: This study was funded by Medtronic.