
Abstract
Background:
Prolonged time elapsing between the blood drawing and separation of the cell mass may result in decreased sample glucose levels due to continuous glycolysis. This can lead to underdiagnoses of hyperglycemic states and overdiagnosis of hypoglycemia. We aimed to evaluate the clinical impact of shortened transit time and earlier centrifugation of laboratory specimens on reported glucose results and diagnosis of clinically significant hypoglycemia (<50 mg/dL) or elevated glucose levels (>100 mg/dL).
Methods:
We assessed all fasting-serum glucose tests from the adult population (190 767 subjects) without known diabetes residing in Southern Israel. Before and after intervention periods were compared: 268 359 blood tests were performed during 2009-2010, and 317 336 during 2012-2013.
Results:
While glucose levels were 94.17 mg/dL ± 14.12 in 2012-2013 versus 83.53 mg/dL ± 14.50 in 2009-2010 (12.75% ± 0.88 increase, P < .001), the difference in glycated hemoglobin levels was statistically significant but clinically negligible: 5.84% ± 0.56 in 2012-2013 versus 5.88% ± 0.56 in 2009-2010 (0.53% ± 0.78 decrease, P < .01). There was an increased likelihood of a glucose result to be above 100 mg/dL following intervention: 9.80% versus 25.90%, P < .001. For clinics distanced over 40 km from the laboratory, age-adjusted odds ratio value was 1.26 (95% CI 1.13, 1.41). The proportion of samples with hypoglycemia values decreased from 0.33% to 0.03% (P < .001).
Conclusions:
We demonstrated an important change in glucose values over a two-year period following an improvement of the preanalytic processes. The intervention was related to an increase in the frequency of hyperglycemia results and a decrease in the number of hypoglycemia results. Future administrative projects should consider clinical consequences with involvement of all relevant stakeholders.
Keywords
The diagnostic criteria for type 2 diabetes mellitus (T2DM) are based on the levels of glycated hemoglobin (HbA1c) and plasma glucose. Current guidelines call for immediate blood samples centrifugation of sampling and the use of a potent glycolysis inhibitor. 1 Nevertheless, the guidelines also mention that these methods are not always practical and are not widely used. 1 Frequently, the preanalytic stage (steps between sampling and analysis in the laboratory 2 (is prolonged and emerges as the major source for testing errors.3-5 Prolonged time elapsing between the blood drawing to the centrifugation and separation of the cell mass may result in decreased sample glucose levels due to the continuous glycolysis. 6 This, in turn, may negatively affect the sensitivity of the T2DM detection and elevate the rate of false hypoglycemia detection.
Southern Israel has a population of 750 000 and Clalit Health Services insures more than 60% of the population. All laboratory tests for this population are performed at the single site. The maximal distance between the region borders is 170 km. Until 2011, the blood samples were transported from clusters of clinics to the central laboratory, leading to a lag of up to four hours from blood drawing to centrifugation. In 2011 the process was redesigned, and five centrifugation centers were established, resulting in the shorter preanalytic stage.
The aim of our study is to evaluate the clinical impact of shortened transit time and earlier centrifugation of laboratory specimens on reported glucose results and diagnosis of clinically significant hypoglycemia (<50 mg/dL) or elevated glucose levels (>100 mg/dL) in Southern Israel. We hypothesized, that on a population level, in patients with no known T2DM, the adoption of the new transit system has resulted in the increase in glucose levels and subsequently higher rate of the glucose values comparable with prediabetes diagnosis, while the incidence of the critically low values of glucose has decreased.
Materials and Methods
Study Population
We included all fasting-serum glucose samples of residents of Southern Israel insured by Clalit Health Services (107 clinics), with available samples between the years 2009-2010 (old transit system) and 2012-2013 (new transit system). Blood samples which met one of the following criteria were excluded from the analysis: samples of subjects younger than 18 years of age; samples of patients with known T2DM; samples in which only glucose was ordered (sent with glycolysis inhibitor); samples of subjects registered in a clinic with centrifuges at site (both during old and new transit system period, 107 clinics) or in a clinic in which samples were not analyzed at the central laboratory; and samples taken during hospitalization. Diabetes mellitus was defined by either known diagnosis, treatment with one of the antiglycemic medications, existing of the previous HbA1c test with ≥6.5%, or outpatient glucose test above 200 mg/dL prior to the index laboratory analysis.
Laboratory Testing
Testing of all the samples was performed by one central laboratory located in SUMC, the only tertiary hospital in the area serving the population of 750 000 residents. Serum glucose concentrations were determined using Hexokinase enzymatic UV method on Beckman-Coulter AU analyzers. HbA1c percentage from total hemoglobin in whole blood was measured in an ion-exchange high performance liquid chromatography (HPLC) method using Bio-Rad VARIANTTM II TURBO HbA1c kit.
Intervention
Up to 2011, blood samples were transferred from clusters of clinics to the central laboratory. In 2011 the entire process was redesigned as part of a quality improvement project. Five centrifugations centers were established in key locations across the district and transportation routes were changed for increased efficiency. The blood samples were kept in cooler containers insulated with Styrofoam at 20°C for up to 2 hours until centrifugation and, after centrifugation, for up to 1 hour until shipped to the laboratory. The temperature of the container was ±20°C, while once in the laboratory—the samples were stored in room temperature, until tested. The time till centrifugation and after that till the lab has been monitored using barcoded tracking that would alert about delays. The laboratory would receive a message on a package with specimen late for centrifugation for 30 minutes, that is, above 2.5 hours. Per protocol, the specimens late for centrifugation for more than 30 minutes were discarded.
Data Collection
The study was approved by the institutional review board at Soroka University Medical Center (SUMC). Health data were retrieved from Clalit Health Services databases. Laboratory results were obtained from the central laboratory information system, diagnosis information was obtained from SUMC and Clalit community clinical databases. Clinic location was obtained from Clalit administrative databases, and mapped to calculate distance from the central laboratory, based on location.
To avoid misclassification of the study exposure, samples taken during 2011 were excluded from the analysis as the intervention was implemented gradually and affected various clinics at different times throughout the year.
Definition of the Outcomes
For the purposes of the current analysis we defined elevated fasting glucose levels in accordance to the American Diabetes Association (ADA) criteria of fasting glucose above 100 mg/dL. 7 Significant hypoglycemia defined by plasma glucose values below 50 mg/dL. 8
Statistical Analysis
Results are presented as mean ± standard deviation for continuous variables and as percentages for categorical data. Glucose, HbA1c were compared using t-test. The proportion of critical low glucose values and elevated glucose values were compared using chi-square test. To determine whether the frequency of prediabetes comparable values of glucose increased following the intervention, we used a multivariable mixed logistic model. Using the hierarchical structure of the regression we modeled the probability of glucose values to be higher than 100 mg/dL, accounting for high intraclass correlation within a cluster of the measures repeated for the same subject. Models were adjusted for time trend, age, and gender.
The main exposure of interest and the trend of increasing glucose values with time were highly correlated. Therefore, we used a two-phase residual logistic regression. 9 In the first stage, we fitted the model using only the trend variable as a confounder to obtain the predicted probabilities of glucose values >100 mg/dL.
In the second stage we fitted a logistic regression model, adjusting for relevant confounders, where the predicted values obtained from the first stage model were treated as an offset with a fixed coefficient of one. Multivariate analysis of the probability of glucose values <50 mg/dL was not feasible due to small number of cases.
To confirm the hypothesis that the differences between the pre- and postintervention groups were related to the improvement of the preanalytic stage and not due to an increase in prediabetes incidence, we assessed the HbA1c test results that were not expected to be affected by the change in laboratory logistics.
As in the analysis described above, we used a residual linear regression to adjust for the positive trend of glucose levels over the years. We first modeled the HbA1c level as a function of time. The residuals obtained from this regression were further modeled in a linear regression with only gender and ages as independent variables. Therefore, association of the intervention with HbA1c was adjusted for three important covariates—trend, gender, and age.
To evaluate whether the associations varied by distance from the lab, we stratified all analyses by distance from the central laboratory calculated using ArcInfo software 10.2 (ESRI, Redlands, CA, USA). Analyses were performed using SAS 9.4 (SAS Institute Inc, Cary, NC, USA).
Results
Population
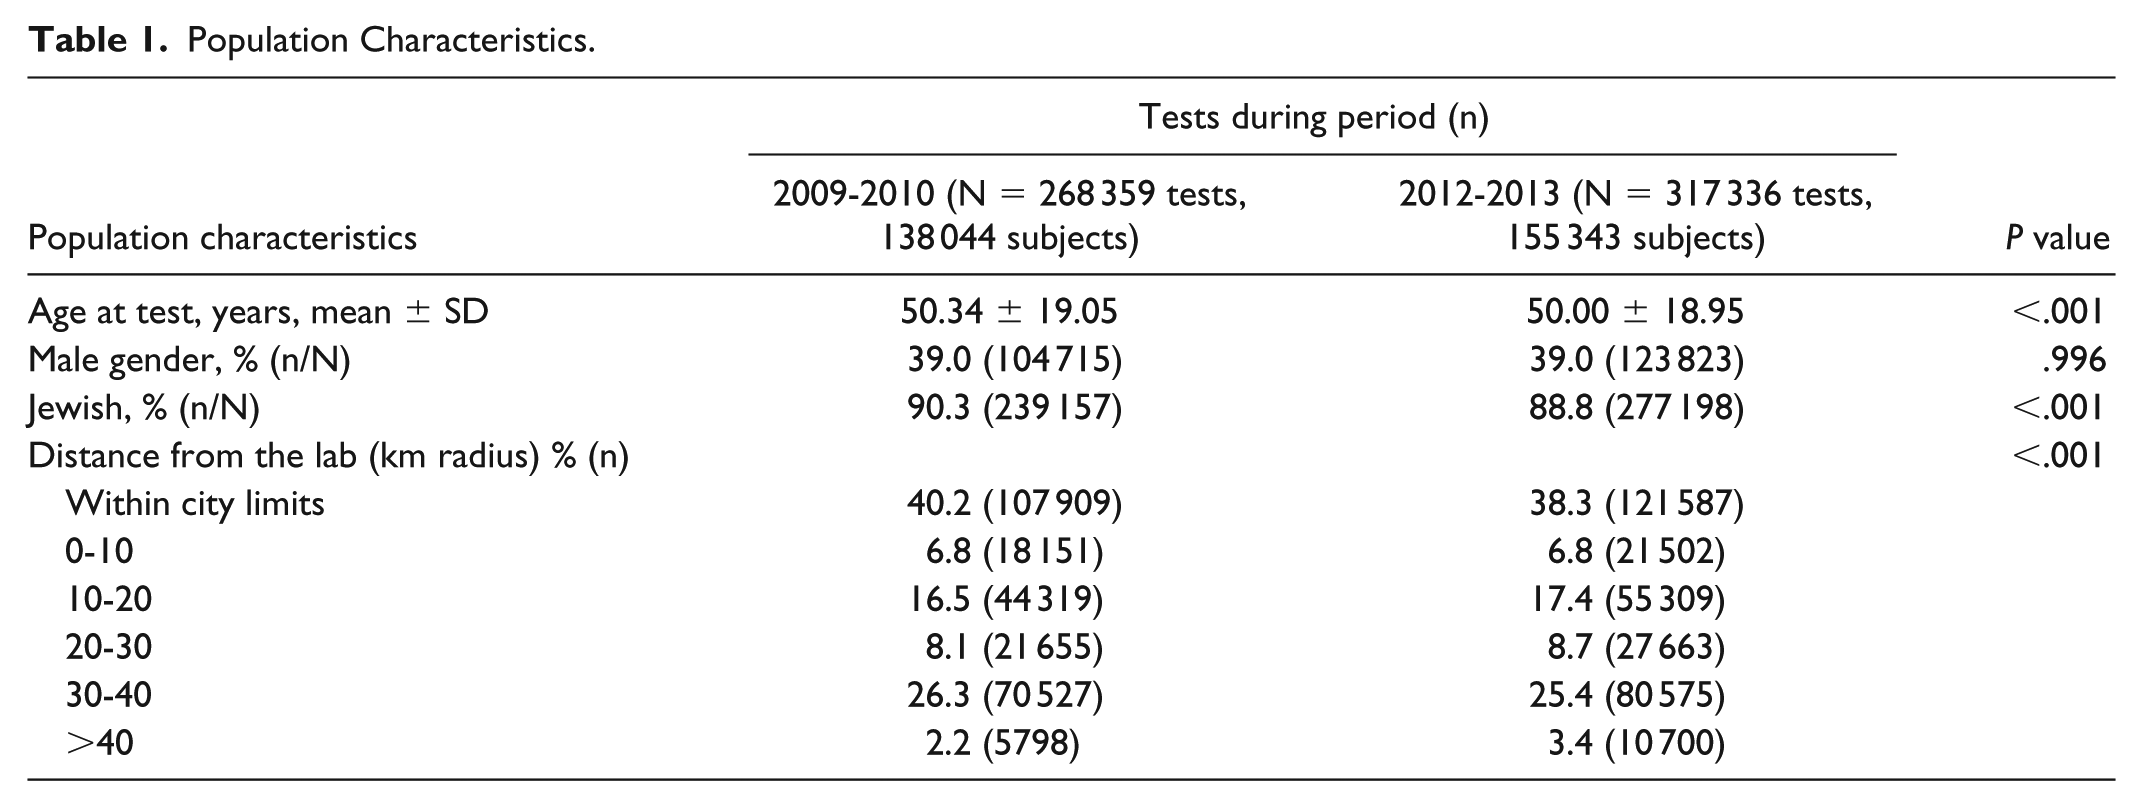
During the study period, 585 695 serum glucose samples from 190 767 subjects met the study criteria and were included in the analysis. Of these, 268 359 (45.80%) were performed during 2009-2010, and 317 336 (54.20%) during 2012-2013. Samples during both time periods were sent from 107 clinics, located up to 80 km from the central laboratory. Age and gender at the time of the test were similar between the periods, with the average age being 50.30 ± 19.05 years and 50.0 ± 18.95 years in 2009-2010 and 2012-2013, respectively, and 39% of tests were done in males in both periods. Distribution of samples by location of clinic in relation to the central laboratory showed an increased proportion of tests arriving from more distant locations in the second period, samples from locations beyond 40 km distance increased from 2.20% to 3.40% (P < .001). Samples from the central laboratory city limits composed 40.20% of the tests in the first period but only 38.30% in the second (P < .001) (Table 1).
Population Characteristics.
Glucose Values
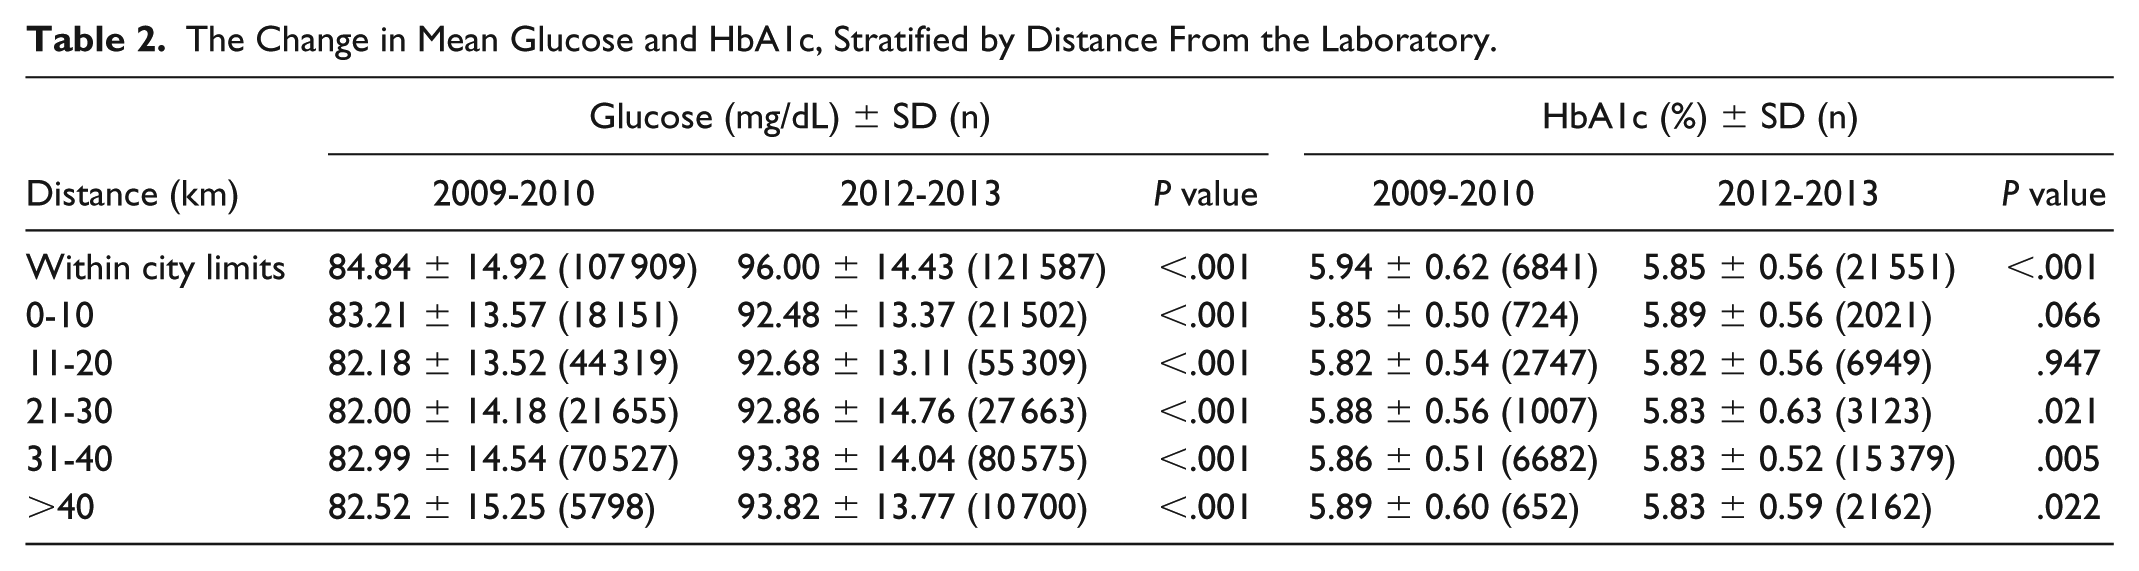
While glucose levels were 94.17 mg/dL ± 14.12 in 2012-2013 versus 83.53 mg/dL ± 14.50 in 2009-2010 (12.75% ± 0.88 change from the early period, P < .001), the difference in HbA1c levels was statistically significant but clinically negligible: 5.84% ± 0.56 in 2012-2013 versus 5.88% ± 0.56 in 2009-2010 (0.53% ± 0.78 change from the early period, P < .01) (Figure 1). The pattern of higher glucose values and clinically similar HbA1c values was consistent for all clinic locations, regardless of distance to the central laboratory (Table 2).
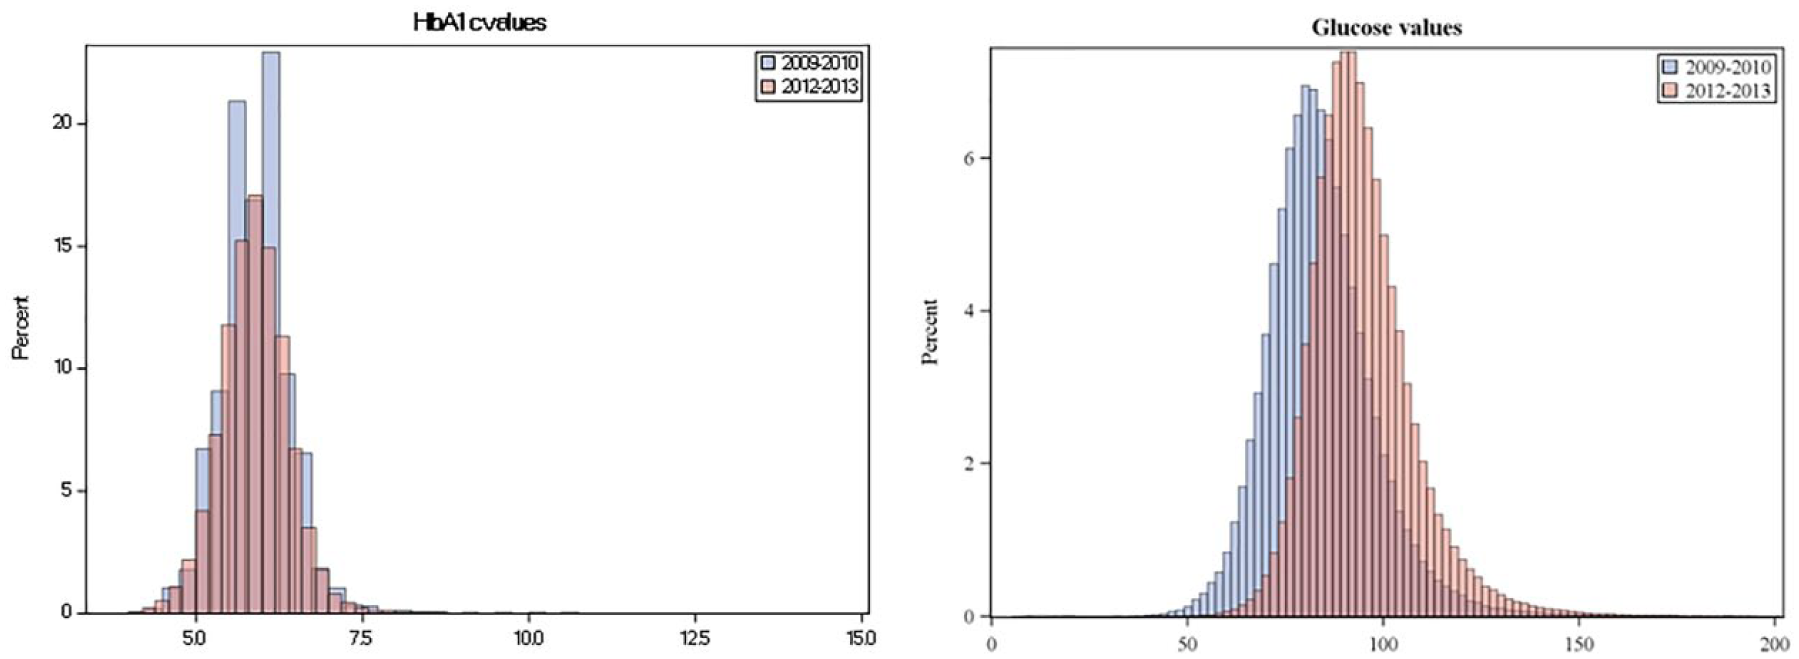
The distribution of glucose and HbA1c levels, in 2009-2010 and 2012-2013.
The Change in Mean Glucose and HbA1c, Stratified by Distance From the Laboratory.
Study Outcomes
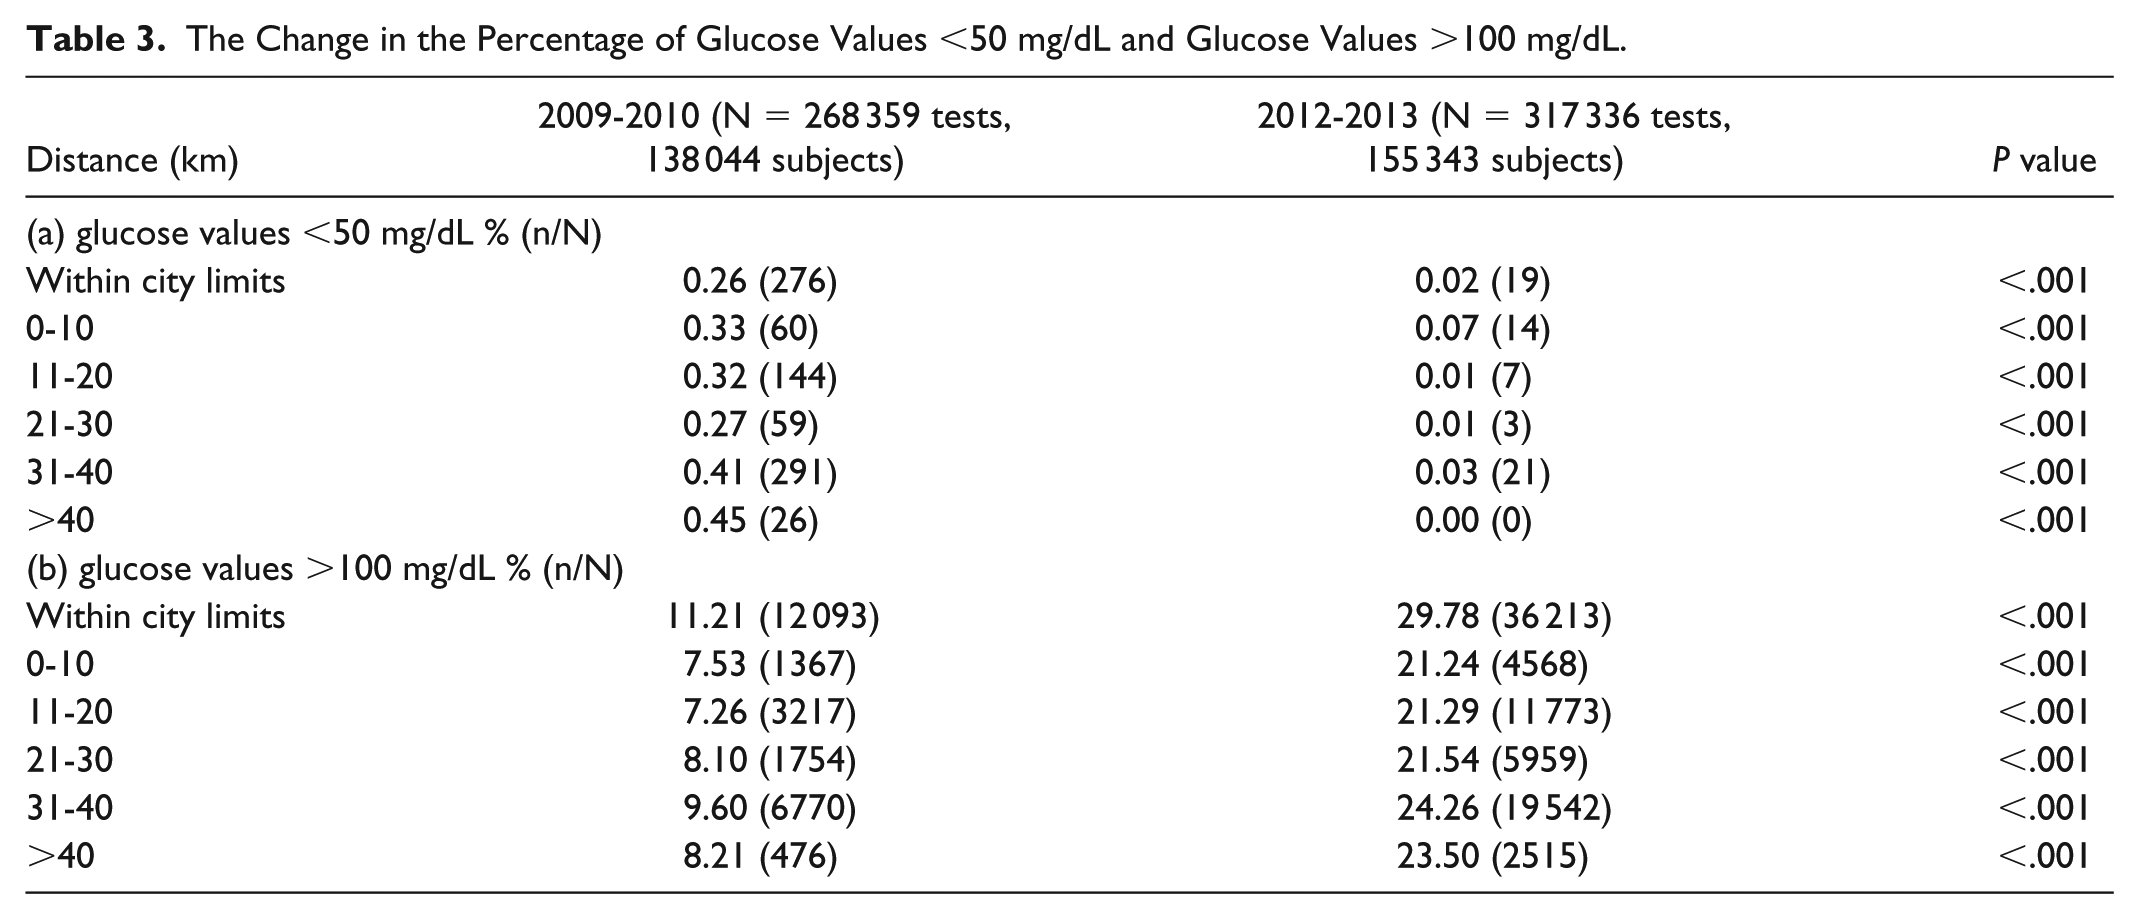
The overall percentage of glucose values over 100 mg/dL rose significantly, from 9.83% (16 939 subjects) in the period before the project to 25.91% (45 199 subjects) in the following period (P < .001). Table 3 depicts the results of the univariate analysis for the percentage change as a function of the distance between the clinical and central laboratory. Table 4 shows the adjusted odds ratios between the new transit system and the probability of glucose being above 100 mg/dL. For the distant clinics (>40 km from the central laboratory) the adjusted OR was the highest—1.26 (95% CI 1.13, 1.41).
The Change in the Percentage of Glucose Values <50 mg/dL and Glucose Values >100 mg/dL.
Association of the Intervention and the Probability of Glucose Values Higher Than 100 mg/dL.
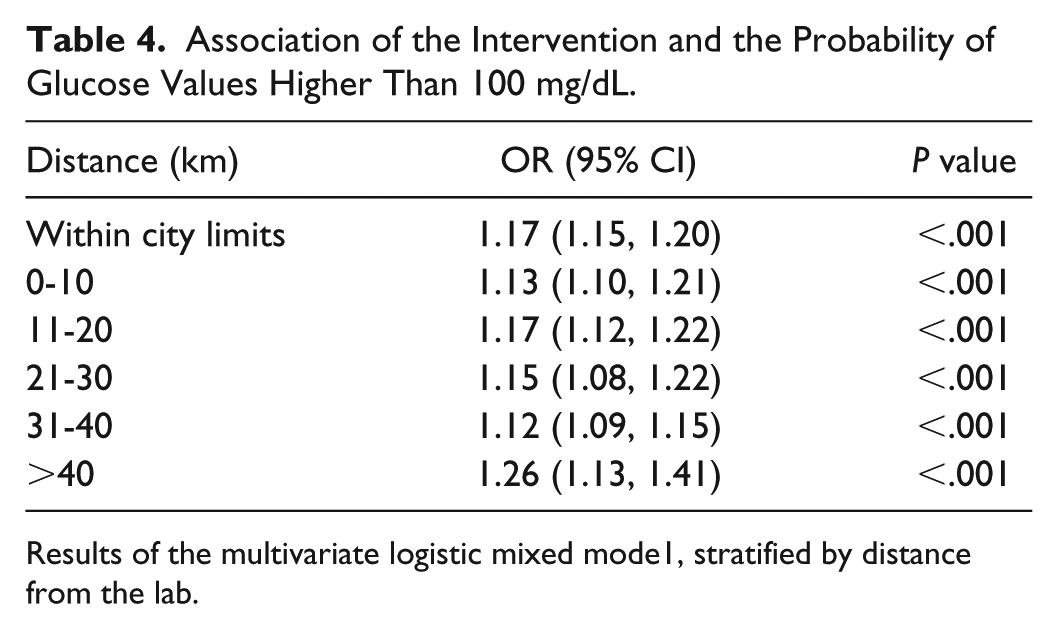
Results of the multivariate logistic mixed mode1, stratified by distance from the lab.
Last, we have noted lower proportions of critically low glucose values in 2012-2013. In the period prior to the project implementation, there were 856 hypoglycemia values (<50 mg/dL, 0.33% of all results), which was decreased to 64 (0.03% of all results, P < .001). The highest difference in frequency of hypoglycemia was observed in the samples sent by clinics located further than 30 km from the central laboratory, 0.86% of the glucose tests at 2009-2010, versus 0.03% at 2012-2013.
Discussion
Our study demonstrated that adoption of a new transit system was associated with the increase in glucose levels and subsequently higher rate of the glucose values above 100 mg/dL, while the incidence of the critically low values of glucose has decreased.
Change in the Glucose Values
The shift in glucose values following the project was related to a large increase in the number of patients matching the laboratory criteria for prediabetes and require therapeutic intervention or at the very least repeat testing and follow-up. These patients are at risk in developing diabetes and cardiovascular complications. 10
Our results demonstrate a phenomenon similar to a calibration error, albeit one caused by the preanalytic step and subjected to random component of transportation time different for each sample. On top of improving the transit time as a reason for a more accurate glucose measurement the increase in prevalence of prediabetes must be taken into consideration and explains part of this increase. In the United States an increase in overall age-adjusted prediabetes was seen from 27.4% in 1999-2002 to 34.1% in 2007-2019. 11 It is estimated that by 2030 over 470 million people worldwide will have prediabetes. 12
Hypoglycemia Values
Glucose values consistent with hypoglycemia amongst individuals without diabetes almost disappeared. In the period before the project 0.33% of all results were flagged as being low (<50 mg/dL). Following the project, this was lowered to 0.03% of all tests. The hypoglycemic results have a substantial impact on the health system. Laboratory technicians are required to report potentially life-threatening laboratory values to clinicians immediately. Hypoglycemia (glucose values below 50 mg/dL) is one of these so-called “panic values” requiring immediate attention of clinicians, which are typically followed by an urgent recall of patients for repeated testing, frequently at the emergency department. Many of these low glucose values might have previously resulted from the prolonged transport time. Moreover, these results have a greater impact on the diabetes population where the danger of hypoglycemia is greater due to the treatments they receive including insulin and sulfonylurea and unfortunately quite common and occasionally asymptomatic due to hypoglycemic unawareness. Other reasons for hypoglycemia are rare and usually accompanied by symptoms. 13
Frequency of Glucose Blood Tests
We observed a significant increase in glucose testing among adults without diabetes in the different study periods. The number of glucose tests increased by 18.2% while the population grew by only 5.2%. We believe this may be caused by (1) an increased awareness of recommendations for T2DM screening in high-risk patients; 14 (2) the emerging recognition of prediabetes as an important entity with the potential of lowering or even reversing the risk of progression to T2DM; 15 and (3) the introduction in Clalit Health services of quality measures requiring screening for T2DM. 16
Health Implications
Fasting glucose, 2 hour glucose during 75-g oral glucose tolerance test and HbA1c are considered equally appropriate 14 for T2DM screening Therefore, this improvement in glucose measurement has profound health implications. Identifying patients with prediabetes provides an opportunity to prevent the progression to diabetes and preventing complications associated with the disease.17,18
Limitations
Our study has several limitations. First, transit time was not recorded prior to the project. As a result, we used the distance between the clinic in which blood was drawn to the central laboratory as a proxy for transit time, which may result in a misclassification bias. It is also possible that even within central laboratory city limits, transport time is longer than for the remote rural clinics, as vehicles made additional stops or spend more time in urban traffic. Nevertheless, we have shown that effect of increased proportion of the glucose values above 100 mg/dL following the adoption of the new transit methodology was the highest for the most remote clinics (>40 km from the central lab). In addition, we chose not to assess the population of patients with diagnosed T2DM due to a wide range and variability of plasma glucose and HbA1c values in this population, that could result in bias toward zero hypothesis.
Conclusion
Our study demonstrated a clinically important change in reported glucose values over a two-year period that followed a quality improvement project aiming to improve preanalytic processes. This change was associated with an increase in the number and rate of adults meeting the laboratory criteria for prediabetes and a decrease in the number of critical hypoglycemia results.
Administrative and logistic projects may have significant clinical implications. Involvement of clinicians and researchers before and following implementation of such projects is critical in planning the response to these changes.
Footnotes
Abbreviations
HbA1c, glycated hemoglobin; SUMC, Soroka University Medical Center; T2DM, type 2 diabetes mellitus.
Declaration of Conflicting Interests
The author(s) declared no potential conflicts of interest with respect to the research, authorship, and/or publication of this article.
Funding
The author(s) received no financial support for the research, authorship, and/or publication of this article.