
Abstract
Introduction:
Blood glucose monitoring systems (BGMS) should provide sufficient analytical quality to allow adequate therapy for diabetes patients. Besides system accuracy, measurement precision is an important aspect of a BGMS’ analytical quality.
Methods:
Based on ISO 15197:2013/EN ISO 15197:2015, system accuracy, measurement repeatability, and intermediate measurement precision were assessed. ISO 15197:2013 system accuracy criteria require that ⩾95% of individual BGMS’ test strip lot results shall fall within ±15 mg/dl or ±15% of corresponding comparison method results (at glucose concentrations <100 mg/dl and ⩾100 mg/dl, respectively), and that ⩾99% of results fall within consensus error grid (CEG) zones A and B. Measurement repeatability was assessed using venous blood samples, whereas intermediate measurement precision was assessed using control solution samples. Standard deviation (SD) and coefficient of variation (CV) were calculated for glucose concentrations <100 mg/dl and ⩾100 mg/dl, respectively. Precision acceptance criteria are not specified by ISO 15197:2013.
Results:
All three BGMS fulfilled system accuracy criteria with 96% to 98% of individual test strip lot’s results falling within the acceptable accuracy limits. All measurement results fell within CEG zones A and B. For measurement repeatability, SD was ⩽3.3 mg/dl, and CV was ⩽3.9% for the investigated BGMS. Assessment of intermediate measurement precision showed SD ⩽1.3 mg/dl and CV ⩽3.0%.
Conclusion:
All three BGMS fulfilled system accuracy criteria of ISO 15197:2013. In absence of acceptance criteria, precision results were found to be consistent with the manufacturer’s labeling of the investigated devices.
Self-monitoring of blood glucose is an important issue for people with diabetes who are on an insulin regimen. Blood glucose monitoring systems (BGMS) for self-monitoring should therefore provide accurate measurement results, so that people with diabetes can achieve adequate glycemic control.
Accuracy of BGMS comprises two aspects, trueness and precision. 1 The former relates to how well an average of replicate measurement results matches a comparative result (reference result), whereas the latter relates to the agreement among replicate measurement results. Both aspects are relevant for BGMS users: Varying bias (ie, varying levels of lack of trueness) may not be recognized by diabetes patients, which could have a systematic effect on their glucose control. Large variability among individual results (ie, lack of precision), on the other hand, may pose a problem, because diabetes patients cannot know whether the BGMS happens to show a correct, falsely elevated or falsely lowered result.
The International Organization for Standardization (ISO) published the internationally accepted standard ISO 15197:2013 regarding requirements for BGMS for self-monitoring. 1 ISO 15197:2013 was harmonized with European regulations as EN ISO 15197:2015. Changes were made only to the foreword and an informative annex, whereas requirements and procedures were not affected by the harmonization. As part of the assessment of analytical performance, system accuracy in the hands of trained users and precision (measurement repeatability and intermediate measurement precision) have to be investigated.
In this study, system accuracy, measurement repeatability, and intermediate measurement precision of three different BGMS were investigated based on ISO 15197:2013 requirements.
Methods
This study was performed at the Institut für Diabetes-Technologie, Forschungs- und Entwicklungsgesellschaft mbH an der Universität Ulm (IDT) in Germany between March and July 2017. IDT is a testing laboratory, accredited by the Deutsche Akkreditierungsstelle GmbH, the national accreditation body for the Federal Republic of Germany, according to DIN EN ISO/IEC 17025:2005 and 98/79/EC in terms of several test procedures according to DIN EN ISO 15197. These test procedures include assessments of system accuracy, measurement repeatability and intermediate measurement precision. Prior to subject recruitment, the study was approved by the responsible ethics committee, and exempted from approval by the competent authority. All local regulations and requirements of Good Clinical Practice (DIN EN ISO 14155:2012) were followed.
Investigational Devices
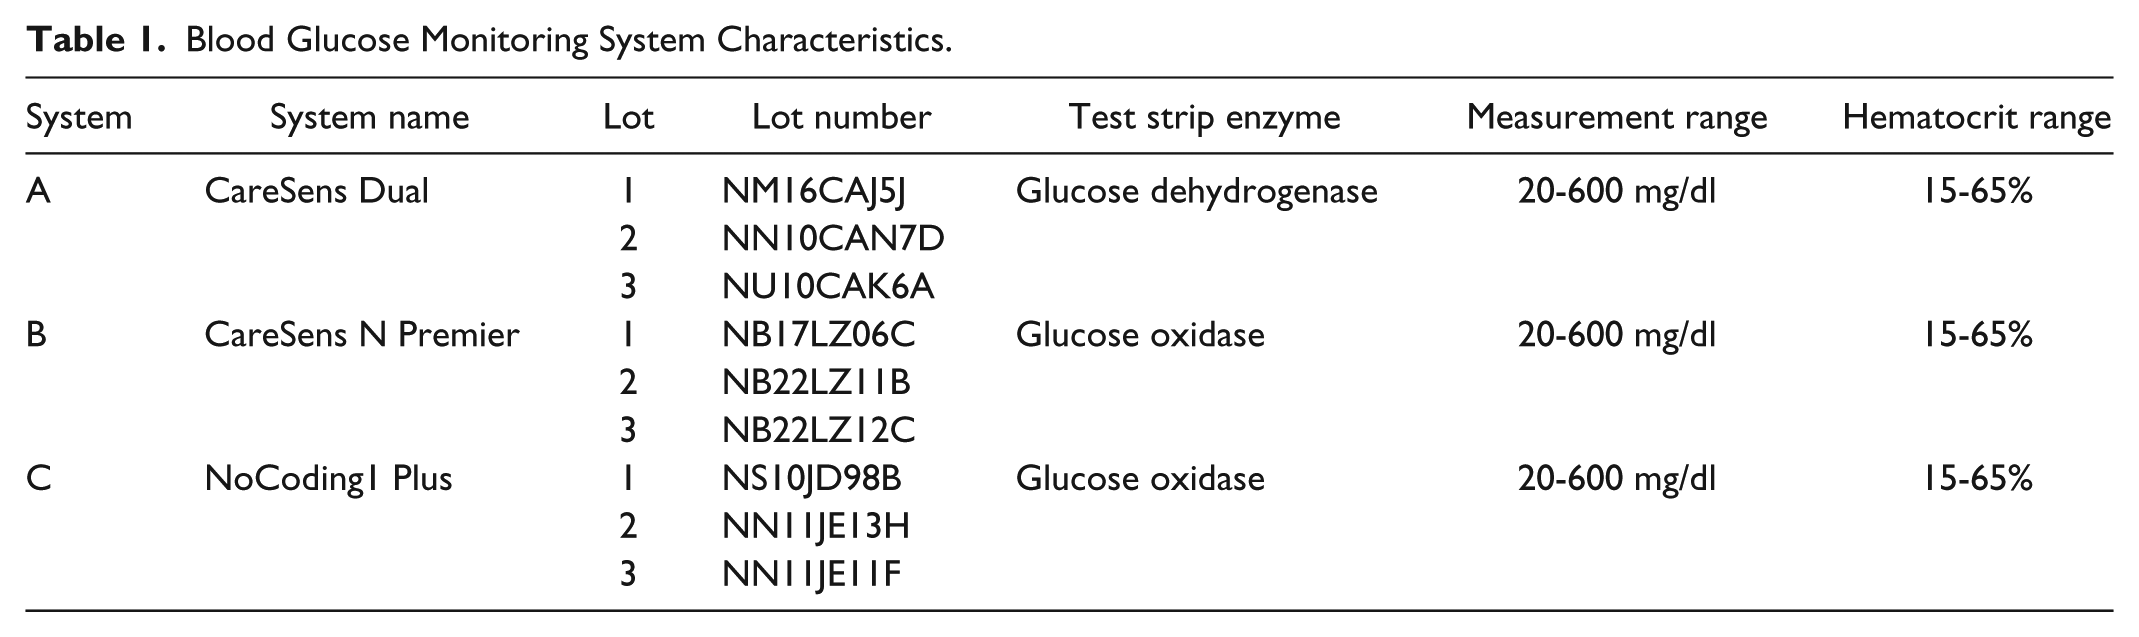
In the study, three different BGMS were used: CareSens™ Dual, CareSens™ N Premier, and NoCoding1 Plus (all i-SENS, Inc, Seoul, Korea). Study materials were provided by the manufacturer. The systems are designated as system A, system B, and system C, respectively. According to information provided by the manufacturer, system C is identical to the BGMS “TEE2 Plus” (data on file).
Additional information about the BGMS is provided in Table 1.
Blood Glucose Monitoring System Characteristics.
Study Procedures
Study procedures were based on requirements and procedures of ISO 15197:2013.
System Accuracy
Following ISO 15197:2013, each BGMS was used with three different reagent system lots (test strip lots). In total, 114 subjects were enrolled to obtain 100 evaluable data sets per BGMS.
For each BGMS, the measurement procedure was as follows: (1) collection of capillary blood from the fingertip to obtain plasma samples for duplicate measurement with the comparison method, a glucose-oxidase-based laboratory analyzer (YSI 2300 STAT Plus; YSI Inc, Yellow Springs, OH), (2) duplicate capillary BG measurements with each of three test strip lots of the BGMS (n = 3 × 200), (3) collection of capillary blood from the fingertip to obtain plasma samples for duplicate measurement with the comparison method.
Glucose concentration stability of the samples was verified by comparing the average of the duplicate comparison method measurement after the BGMS measurements with the average of the duplicate measurement before the BGMS measurements. If the difference was ⩽4 mg/dl or ⩽4% (for glucose concentrations <100 mg/dl or ⩾100 mg/dl), glucose concentration was deemed stable.
During the measurement procedure, an additional blood sample was drawn for hematocrit determination.
The samples’ glucose concentrations were distributed as stipulated in ISO 15197:2013: glucose concentrations ⩽50 mg/dl: 5 samples, >50 to 80 mg/dl: 15 samples, >80 to 120 mg/dl: 20 samples, >120 to 200 mg/dl: 30 samples, >200 to 300 mg/dl: 15 samples, >300 to 400 mg/dl: 10 samples, >400 mg/dl: 5 samples. Glucose concentrations ⩽50 mg/dl and >400 mg/dl could be obtained by glycolysis and glucose supplementation, respectively. Measurement results from the comparison method were used to assign samples to glucose concentration categories.
For adjusted samples, oxygen partial pressure was checked to be comparable to levels found in capillary blood samples using an OPTI™ CCA-TS (OPTI Medical Systems Inc, Roswell, GA, USA) blood gas analyzer. 2
Measurement Repeatability
Venous blood samples, as required by ISO 15197:2013, were drawn from five different subjects (one sample per subject). For each test strip lot of each BGMS, measurements were performed 10 times with each of 10 different meters on each sample. Measurements were performed on four different days; measurements with all test strip lots from all BGMS on one sample were performed on the same day. Before and after the BGMS measurements, aliquots were collected for plasma separation and subsequent duplicate measurement with a glucose-oxidase-based laboratory analyzer (YSI 2300 STAT Plus).
Samples could be adjusted to specific glucose concentrations (1 sample per concentration category): 30 to 50 mg/dl, 51 to 110 mg/dl, 111 to 150 mg/dl, 151 to 250 mg/dl, 251 to 400 mg/dl. The average BGMS result from each sample (based on a series of n = 300 measurements) was used to verify that each concentration category was covered by one sample.
Sample temperature was measured before and after measurements with each of the test strip lots, and the difference was checked to be within ±2°C. Glucose concentration stability of the sample was verified in the same manner as for system accuracy.
Intermediate Measurement Precision
Intermediate measurement precision was analyzed, per ISO 15197:2013, by using control solution with three different glucose concentration levels intended for use with the respective BGMS. To establish intermediate measurement precision with each control solution level, one measurement was performed with each of 10 meters per BGMS and per test strip lot on each of 10 days. In total, 300 measurements were performed per control solution level with each BGMS.
ISO 15197:2013 requires that the control solution samples shall have glucose concentrations between 30 and 50 mg/dl, between 96 and 144 mg/dl, or between 280 and 420 mg/dl. The average BGMS result from each control solution sample (based on a series of n = 300 measurements) was used to verify that each glucose concentration category was covered. Stability of the control solution’s glucose concentration was verified by performing daily duplicate measurements with a glucose-oxidase-based laboratory analyzer (YSI 2300 STAT Plus) before and after the BGMS measurements. If the difference between the minimum and the maximum of all average duplicate measurements of a specific control solution sample was ⩽4 mg/dl or ⩽4% (for glucose concentrations <100 mg/dl or ⩾100 mg/dl, respectively), that control solution sample’s glucose concentration was deemed stable.
Following the manufacturer’s instructions for use, control solution measurements with the BGMS were performed at temperatures between 20 and 25°C.
Based on ISO 15197:2013 requirements, measurements were performed by multiple users: For each BGMS, the 10 meters were split between two different users.
Data Analysis
Data analysis based on requirements and procedures of ISO 15197:2013.
System Accuracy
Differences were calculated between individual BGMS measurement results and the average of the corresponding comparison method measurement results obtained immediately before and after the BGMS measurement. According to ISO 15197:2013, ⩾95% of these differences shall be within ±15 mg/dl for comparison method glucose concentrations <100 mg/dl and within ±15% for glucose concentrations ⩾100 mg/dl. In addition, ISO 15197:2013 stipulates that ⩾99% of individual measurement results shall fall within zones A and B of the consensus error grid, which assesses clinical relevance of measurement results.
Agreement of the BGMS measurement results and the comparison method results was plotted in difference plots. Each plot contains measurement data from all three test strip lots of one BGMS.
In addition, measurement bias was calculated according to Bland and Altman, 3 and surveillance error grid (SEG) analysis was performed. The SEG was introduced to assist in the postmarket surveillance of BGMS by regulatory authorities and manufacturers. 4
For all systems, data from some samples were excluded if the comparison method’s quality control measurement was outside the acceptable limits or not obtained, if study personnel documented an error in performing the test procedure, if the acceptance criterion for sample stability was exceeded, or if the glucose concentration category was already filled.
Individual measurements were repeated if an error message was displayed or if an insufficient blood volume was applied.
Measurement Repeatability
For each glucose concentration (ie, sample) and each BGMS, the mean BGMS result as well as the standard deviation (SD) for samples with mean BGMS result <100 mg/dl and the coefficient of variation (CV) for samples with mean BGMS result ⩾100 mg/dl were calculated for each test strip lot separately.
Individual measurements were repeated if an insufficient control solution volume was applied or if study personnel documented an error in performing the test procedure.
Intermediate Measurement Precision
For each glucose concentration, the mean BGMS result as well as SD for samples with mean BGMS result <100 mg/dl and CV for samples with mean BGMS result ⩾100 mg/dl were calculated for each test strip lot separately. In addition, the following components of variance were analyzed: meter, test strip vial, test strip lot, user, and measurement day.
Individual measurements were repeated if an insufficient blood volume was applied or if study personnel documented an error in performing the test procedure.
Results
System Accuracy
Glucose concentrations were distributed according to ISO 15197:2013 and ranged from 35 mg/dl to 451 mg/dl for system A and from 36 mg/dl to 447 mg/dl for systems B and C. For the three investigated BGMS, 96% to 98% (system A), 97% to 98% (system B), and 96.5% to 97.5% (system C) of results were found within ±15 mg/dl or ±15% of the comparison method results (see also Table 2, Figure 1). For all BGMS, all measurement results were found within the clinically acceptable zones A and B of the consensus error grid (Table 2). SEG analysis showed that all measurement results were associated with risk scores ⩽1, indicating no or only slight risk of hypo- or hyperglycemia (Table 2).
System Accuracy Results and Measurement Bias for the Three Investigated Blood Glucose Monitoring Systems.
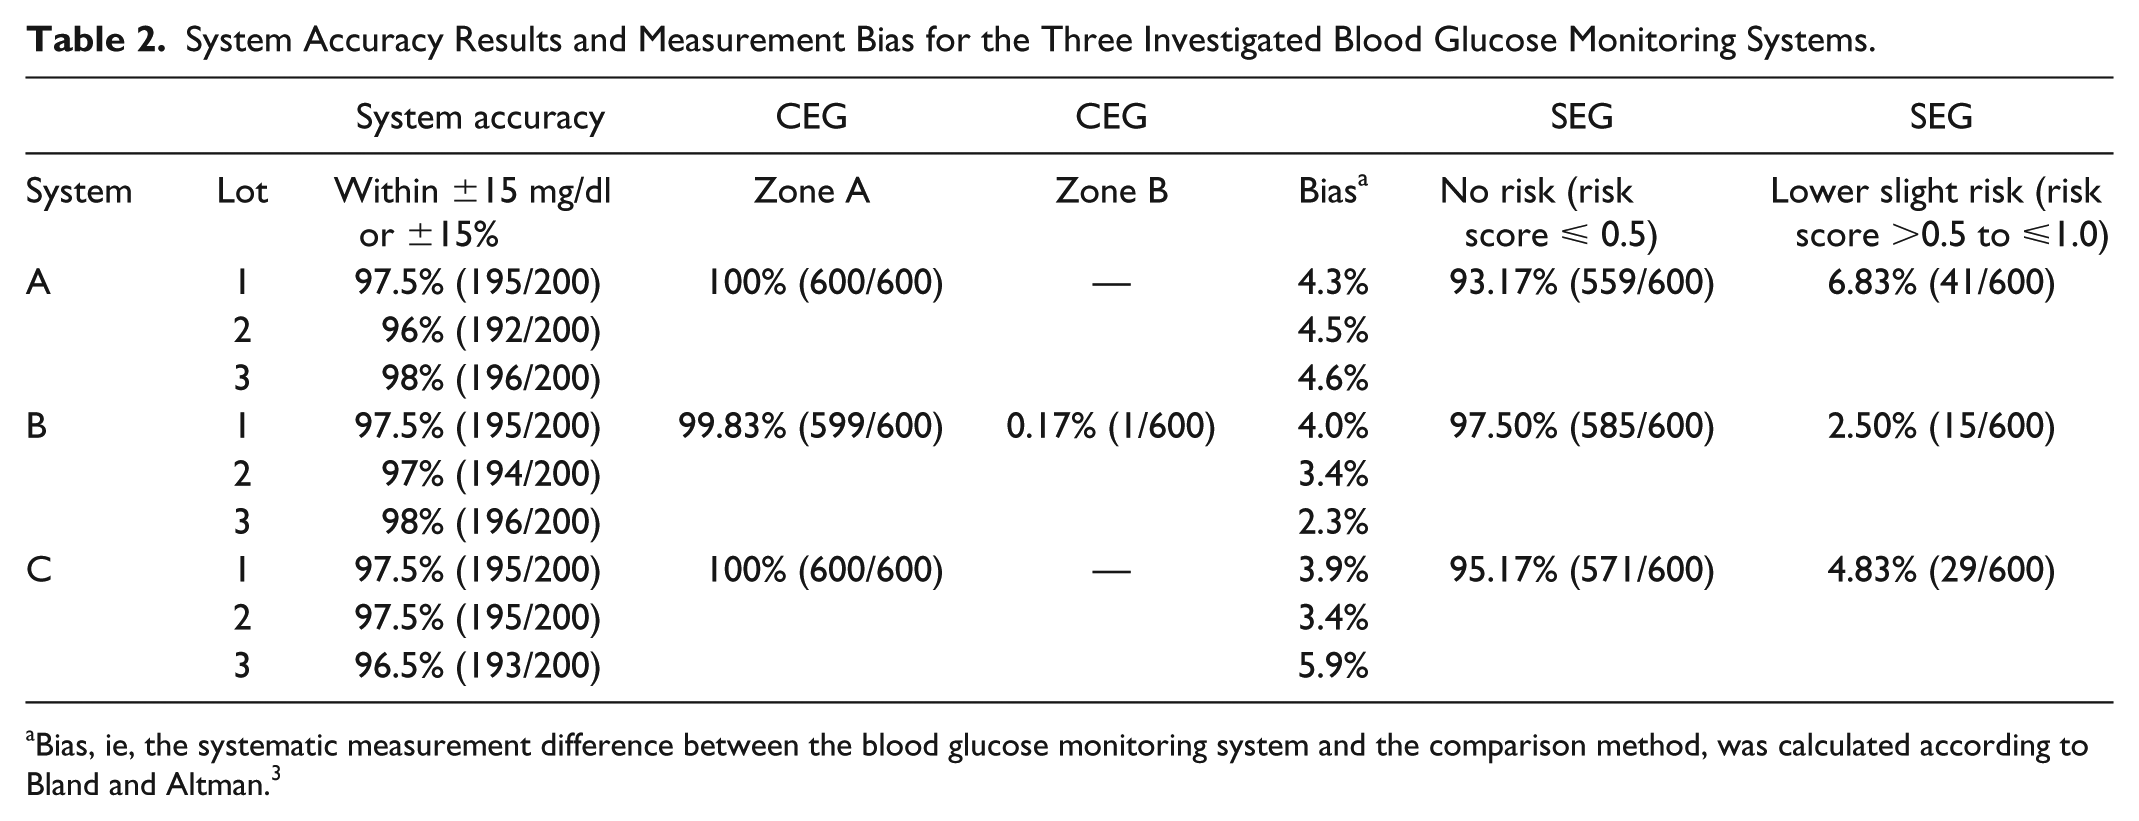
Bias, ie, the systematic measurement difference between the blood glucose monitoring system and the comparison method, was calculated according to Bland and Altman. 3
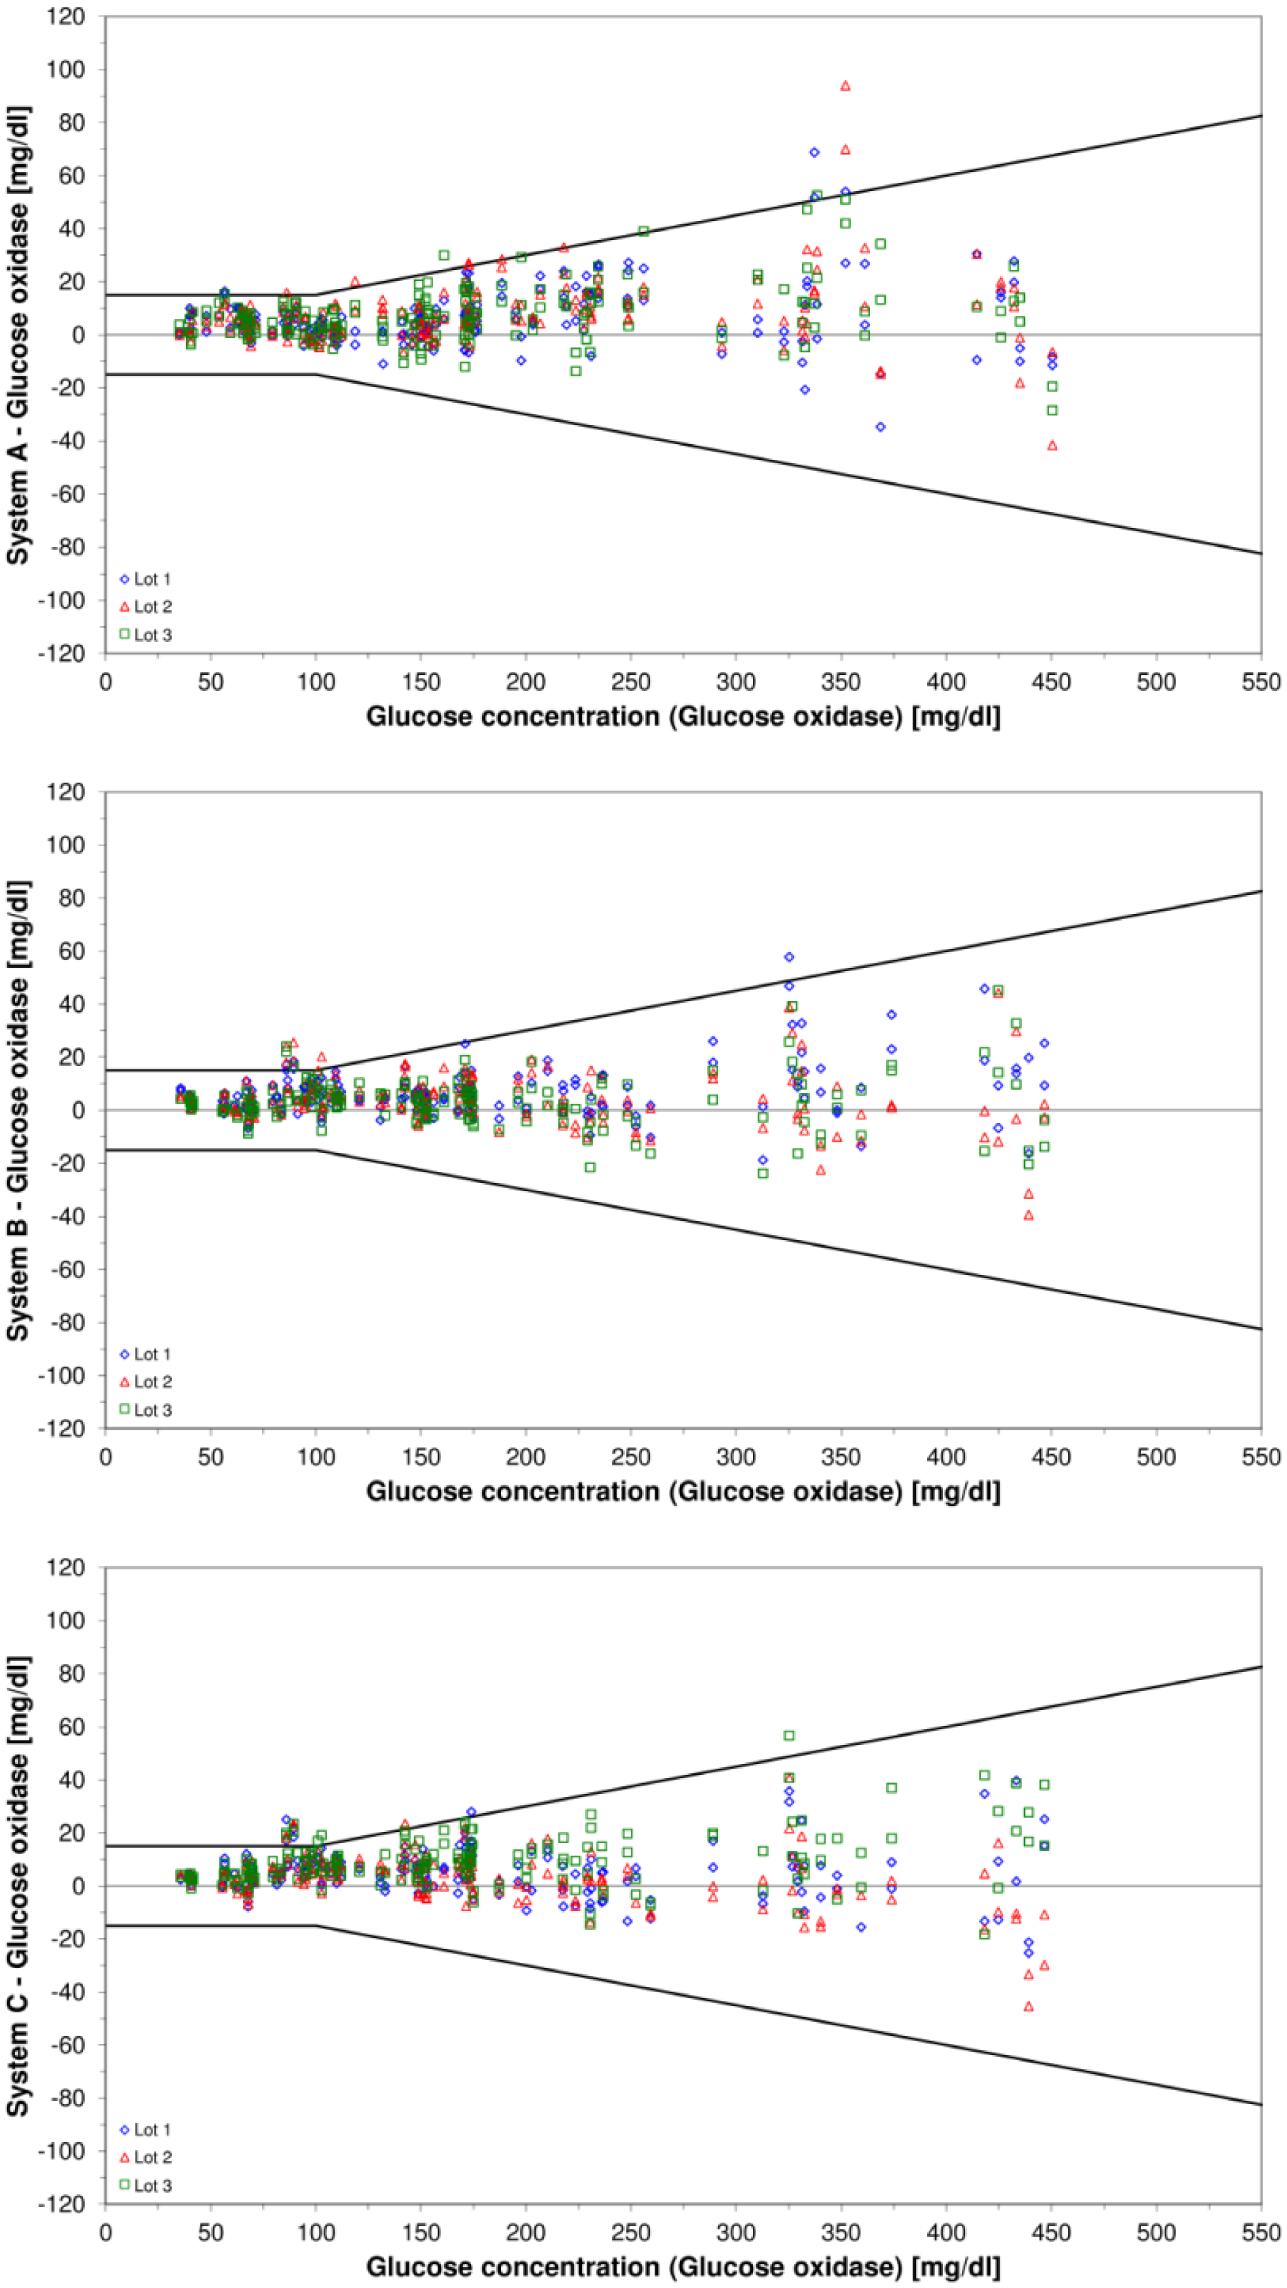
Difference plots for the three investigated blood glucose monitoring systems. Bold black lines indicate system accuracy limits of ISO 15197:2013/EN ISO 15197:2015. The three investigated test strip lots are displayed in different colors and icons.
Systematic differences of 2.3% to 5.9% between BGMS results and comparison method results were found (Table 2). Among the three test strip lots per BGMS, these differences varied by 0.3% for system A, 1.7% for system B, and 2.0% for system C.
Measurement Repeatability
For samples with glucose concentrations <100 mg/dl, SD was ⩽3.4 mg/dl for system A, ⩽2.9 mg/dl for system B, and ⩽2.6 mg/dl for system C (Table 3). For samples with glucose concentrations ⩾100 mg/dl, CV was ⩽3.9% for system A, ⩽3.4% for system B, and ⩽3.0% for system C (Table 3).
Measurement Repeatability Results for the Three Investigated Blood Glucose Monitoring Systems.
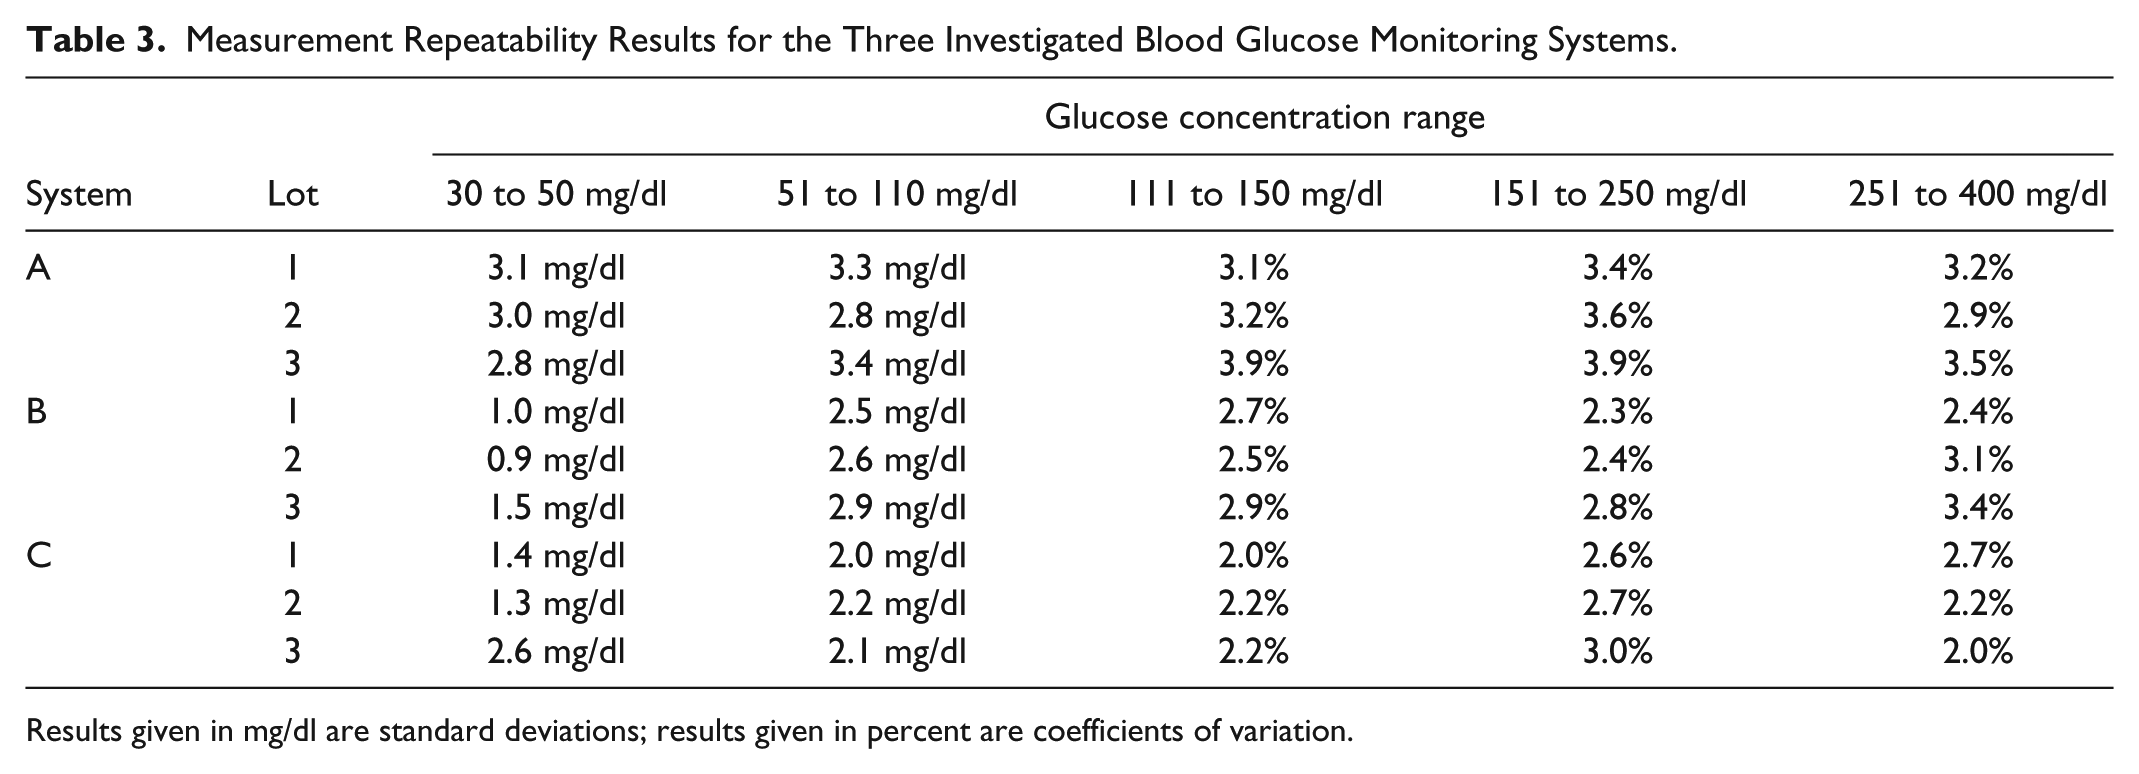
Results given in mg/dl are standard deviations; results given in percent are coefficients of variation.
Intermediate Measurement Precision
For control solution samples with glucose concentrations <100 mg/dl, SD was ⩽1.0 mg/dl for systems A and B, and ⩽1.3 mg/dl for system C (Table 4).
Intermediate Measurement Precision Results for the Three Investigated Blood Glucose Monitoring Systems.
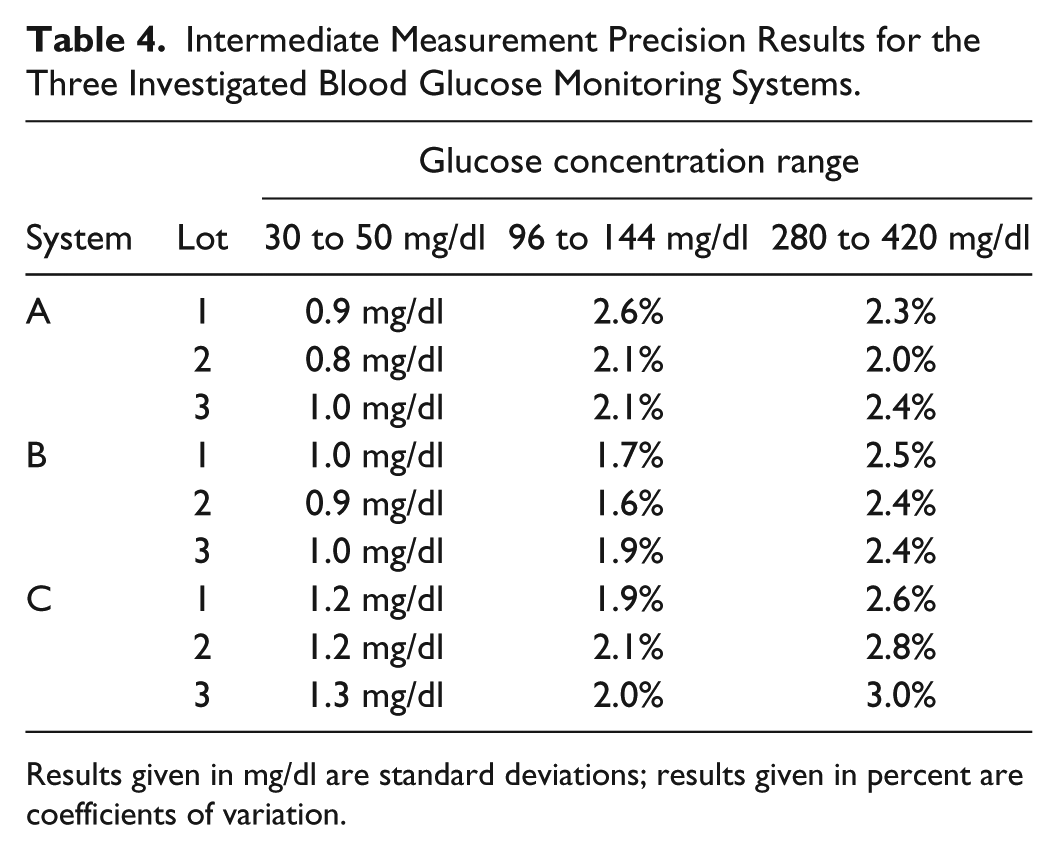
Results given in mg/dl are standard deviations; results given in percent are coefficients of variation.
For control solution samples with glucose concentrations ⩾100 mg/dl, CV was ⩽2.6% for system A, ⩽2.5% for system B, and ⩽3.0% for system C (Table 4).
Analysis of components of variance showed that none of the documented components (BGMS meter, test strip vial (dependent from the meter), test strip lot, user or measurement day) had a systematic, relevant effect on the intermediate measurement precision.
Discussion
In this study, system accuracy and measurement precision of three BGMS were investigated based on procedures defined in ISO 15197:2013/EN ISO 15197:2015. System accuracy is an important factor in the analytical performance of BGMS. If the deviation of BGMS results from the “true” current BG concentration (estimated by corresponding comparison results) is too large, this can adversely affect the quality of diabetes therapy. Precision analysis offers additional insight into the analytical performance, because it reflects how well results from a series of measurements from the same sample match each other.
All three investigated BGMS fulfilled ISO 15197:2013 requirements regarding system accuracy, exhibiting small systematic differences from the comparison method that were consistent among the BGMS’ test strip lots. Some reports about other BGMS show marked variations in analytical performance between different test strip lots.5-7 For diabetes patients who base their therapeutic decisions on BG measurements, varying bias may pose a problem, because they would have to react differently to the same displayed results when switching from one test strip lot to the next, even if the BGMS exhibited excellent precision. However, diabetes patients would not know beforehand how to react, and some may not even be aware of lot-to-lot variability of their BGMS.
Based on error grid analyses, all measurement results from the investigated systems showed clinically acceptable deviations from the comparison method results, with no or only slight risk of hypo- or hyperglycemia. In this study, both CEG analysis and SEG analysis were performed. The SEG is a more modern approach than the CEG, which was published in 2000. The SEG was introduced to assist in the postmarket surveillance of BGMS by regulatory authorities and manufacturers, 4 and in contrast to the CEG, risk is not assessed by 5 different risk zones, but on a near-continuous scale of individual risk scores.
Regarding measurement precision, ISO 15197:2013 does not define minimum requirements; this is also true for the current FDA guidance on over-the-counter BGMS. 8 The results found for the three investigated BGMS (SD ⩽3.4 mg/dl for blood samples and SD ⩽1.3 mg/dl for control solution as well as CV ⩽3.9% for blood samples and CV ⩽3.0% for control solution) are similar to those reported for other BGMS.9-11 In addition, they were found to be consistent with the manufacturer’s labeling of the investigated devices. The Scandinavian Evaluation of Laboratory Equipment for Primary Health Care (SKUP) group defines a quality goal of CV ⩽5.0%, although their methodological approach differs from that of ISO 15197:2013. 12 It should be pointed out that according to ISO 15197:2013, the preferred sample types for measurement repeatability and intermediate measurement precision are venous blood and control solution, respectively, regardless of whether the investigated BGMS is intended to be used with venous blood. This may be due to sample stability over prolonged periods of time and large sample volumes that are required in assessing precision. Nevertheless, measurement issues due to the different sample matrix may arise at least for venous blood samples, although they likely lead to a systematic effect and, therefore, should not affect precision assessments.
This study’s results may not fully represent the analytical performance of the investigated systems under everyday conditions, because measurements were performed by trained personnel in a controlled environment, as required by ISO 15197:2013. Furthermore, BGMS materials (ie, meters, test strips, and control solution) were provided by the manufacturer, so that transport and storage conditions of BGMS purchased at a pharmacy may differ. Results from other studies indicate that performance in the hands of diabetes patients may differ from that in the hands of trained personnel.13-17 In addition, environmental and storage conditions can affect analytical performance.18,19
Various BGMS performance assessments that were published over the last years indicate that not all BGMS fulfill internationally accepted criteria like those of ISO 15197:2013 or the FDA guidance documents. Market availability in itself is not a guarantee for adequate performance, even in jurisdictions that incorporate formal approval, like the United States. 20 Independent assessment of analytical performance should, therefore, not only be performed prior to market introduction, but also afterward, 20 to ensure patient safety.
Conclusion
In summary, system accuracy and measurement precision were assessed for three BGMS. System accuracy requirements of ISO 15197:2013 were fulfilled. In absence of measurement precision requirements, results were found to be consistent with the manufacturer’s labeling of the investigated devices.
Footnotes
Acknowledgements
The authors would like to thank the subjects who participated in the study as well as Manuela Link, MD, Martina Tesar, Natalie Neuburger, Tuba Alkan, and other IDT staff, who contributed to the conduct of the study.
Abbreviations
BGMS, blood glucose monitoring system; CEG, consensus error grid; CV, coefficient of variation; ISO, International Organization for Standardization; SD, standard deviation; SEG, surveillance error grid.
Declaration of Conflicting Interests
The author(s) declared the following potential conflicts of interest with respect to the research, authorship, and/or publication of this article: GF is general manager of the IDT (Institut für Diabetes-Technologie, Forschungs- und Entwicklungsgesellschaft mbH an der Universität Ulm, Ulm, Germany), which carries out clinical studies on the evaluation of BG meters and medical devices for diabetes therapy on its own initiative and on behalf of various companies. GF/IDT have received speakers’ honoraria or consulting fees from Abbott, Ascensia, Bayer, LifeScan, Menarini Diagnostics, Metronom Health, Novo Nordisk, Roche, Sanofi, Sensile and Ypsomed. SP, NJ, AB, JM, and CH are employees of the IDT.
Funding
The author(s) disclosed receipt of the following financial support for the research, authorship, and/or publication of this article: The study was funded by i-SENS, Inc, Korea, and medical writing was supported by i-SENS GmbH, Germany.