
Abstract
Background:
The goal of this uncontrolled pilot study was to assess the feasibility of a self-care management mobile app, called Sugar Sleuth, which incorporates the FreeStyle Libre™ glucose sensor, to help clinicians and people with type 1 diabetes (PWD) identify and mitigate self-care behaviors that contribute to glucose variability.
Methods:
PWDs with a baseline A1c between 7.5 and 9.0% used the mobile app for 14 weeks. The app prompted the PWD to enter the suspected cause of detected glycemic excursions, and to record food and insulin information. PWDs met with clinicians to collaboratively review data, identify challenges, and devise a specific self-care plan. Outcome measures included a single glycemic outcome score (SGOS) and attitude rating scales to better understand how participant attitudes could affect glycemic outcome.
Results:
Thirty enrolled PWDs had a mean age of 55 ± 2.6 years, and a mean diabetes duration of 32 ± 2.9 years. A significant average reduction in A1c of 0.5 ± 0.07% (P < .01) and in mean daily carbohydrate intake of 43 ± 21 grams (P = .05) was found. No statistically significant change in glycemic metrics, body weight, or total daily insulin dose was found. A significant negative association occurred between SGOS and “hypoglycemia tolerance” (P = .04), and a positive correlation occurred that approached significance with “motivation to change behavior” (P = .06).
Conclusions:
These findings suggest that this mobile app system, in conjunction with CGM, provides a useful platform for helping clinicians and adults with T1D improve self-management skills to improve glycemic control.
It is well known that glycemic variability limits the ability of people with diabetes (PWD) on insulin to reach their A1c target without causing excessive hypoglycemia.1-5 Thus, it is important to include a measure of glycemic variability in continuous glucose reports.6-10 However, identifying the actual causes of variability for PWDs, and successfully addressing their causes, can be a daunting task for both PWDs and clinicians. For those on basal/bolus insulin therapy, the clinical focus is usually on the modification of self-care behaviors and nutrition choices.
This pilot study was designed to optimize the performance of a glucose-sensor-based tool that we call the Sugar Sleuth system that uses a specially designed mobile app and web-based report software that is integrated with the FreeStyle Libre™ glucose sensor. The system was designed to identify the most prevalent causes of glucose episodes—highs, lows and rapid rises—that contribute to variability, and to provide reports in which the clinician and PWD can quickly understand the key problem that needs to be addressed. This pilot study was designed to learn how clinicians and adults with T1D make use of a system that identifies self-care behaviors impacting glucose variability and displays data in an easy, meaningful way to direct a clinical conversation about behavioral and nutritional change. Another goal was to gain a better understanding of which PWD behavioral attributes contributed to or impeded improved outcomes so that they could be addressed in clinical care. Optimization of system’s components was performed during the study. Thus, this demonstration study does not include a control arm.
Methods
Subjects
This was an investigator-initiated pilot study to assess usability and efficacy of a new smartphone app. This single-center, single-arm, observational study was conducted at the Joslin Diabetes Center. The study was approved by the Joslin Institutional Review Board and written informed consent was obtained from each participant. Thirty adults with T1D for at least 1 year, aged 25-75, treated with multiple daily injections or insulin pump, and with A1c between 7.5 and 9.0% were recruited from the Joslin Clinic. Participants were contacted via email, phone call or referred by clinicians on the research team. Exclusion criteria included current or past use of real-time continuous glucose monitoring (CGM) for more than 2 months, pregnancy, currently participation in another study, history of eating disorders, current attempt to lose weight, BMI > 30 kg/m2, medical conditions, or medications that would affect gastric emptying and assessment of the impact of dietary changes.
The Sugar Sleuth System
The Sugar Sleuth system integrates the FreeStyle Libre sensor with a smartphone app and web-based report software that captures the uploaded glucose data from the app. The system was conceived as a result of a collaboration between clinicians (HW and ET) at Joslin and the engineering team at Abbott to uncover self-management skills that may contribute to glucose variability, and to present this information in a way that can be easily understood by clinicians and PWD. Upon scanning the sensor, the app analyzes the last 8 hours of glucose data and generates a prompt for more information from the PWD if a high, low, or rapid-rise episode is detected. The prompt provides the PWD with a checklist of self-care issues that might have been the cause of the episode, for example, high carb meal. The web-based report software highlights the most prevalent episode causes and the time of day when they occurred, and facilitates easy identification of the most important daily traces—those containing information relevant to the most prevalent episode causes. This structured method enables time-efficient and valuable personalized conversation with the PWD about behaviors that have the greatest impact on reducing variability. The early study experience identified that system was effective at identifying episodes of glucose variability and self-management issues. However, participants needed better support regarding behavior change.
Therefore, the system was implemented with a shared agreement feature an “action plan” that identifies a specific self-care action to mitigate glucose variability. In the app there were added reminders to provide behavioral change reinforcement and time-based metrics reports to evaluate the effects of changes in treatment and behavior (Figure 1).
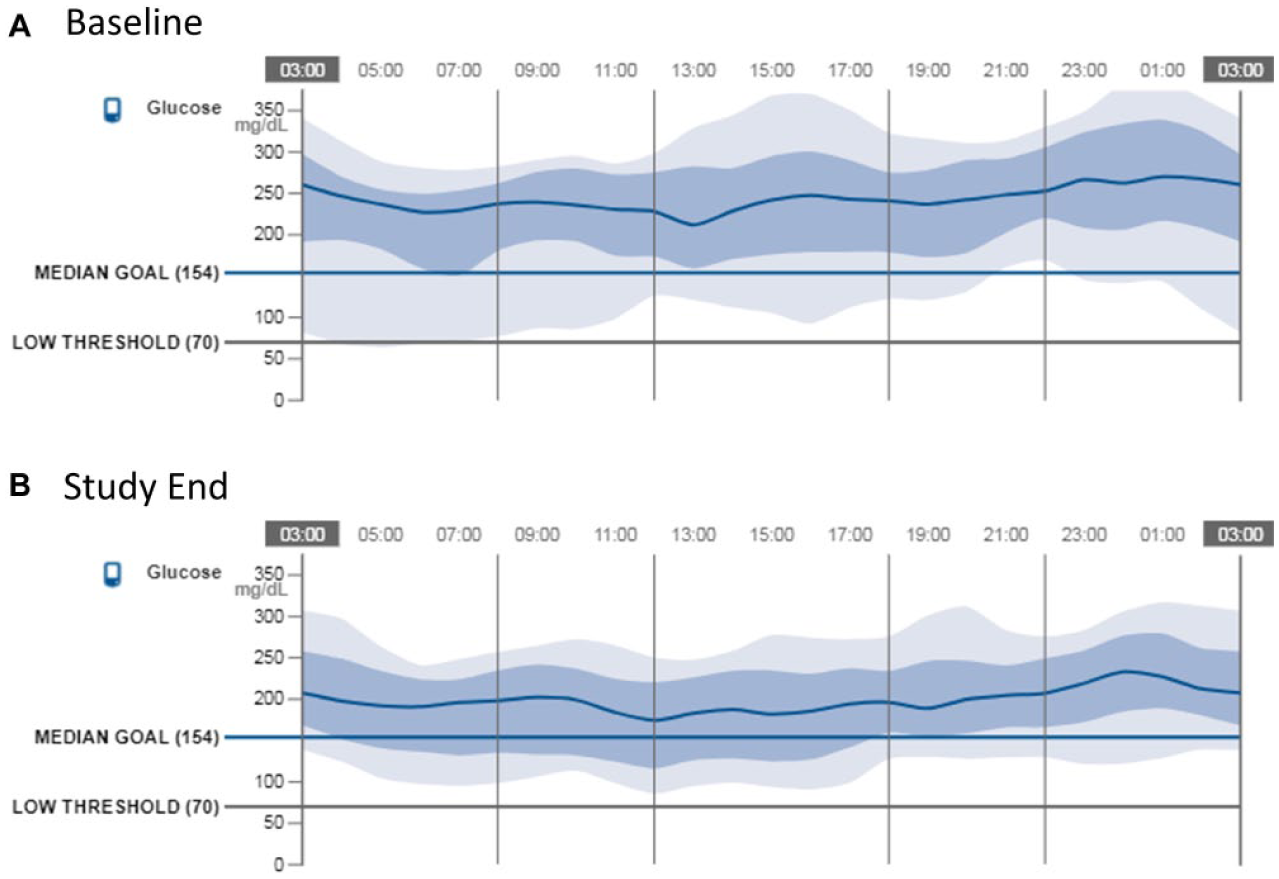
AGP comparison for participant with dietary issues.
Study participants were also asked to review a web-based nutrition education program designed to assist in understanding how food intake affects glycemic variability. The program was designed to cover basic information on food and glycemic effect, reviewing the most common postprandial scenarios such as a rapid morning spike; a rise later than expected (eg, fatty food); and an unexpected increase or decrease in glucose levels. Thus, the app- and web-based report software, in conjunction with the glucose sensor, provides an integrated, comprehensive system for detecting glycemic variability, specific problem identification, associated problem cause, plan for corrective action, and monitoring of intervention effects.
Procedure
Participants attended five clinic visits over 14 weeks. At the initial visit, participant baseline characteristics were obtained, and A1c was measured. Clinicians provided participants with a glucose sensor and a smartphone with the Sugar Sleuth app. At the second visit, the clinician and participant reviewed the participant’s glucose data using the web-based report software, and the participant was trained on the use of the app. The participant was also introduced to the nutritional education software. At the third visit, the clinician and participant reviewed their glucose data and contextual information provided by the Sugar Sleuth report software. The clinician provided guidance on food choices based on the number and extent of glycemic excursions.The fourth visit was a “virtual” visit where the subject was called by the study clinician to review the latest results and to make changes accordingly. At the last visit, A1c was measured and all sensor glucose data were collected using the Sugar Sleuth report software. Additional protocol details are available at ClinicalTrials.gov (NCT02556398).
Outcome Measures
Four sets of outcome measures were included. First, A1c was measured and glycemic metrics were calculated based on glucose sensor data at baseline and 14 weeks. The glycemic metrics were calculated for the baseline period, defined as the first two weeks of sensor wear (the first 18 subjects were “blinded” to the sensor data for the first two weeks, while the last 12 started the study “unblinded”), and the study end period, defined as the last two weeks of sensor wear. The following glycemic metrics were calculated: estimated A1c (eA1c), 11 standard deviation, time above 240 mg/dL, time above 180 mg/dL, time in target (70-180 mg/dL), time below 70 mg/dL, and time below 55 mg/dL. In addition, to determine if the peaks and valleys of the glucose excursions were attenuated, we also calculated area under 55 mg/dL, area under 70 mg/dL, area above 180 mg/dL, and area above 240 mg/dL.
Second, the total daily nutrient intake measures—energy, carbohydrates, fat, and protein—were calculated using the Nutrition Data System for Research program of the University of Minnesota. 12 To measure changes in nutritional intake, participants received an unannounced phone call to obtain information about food intake for three recent days between visits 1 and 2 (initial), and again between visits 4 and 5 (final). In addition, each participant’s total insulin intake was determined at visit 1 (initial) and again at visit 5 (final).
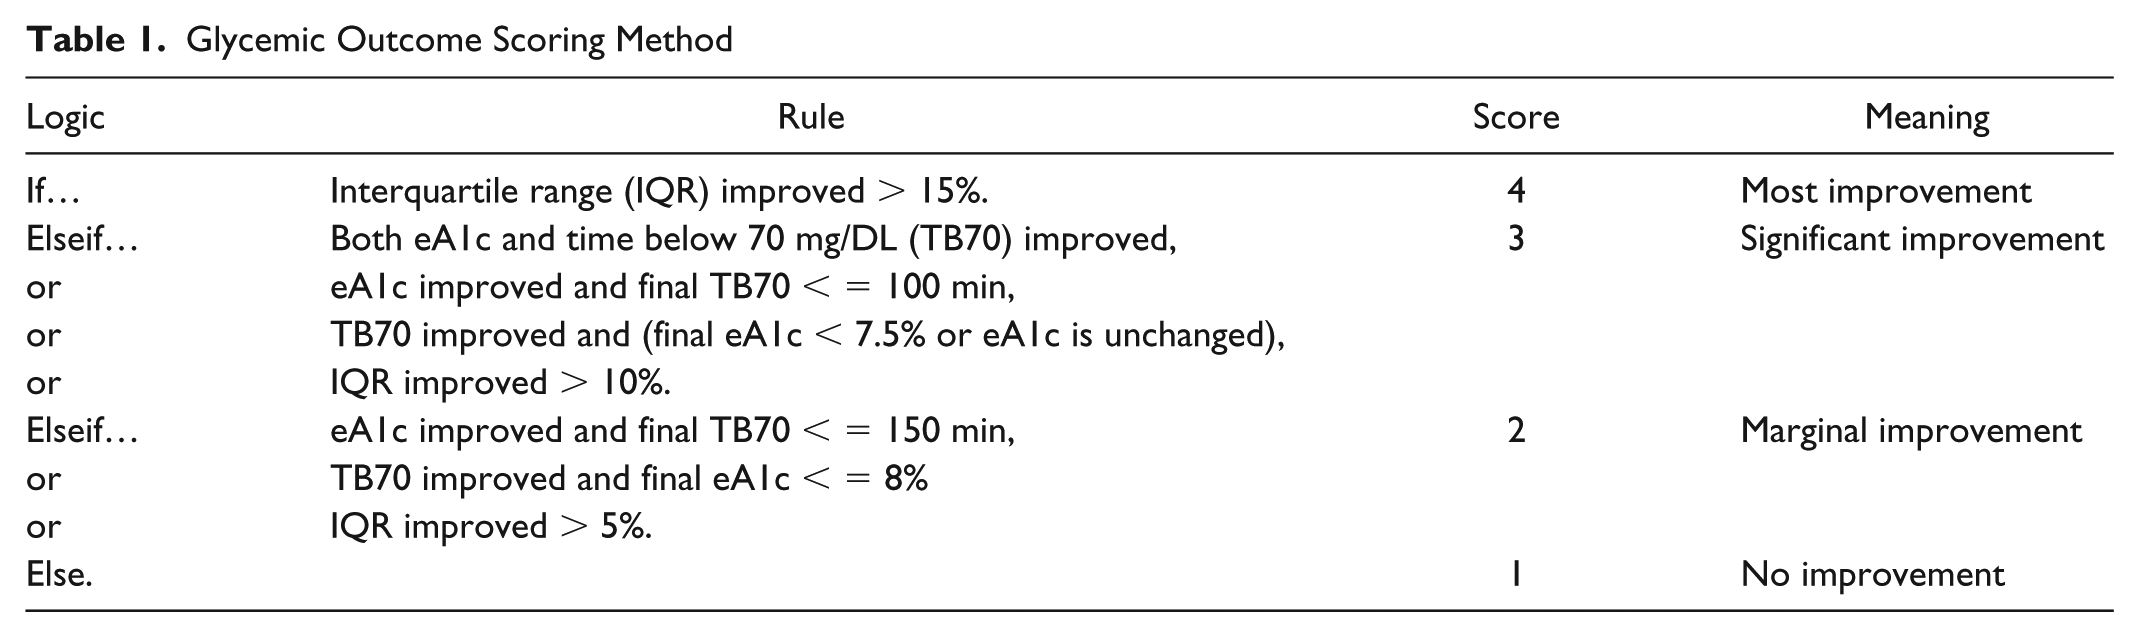
Third, to better understand which participant attitudes were important promoters or barriers to glycemic outcome improvement, we developed a single glycemic outcome score (SGOS) that could be correlated with various subject attributes scored by the clinicians. This metric attempts to account for complex opposing goals of reducing hyperglycemia without causing excessive hypoglycemia. The algorithm for computing SGOS is presented in Table 1.
Glycemic Outcome Scoring Method
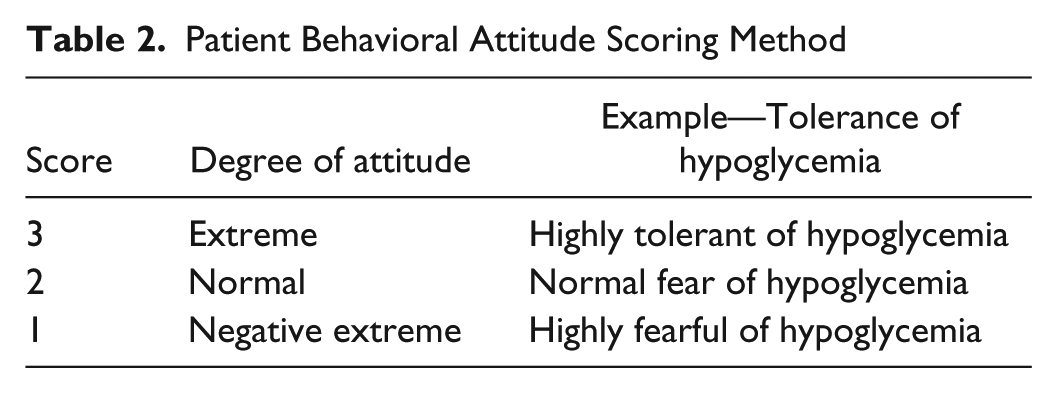
Fourth, to assess the subtle aspects of the participants’ approach to the technology and their glycemic management, study clinicians provided the following ratings for each participant: “tolerance of hypoglycemia,” “consistent eating habits,” “motivation to change behavior,” and “technological sophistication/numeracy.” A three-level scoring system (Table 2), anchored at both extremes, was used to assess each construct.
Patient Behavioral Attitude Scoring Method
Data Analyses
In addition to descriptive statistics, the average change and associated two-sided significance level was determined for each outcome measure. Spearman correlations between changes in SGOS score and changes in nutritional intake, weight, and insulin usage and attitude ratings were computed.
Results
Baseline Characteristics
Thirty participants with T1D were enrolled between September 2015 and July 2017 and all participants completed the 14-week study period. The participant’s baseline characteristics are presented in Table 3.
Baseline Characteristics.
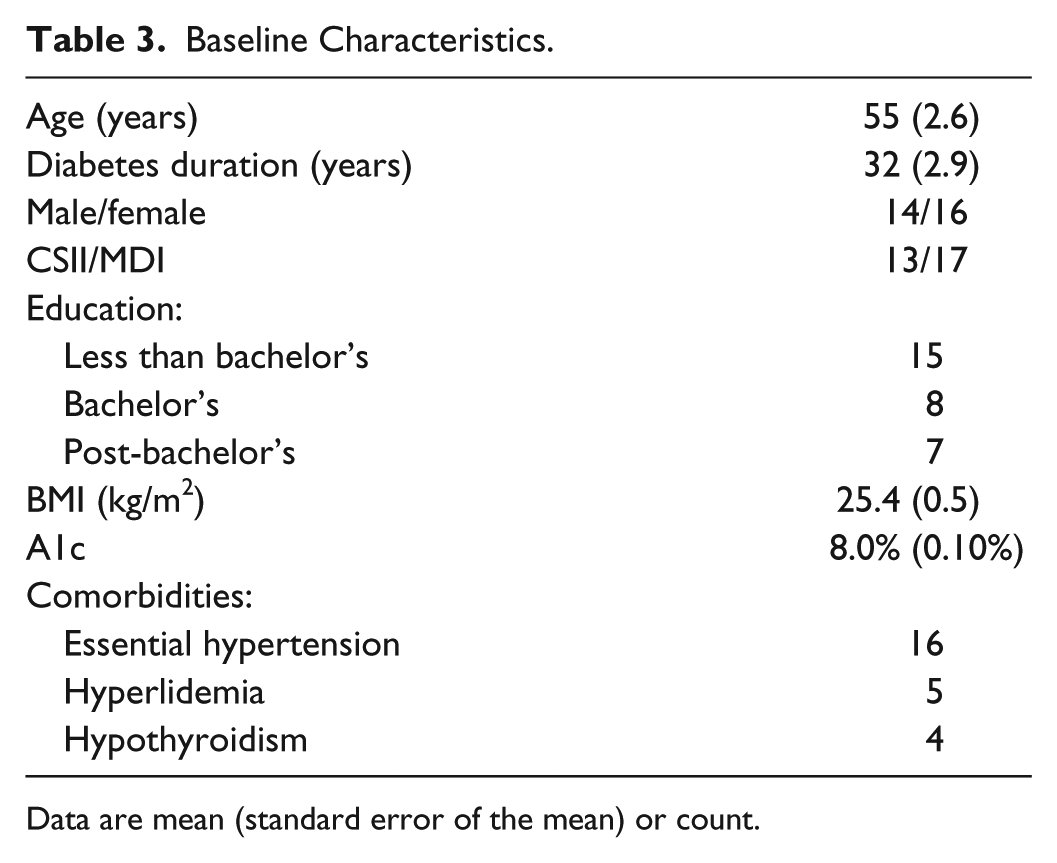
Data are mean (standard error of the mean) or count.
Glycemic Measures
Changes in glycemic metrics between baseline and the end of the study are shown in Table 4. There was a statistically significant average reduction in A1C of 0.5 ± 0.07%, from a mean of 8.0% to a mean of 7.5% (p < .01), with A1C improvement of 0.1% or more recorded in 29 of the 30 participants. Measures showing reduction in hypoglycemia approached statistical significance: reduction in time below 55 mg/dL of 17 minutes (57 min to 40 min; P = .06); relative reduction in area below 55 mg/dL of 34% (P = .06); and a relative reduction in area below 70 mg/dL of 25% (P = .08).
Changes in Glycemic Measures.
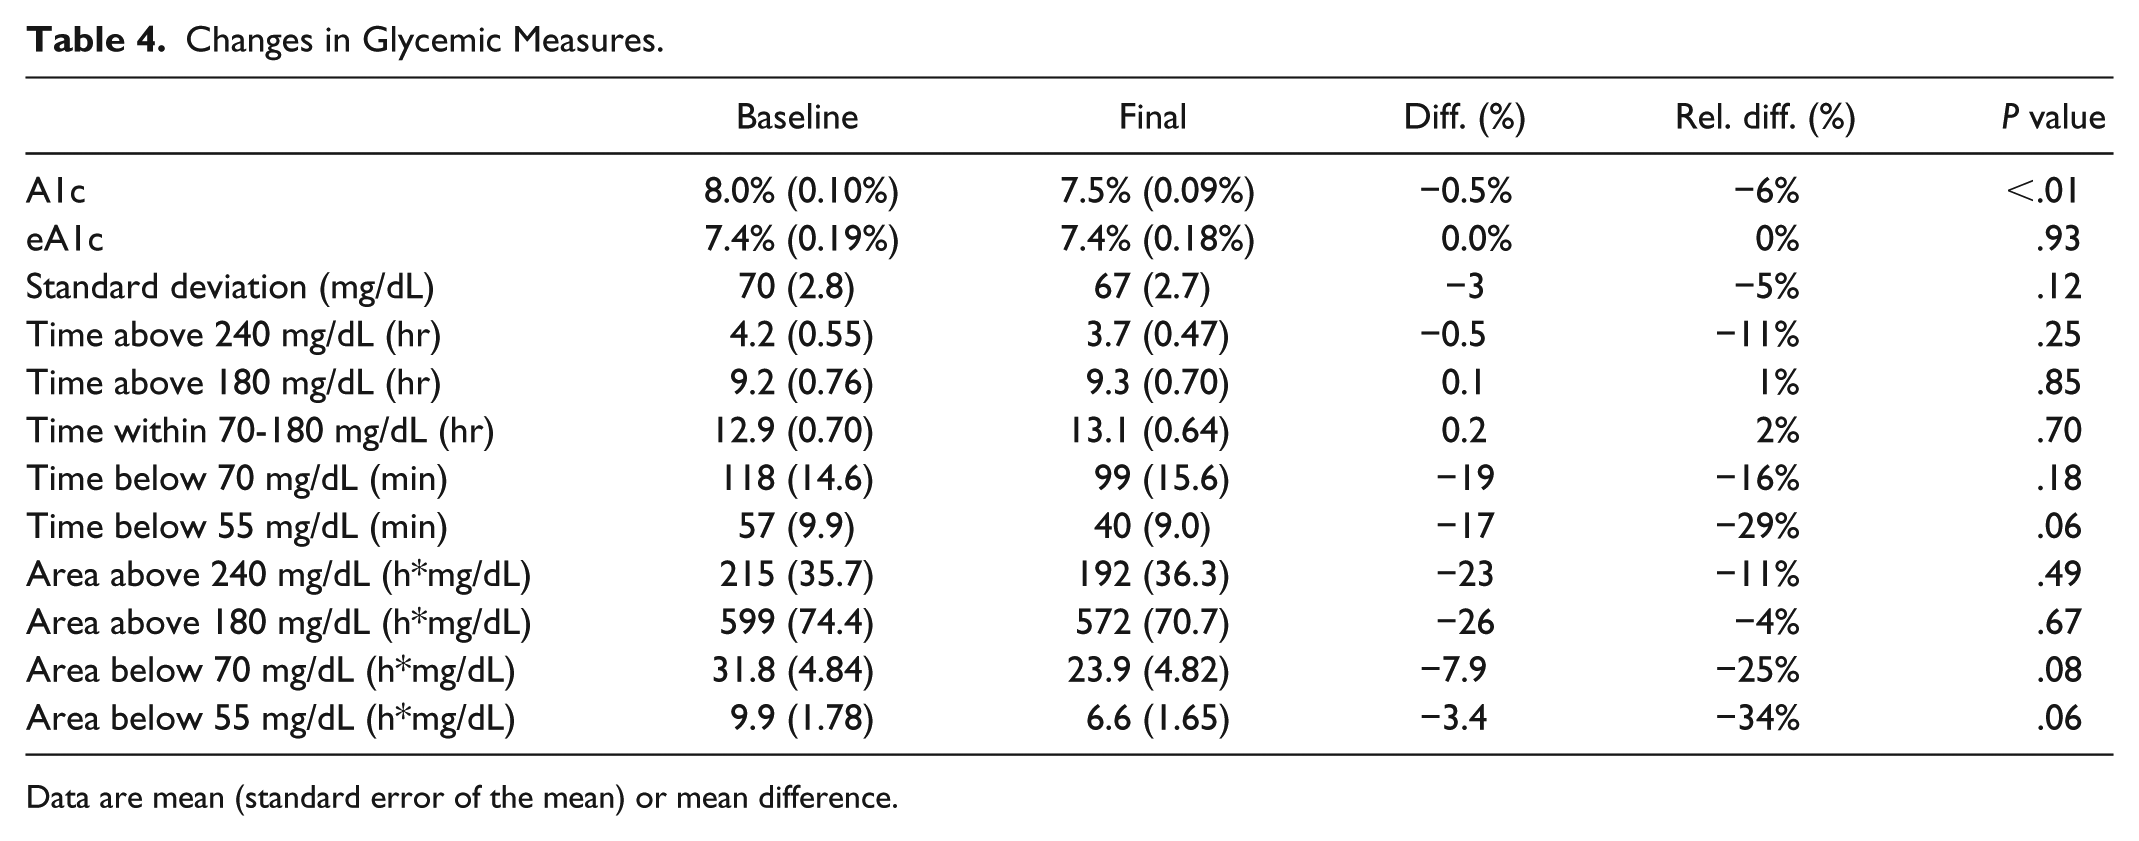
Data are mean (standard error of the mean) or mean difference.
Nutrition and Insulin Measures
The baseline and final nutrition and insulin intake measures are shown in Table 5. There was a statistically significant reduction in mean daily intake of carbohydrates of 43 ± 21 grams (235 to 192 grams, P = .05) over the 14-week trial. No other dietary measure or total insulin taken displayed a significant change over time.
Changes in Nutrition and Insulin.
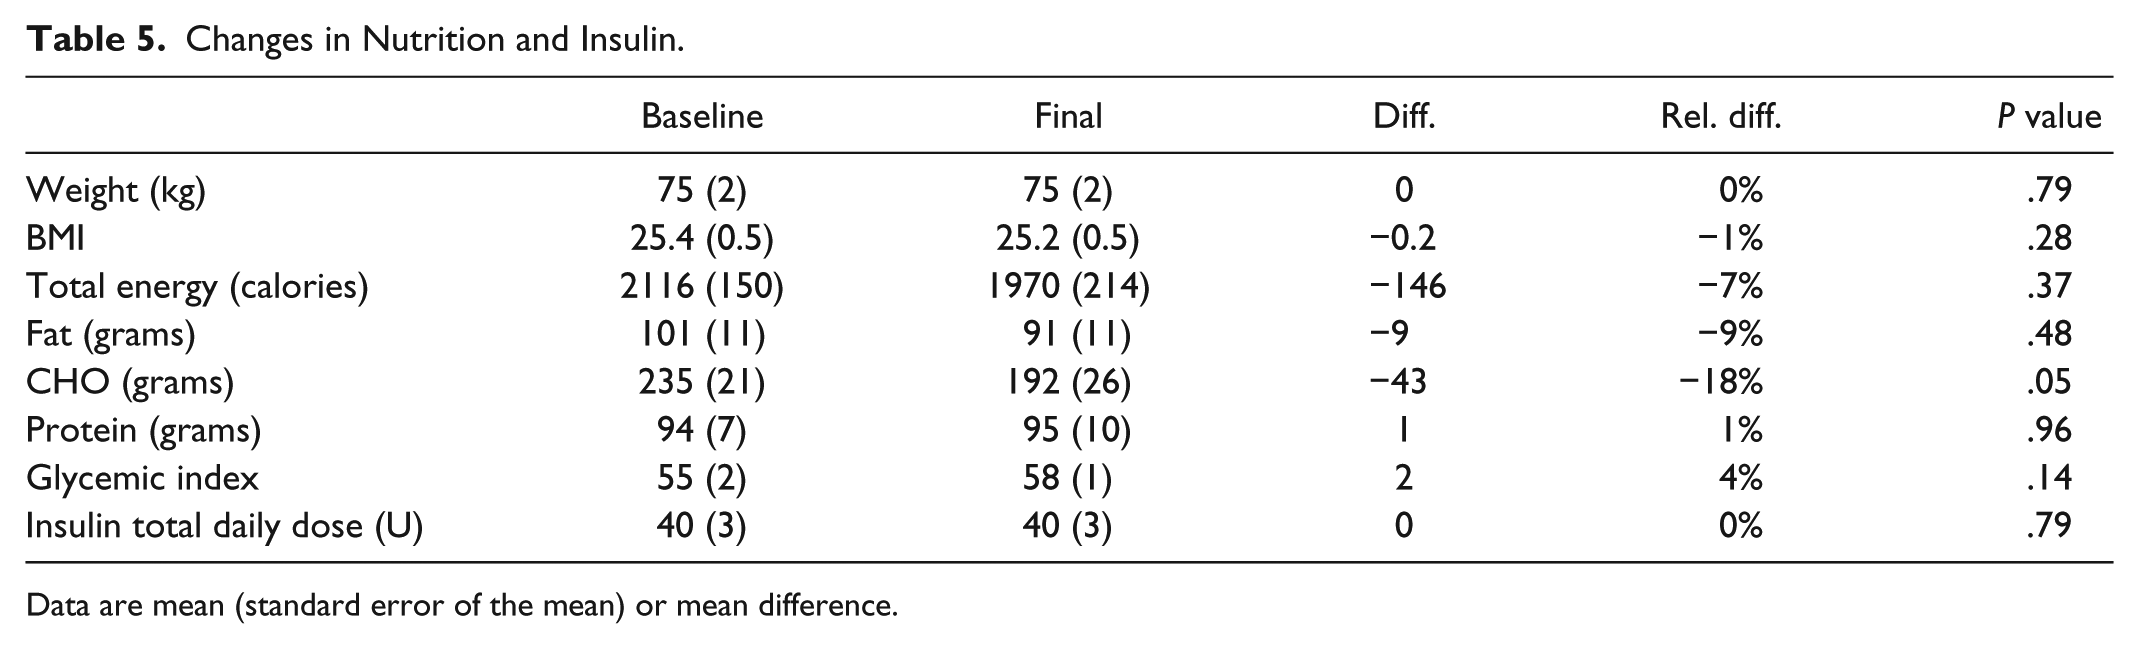
Data are mean (standard error of the mean) or mean difference.
SGOS Findings
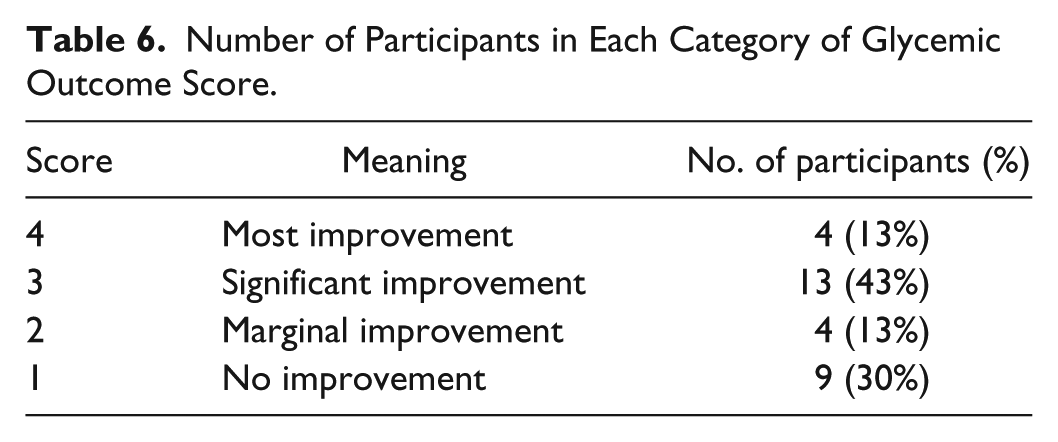
The number of participants in each SGOS category is shown in Table 6.
Number of Participants in Each Category of Glycemic Outcome Score.
The number of participants in each behavioral attribute level is shown in Table 7.
Number of Participants in Each Category of Behavioral Attribute.
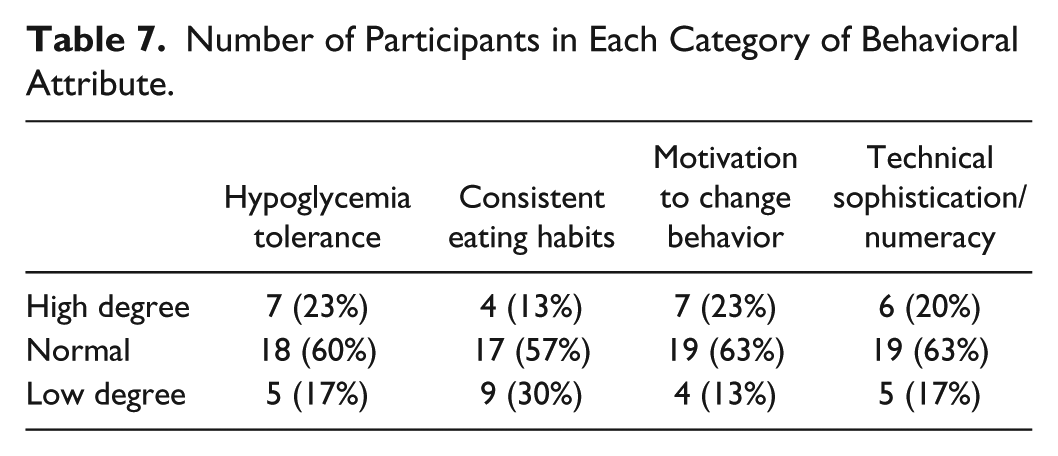
“Hypoglycemia tolerance” showed a statistically significant, negative correlation with SGOS (r = −.38, P = .04); those rated with a low level of “hypoglycemia tolerance” had higher SGOS. “Motivation to change behavior” was positively correlated with SGOS and approached significance (r = .35, P = .06). Furthermore, “motivation to change behavior” was positively correlated with A1c reduction (r = .36, P = .05). The other two attitude score correlations were not significant.
Clinical Observations
Several observations when using the system clinically are worthy of note. First, participating clinicians observed anecdotally how effective the system was in easily identifying and focusing on specific causes of glycemic excursion, and, jointly with the participant, devising a simple, focused self-care action plan for remediation. They reported that the more well-defined the target, the easier it was to develop a focused plan of action. Second, clinicians also noted the importance of how participant attitudes and personal styles influenced their glycemic management. Thus, the most effective action plans were those that were tailored to meet individual participant concerns and management styles. The clinical application of the system with respect to these two clinical observations is illustrated in the examples below. The first two demonstrate how the system was successful in helping identify specific problem foods and how the resulting action plans were used to achieve improvement in SGOS. The third example shows how a patient characteristic—fear of hypoglycemia—influenced participant behavior to achieve a significant improvement in SGOS.
Two Examples Illustrating Dietary Changes and the Specificity of the Intervention
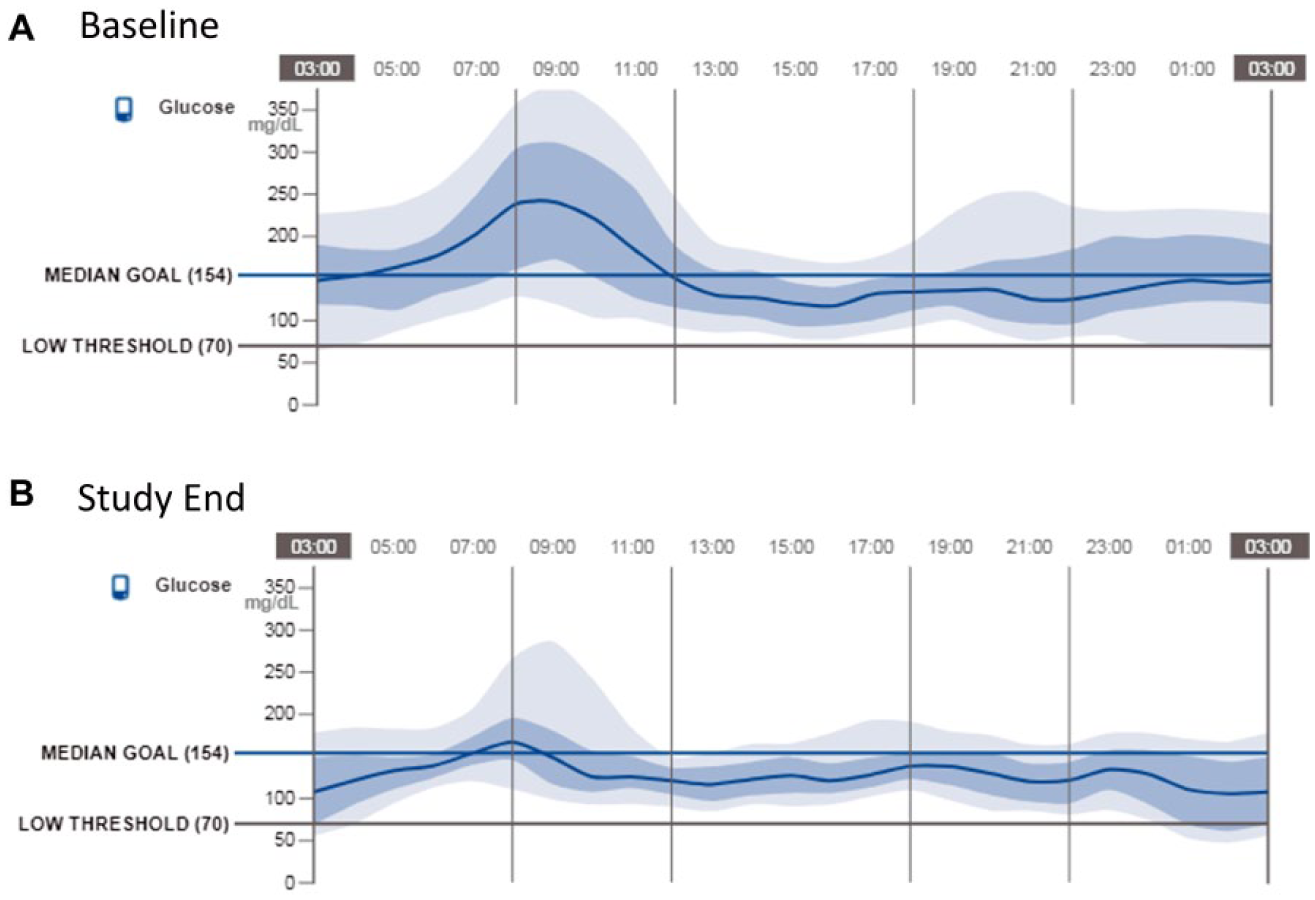
The ambulatory glucose profiles (AGPs) 6 at baseline and at study end are shown in Figure 1A for a participant who was successful in using the system to make dietary changes that improved their glycemic management. The baseline AGP shows the participant starting the study with high glucose variability and use of the system’s episode prompts resulted in a report (Figure 2) indicating that many rapid rises in glucose coincided with the consumption of chocolate chip muffins. These excursions led to a cascade of glucose fluctuations that became increasingly difficult to control over the course of the day. Using the system, the nutritional education program, and clinician coaching, the participant experimented with substituting lower carb snacks for these high carb muffins. The results were dramatic. As can be seen in Figure 1B, glycemic variability was subsequently reduced: the standard deviation of glucose was reduced from 84 to 66 mg/dL, eA1c was reduced from 9.8% to 8.4% and time below 70 mg/dL was reduced from 55 to 23 minutes average per day. This participant also achieved an A1c reduction of 0.9, from 8.6% to 7.7%, accompanied by a substantial decrease in carbohydrate intake and only a slight reduction in daily insulin, indicating that improvements in glycemic control were most likely due to altered eating behavior.
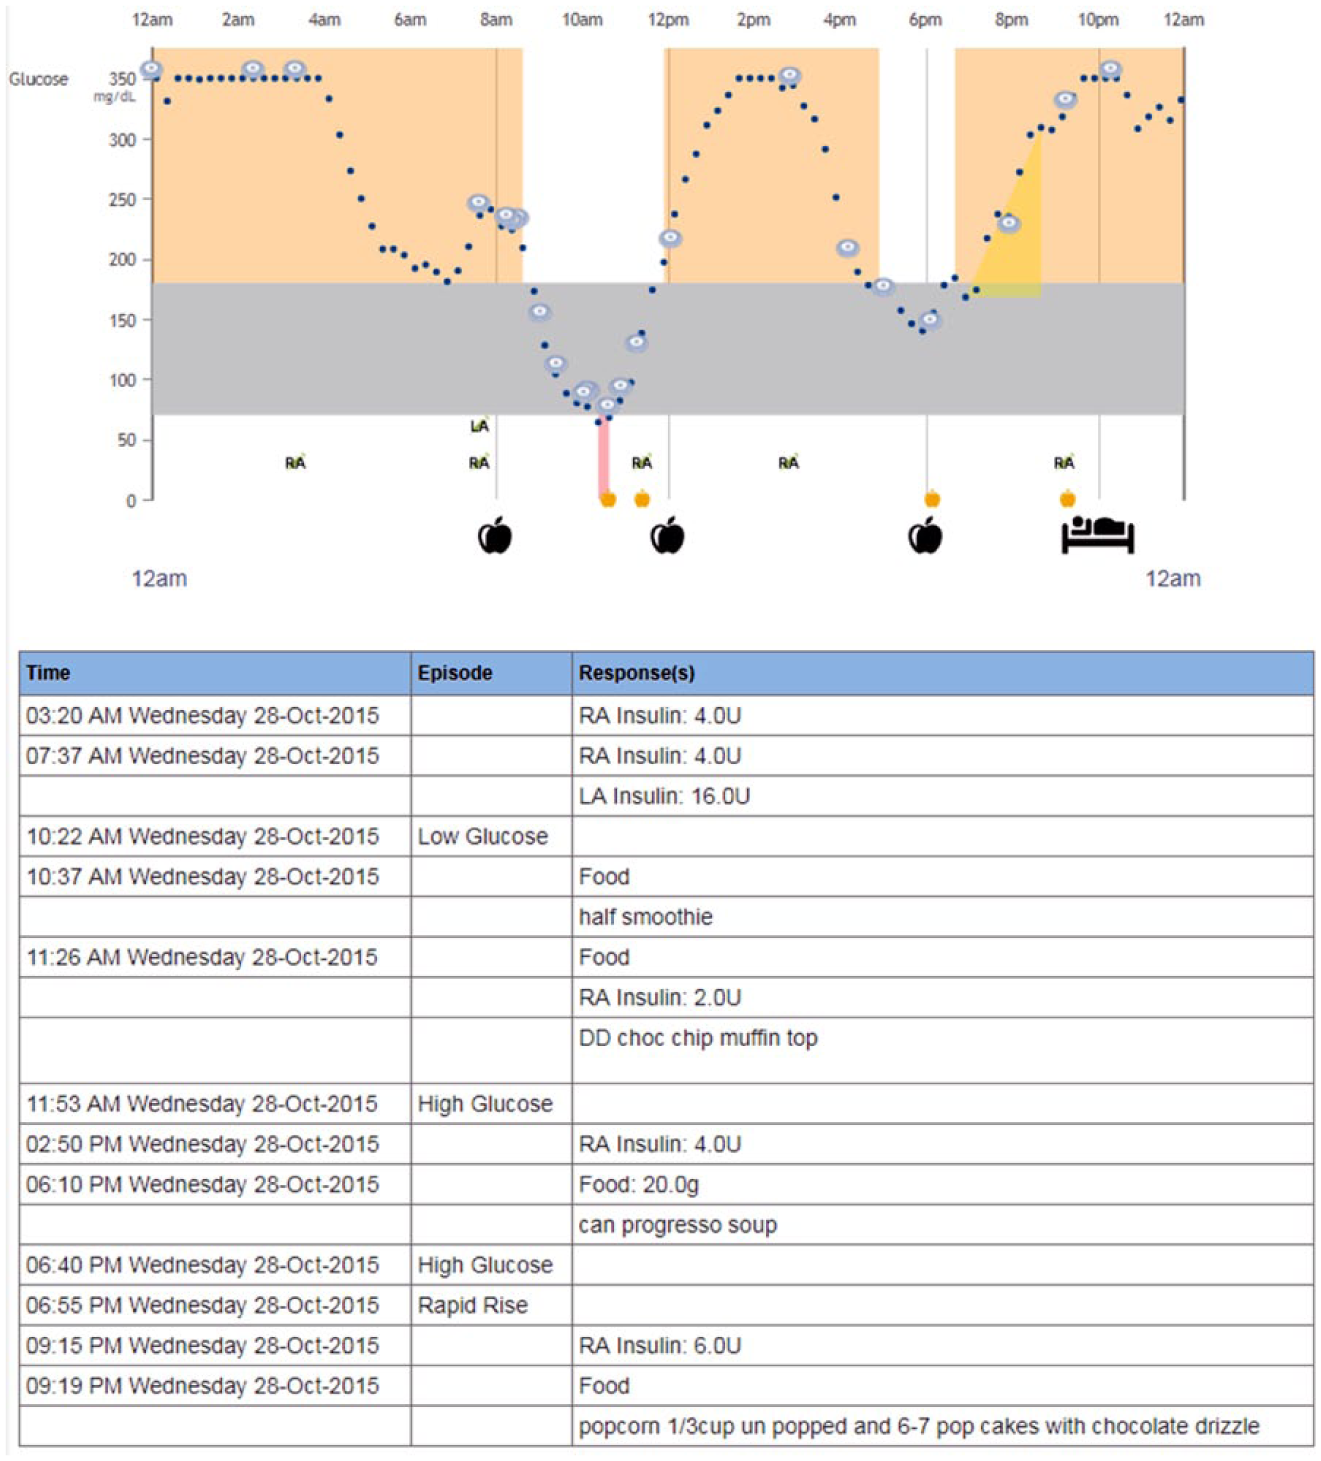
Sample of episode responses and notes entered early in the study by the participant.
A second participant presented with consistent eating habits, meaning his or her eating behavior did not vary much in timing or food choice. The baseline AGPs for this participant, shown in Figure 3A, indicated a notable spike in blood glucose around 9:00
AGP comparison for participant with dietary issues and who had strongly consistent eating habits.
The prompts offered by the system enabled this participant to identify a specific high carbohydrate cereal that was causing the post-breakfast peak. Consequently, the participant replaced the cereal with a lower carbohydrate/high protein alternative (Figure 4). As can be seen (Figure 3B), the glucose spike around 9:00
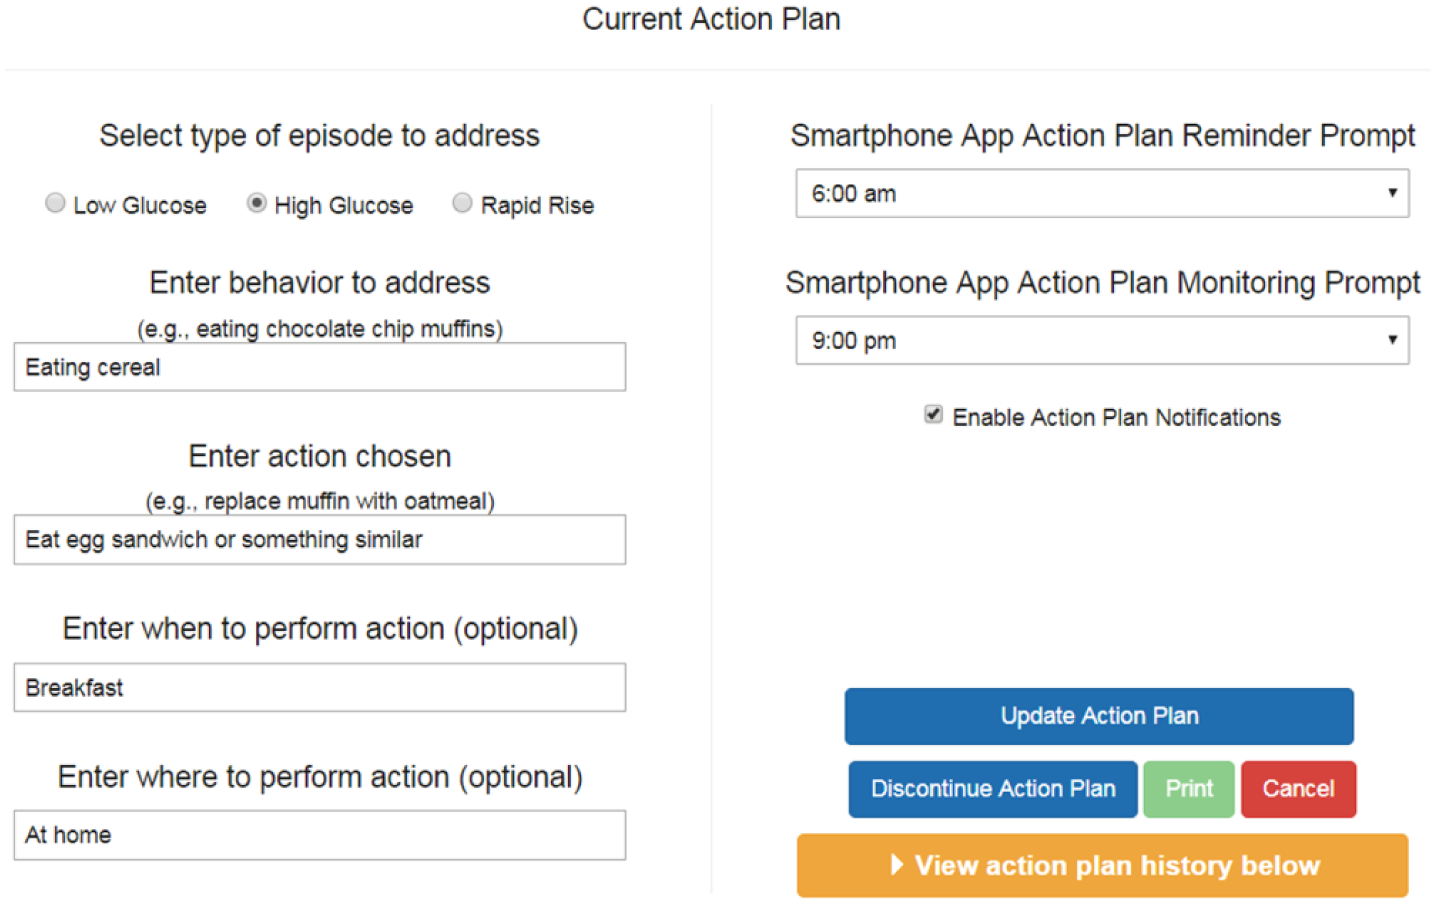
Action plan user entry display from Sugar Sleuth reporting software.
Example of Participant With Fear of Hypoglycemia
This participant, who had a high fear of hypoglycemia, presented with three problems: a glucose spike after dinner, lows overnight, and moderate variability throughout the day, as shown in Figure 5A. Not surprisingly, overnight lows were of greatest concern to this participant. The system prompted this participant to record food intake over the course of several days, and it became apparent that several bowls of cereal during the day and frequent consumption of pizza for dinner made blood glucose control challenging. The participant became aware of how food choices had a direct, verifiable effect on glucose highs and lows. Working with the clinician, this participant, motivated by fear of hypoglycemia, dramatically changed some food choices. In effect, the participant’s fear of hypoglycemia became a powerful motivator for behavior change.
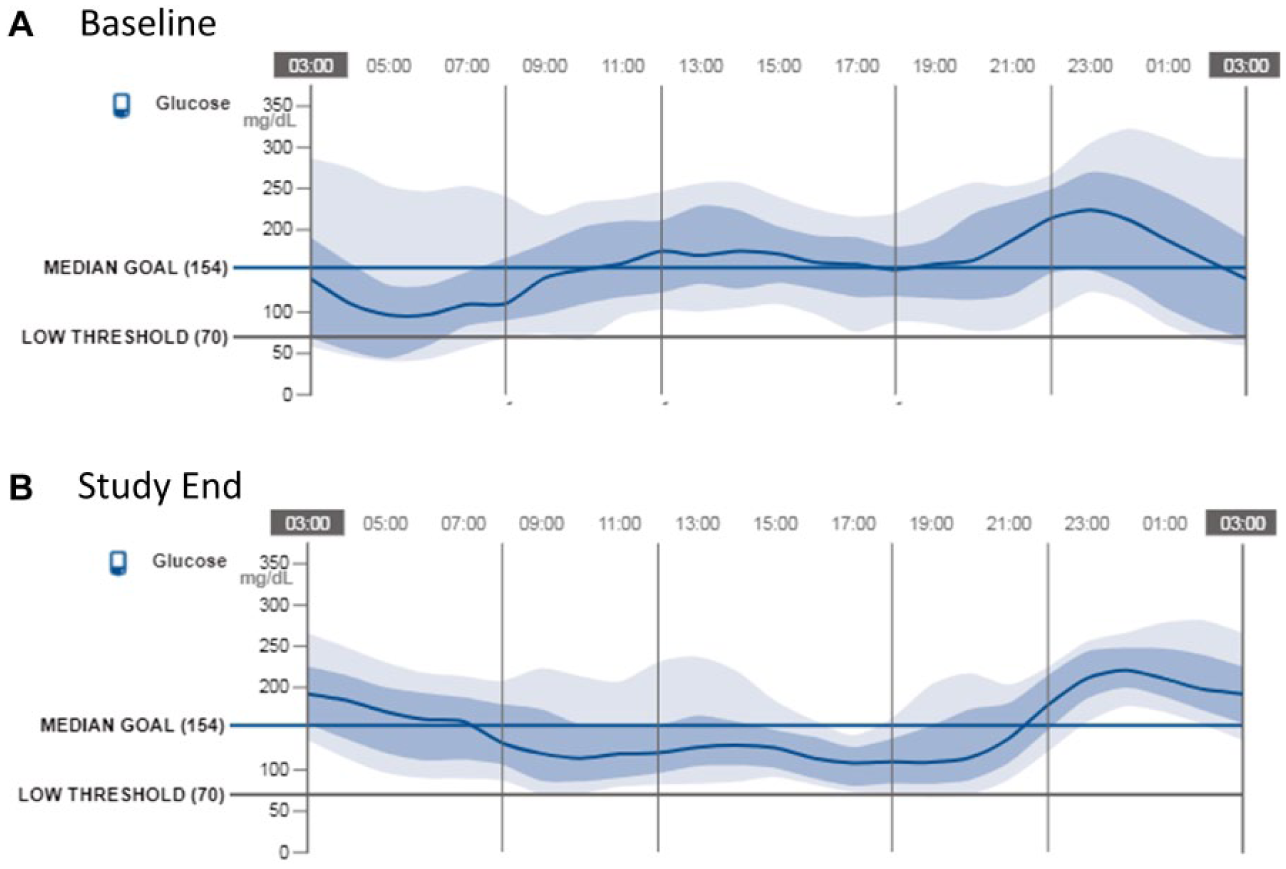
AGP comparison for participant with strong “fear of hypoglycemia” attribute.
The results of this behavior change were dramatic. The baseline and study end AGPs (Figures 5A and 5B) show that the action plan led to a clear resolution of all three initial problems: glycemic variability was reduced throughout the day, with a reduction of the standard deviation of glucose from 75 to 60 mg/dL, eA1c was reduced from 7.3% to 7.0%, and time below 70 mg/dL was reduced from 169 to 71 minutes average per day. This participant also showed an A1c decrease of 1.1%, from 8.3% to 7.2%. Of greatest importance to this participant was a substantial decrease in overnight hypoglycemia, with only a slight reduction in insulin. In this case, the system enabled this participant to adaptively channel a fear of hypoglycemia into increased motivation for behavior change by prompting experimentation with alternative foods. Not surprisingly, the participant continued to maintain modestly high post-dinner glucose levels to avoid overnight lows.
Discussion
This pilot study was designed to learn more about patient and clinician reactions to using a comprehensive mobile app linked to FreeStyle Libre that helped to identify the specific causes of glycemic problems and to direct attention to possible solutions in clinical care. Collaborative team work among PWDs, clinicians, and engineers made possible the development and improvement of the Sugar Sleuth system throughout the study.
The use of the system resulted in a significant average reduction in A1c over time, which was accompanied by a statistically significant reduction in average carbohydrate intake. However, no change in average insulin use was found, suggesting the importance of how food choices directly affect glycemic control. While it is established that use of glucose sensors improves glycemic control,13-16 this is the first time to our knowledge that glycemic improvement has been evaluated with respect to dietary changes. Average glycemic measures improved slightly or were essentially unchanged. Although none of these changes was statistically significant, the hypoglycemia metric reductions approached significance in this small cohort.
The study was designed to learn how the system would be used in PWD. However, this leads to the limitation of being a single-arm, single-center study; the results generated are not generalizable. The study period was short and sustainability of change in self-management skills over-time cannot be shown.
However, these preliminary findings suggest that the system, in conjunction with continuous glucose monitoring, provides an effective platform for assisting clinicians and PWDs in identifying and responding to glucose variability while improving self-management skills. Improvement in self-behavioral management is a key component to achieve goals of glucose control. 17
To our knowledge, none of the mobile app available thus far has helped to identify and possibly address causes of glucose variability.
Conclusion
The Sugar Sleuth system provides contextual feedback on fluctuations in continuous glucose and facilitates change in self-care skills to improve glucose control. The system is usable in clinical settings and highlights areas of glucose management improvement, helps with behavioral changes, and identifies barriers to achieving glucose control. Every PWD brings a unique set of treatment challenges, some more difficult to resolve than others, and the Sugar Sleuth system provides a new, highly flexible tool that can create a personalized, targeted action plan. This can help to promote modification of disease management behavior. The findings from this initial pilot study provide the basis for the design of future trials with separate treatment arms to independently examine the efficacy of the Sugar Sleuth system and nutrition intervention. In particular, usability of Sugar Sleuth app should be evaluated in subjects already using CGM to assess if the system can further and consistently improve glucose control and reduce glucose variability while improving self-management skills.
Footnotes
Acknowledgements
Stephanie Edwards and Owen Henn of Joslin Diabetes Center provided critical clinical activities. Hanqing Liu of Abbott Diabetes Care provided statistical analyses.
Abbreviations
AGP, ambulatory glucose profile; CGM, continuous glucose monitoring; CHO, carbohydrate; eA1c, estimated A1c; IQR, interquartile range; PWD, person with diabetes; SGOS, single glycemic outcome score; TB70, time below 70 mg/dl; T1D, type 1 diabetes.
Declaration of Conflicting Interests
The author(s) declared the following potential conflicts of interest with respect to the research, authorship, and/or publication of this article: ML, TD, and GH are full-time employees of Abbott Diabetes Care. ET has received speakers’ bureau honoraria from Abbott.
Funding
The author(s) disclosed receipt of the following financial support for the research, authorship, and/or publication of this article: ET is a physician at the Joslin Diabetes Center; the Joslin Diabetes Center has received research funding from Abbott Diabetes Care.