
Abstract
Objective:
The objective was to develop an analysis methodology for generating diabetes therapy decision guidance using continuous glucose (CG) data.
Methods:
The novel Likelihood of Low Glucose (LLG) methodology, which exploits the relationship between glucose median, glucose variability, and hypoglycemia risk, is mathematically based and can be implemented in computer software. Using JDRF Continuous Glucose Monitoring Clinical Trial data, CG values for all participants were divided into 4-week periods starting at the first available sensor reading. The safety and sensitivity performance regarding hypoglycemia guidance “stoplights” were compared between the LLG method and one based on 10th percentile (P10) values.
Results:
Examining 13 932 hypoglycemia guidance outputs, the safety performance of the LLG method ranged from 0.5% to 5.4% incorrect “green” indicators, compared with 0.9% to 6.0% for P10 value of 110 mg/dL. Guidance with lower P10 values yielded higher rates of incorrect indicators, such as 11.7% to 38% at 80 mg/dL. When evaluated only for periods of higher glucose (median above 155 mg/dL), the safety performance of the LLG method was superior to the P10 method. Sensitivity performance of correct “red” indicators of the LLG method had an in sample rate of 88.3% and an out of sample rate of 59.6%, comparable with the P10 method up to about 80 mg/dL.
Conclusions:
To aid in therapeutic decision making, we developed an algorithm-supported report that graphically highlights low glucose risk and increased variability. When tested with clinical data, the proposed method demonstrated equivalent or superior safety and sensitivity performance.
Keywords
Achieving euglycemia can be hampered by episodes of hypoglycemia and glucose variability which can now be tracked by continuous glucose monitoring (CGM).1-6 CGM devices have been shown to be clinically accurate in recording hypoglycemia, and can be used to assess diurnal patterns of glycemia.7-11 However, a challenge inherent to analysis of this influx of data is to represent it in a clinically meaningful manner that enables efficient clinical action. There is a need for glucose reports that can provide standardized, efficient output to effectively guide therapeutic decision making.12-14 Key benefits of glucose reports include consistent view of glucose trends and patterns over the day, and showing the detail that A1C cannot. 14 The identification of patterns of hypoglycemia and variability can aid by guiding how aggressively the treatment can be safely adjusted.
Although glucose reports have provided a way to analyze the influx of data from CGM, decision making can still be a challenge. Computerized algorithms have been developed as a way to simplify and guide the decision making process.15-20 In hospital settings, computerized algorithms have been shown to improve patient outcomes by maintaining tight glucose control without increasing hypoglycemic events. 20 In a clinical setting, computerized algorithms have also aided clinicians in correctly identifying glycemic patterns, making therapeutic decisions to address patterns, and teaching staff and patients. 21
The proposed glucose report and supporting methodology is intended to make clinical review of glucose sensor data more efficient and consistent by highlighting areas of glucose control that need priority in therapeutic decision making. Furthermore, the methodology underscores the importance of glucose variability as a factor that can contribute to increased risk for hypoglycemia if insulin/medication doses are increased to reduce excess hyperglycemia.
Methods
We developed a mathematically based methodology, which exploits the relationship between glucose median, glucose variability and hypoglycemia risk, and can be implemented in computer software. This methodology was incorporated into the Glucose Pattern Insights Report, referred to here as the “Insights” report.
The Insights report is made up of 3 primary components: an ambulatory glucose profile (AGP) plot, a glucose control assessment (GCA), and indicators for high glucose variability. These components are divided into time-of-day periods that can be adjusted according to a person’s typical routine (Figure 1). A variety of the Insights reports for similar people with the same A1C is shown in Figure 2. The AGP graph displays the hourly 10th, 25th, 50th (median), 75th, and 90th percentiles of glucose readings, presented over the “typical” day based on all days within the selected time frame.
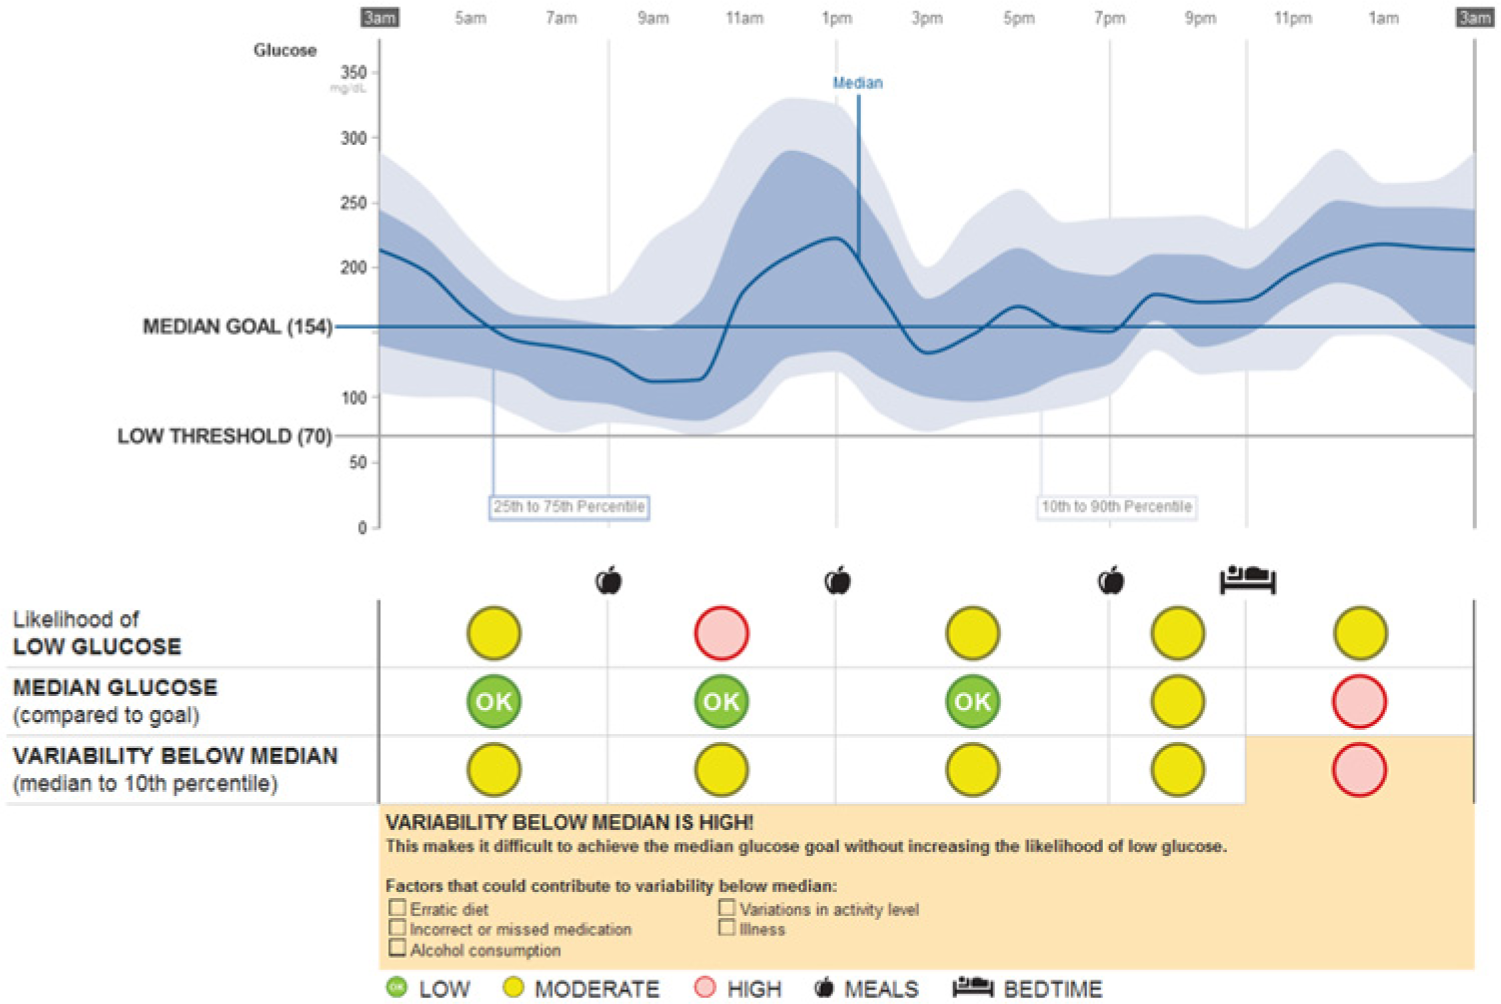
Insights report example, JDRF-CGM trial patient ID 322, November 29 to December 12, 2000. Note that study dates are deidentified in the public data set and do not correspond to the actual study dates.
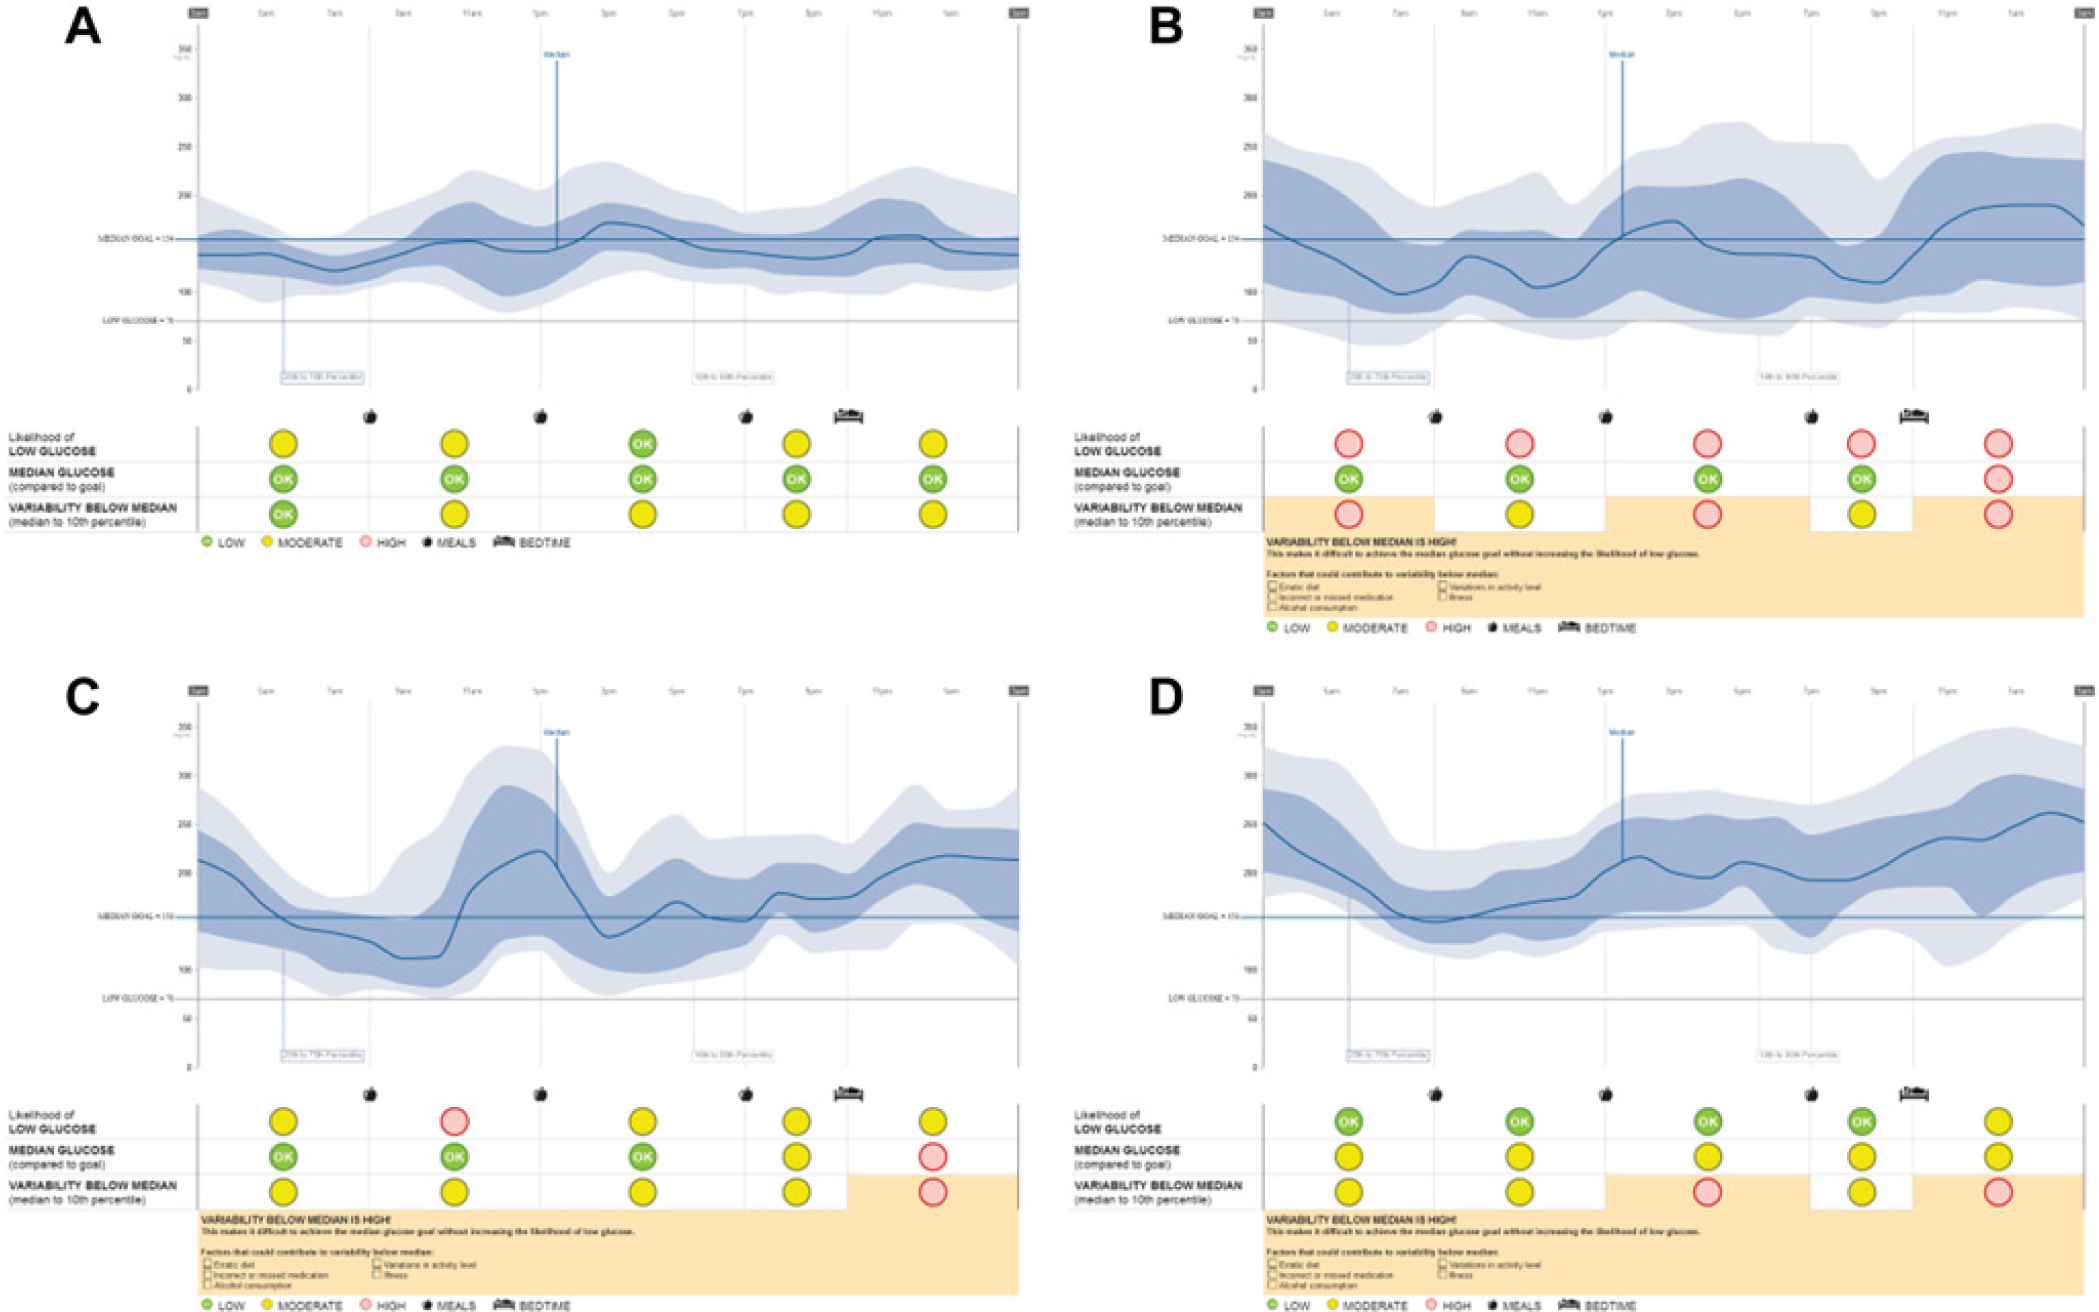
Insights reports for patient examples from the JDRF-CGM trial with laboratory A1C = 7.6% to 7.7% measured at time of sensor wear. All are adult females (26 to 49 years), have completed secondary education (1 bachelor’s, 3 master’s), have substantial duration of type 1 diabetes (21 to 35 years), and use an insulin pump. (A) Patient ID 207, July 23 to August 5, 2000. (B) Patient ID 283, July 19 to August 1, 2001. (C) Patient ID 322, November 29 to December 12, 2000. (D) Patient ID 486, January 11 to January 24, 2001. Note that study dates are deidentified in the public data set and do not correspond to the actual study dates.
The GCA indicators are low, moderate, or high based on the criteria shown in Figure 3. The first GCA measure, Likelihood of Low Glucose (LLG), is the probability that low glucose values have exceeded an allowable, user-defined threshold. The low glucose allowance parameter sets the threshold for which LLG is reported as low, moderate, or high. The setting options are small, medium, or large. Increasing this parameter allows more glucose readings below 70 mg/dL (3.9 mmol/L) before causing the LLG to shift from low to moderate or high. The allowance was based on both the frequency and value of low readings. The Insights report was designed to allow the clinician to adjust the allowance setting according to the clinical scenario. For example, the allowance may be decreased for someone who is elderly or has hypoglycemia unawareness. Alternatively, the allowance may be increased for a pregnant woman trying to maintain tight glucose control.
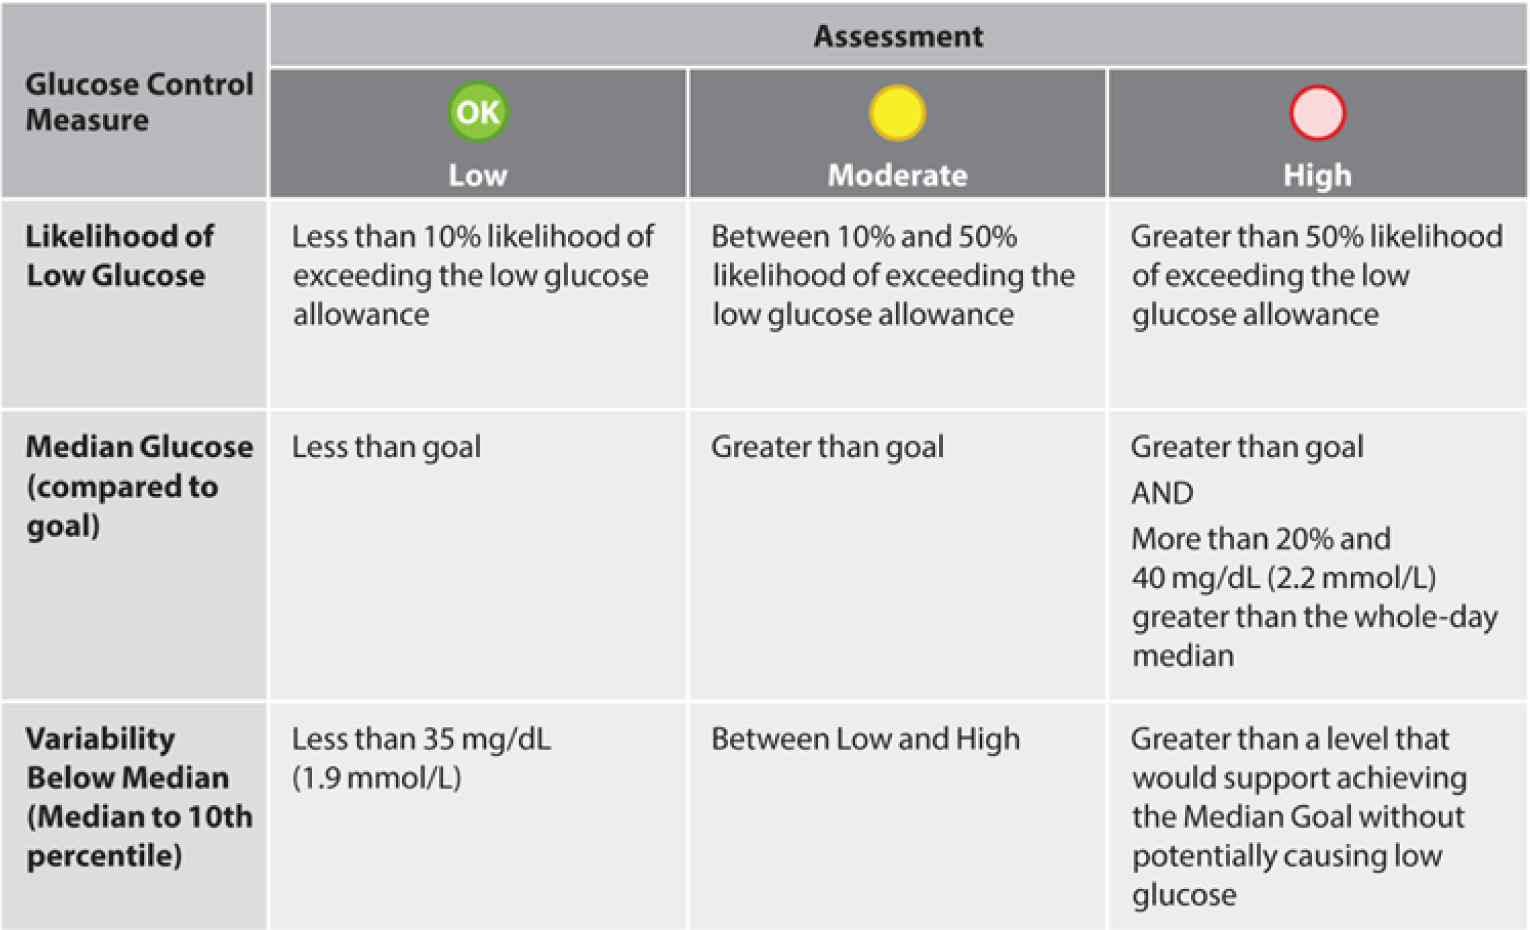
Criteria for determining low, moderate, and high indicators in the glucose control assessment (GCA).
The second measure, median glucose compared to goal, is an indication of when the median glucose has exceeded the individual’s median goal setting. The median goal parameter sets the glucose level for which median glucose is reported as low, moderate, or high. The median glucose provides a useful measure because of its strong correlation with A1C. 22 The overall glycemic management goal is to reduce median glucose levels below the goal while minimizing the LLG, as this should result in A1C and hypoglycemia exposure goals being met.
The third measure, variability below median, is a measure of the spread of glucose data below the median. It is calculated as the difference between the 50th and 10th percentile glucose readings for the time period. It is important to note that when variability below the median is high, it is difficult to achieve the median goal without increasing LLG. Therefore, factors causing the elevated glucose variability must be addressed before insulin doses are increased, otherwise there would be an increased risk for low glucose. The report also outlines behavioral factors that could contribute to variability below the median, including erratic diet, incorrect or missed medication, alcohol consumption, variations in activity level, or illness, and that need to be reviewed and addressed by the health care professional in his/her counseling of the patient.
In addition, the times of daily events define the periods during the day used to analyze the GCA. The user can set the typical times for breakfast, lunch, dinner, and bedtime. These times correspond to daily events that are clinically relevant to diabetes patients whose insulin therapy is related to eating and sleeping events. The result is 3 daytime periods and 2 overnight periods, with default time boundaries of 3
The supporting role that the GCA provides is shown for 4 patients, using data publicly available from the JDRF Continuous Glucose Monitoring Clinical Trial (JDRF-CGM trial) data set (Figure 4). 23 The first patient (Figure 4A) had minimal LLG across the day, as the median and 10th percentile line were substantially elevated relative to goal and the hypoglycemia boundary, respectively. In this case, the GCA conformed to the visual interpretation of the AGP, indicating that glucose levels could be lowered safely with little risk of inducing hypoglycemia. The second AGP (Figure 4B) shows substantial hypoglycemia across the day, as the 10th percentile was nearly always below 70 mg/dL, hence the GCA also supported rapid AGP interpretation that hypoglycemia was a clinical priority to be urgently addressed. The third AGP (Figure 4C) illustrates excellent control by achieving low exposure to both hyper- and hypoglycemia. Given the small margin of error into the hypoglycemia range, however, there needs to be continual vigilance and awareness of the presence of hypoglycemia. The fourth AGP (Figure 4D) illustrates how the LLG indicated “red,” despite having similar hourly 10th percentile values to Figure 4C. This patient would need additional caution due to the presence of the elevated variability below the median and the potential to induce further hypoglycemia, especially if the elevated median values were to be addressed by more insulin coverage. In Figure 4C the 10th percentile values of 80 to 90 mg/dL were acceptable, whereas, in Figure 4D they indicated an added risk because of the higher median values and the increased risk for hypoglycemia associated with therapeutic intervention(s) to reduce the median closer to goal. The GCA indicators encapsulate this clinical logic by linking the dimensions of hypoglycemia, median glucose levels, and glucose variability below the median.
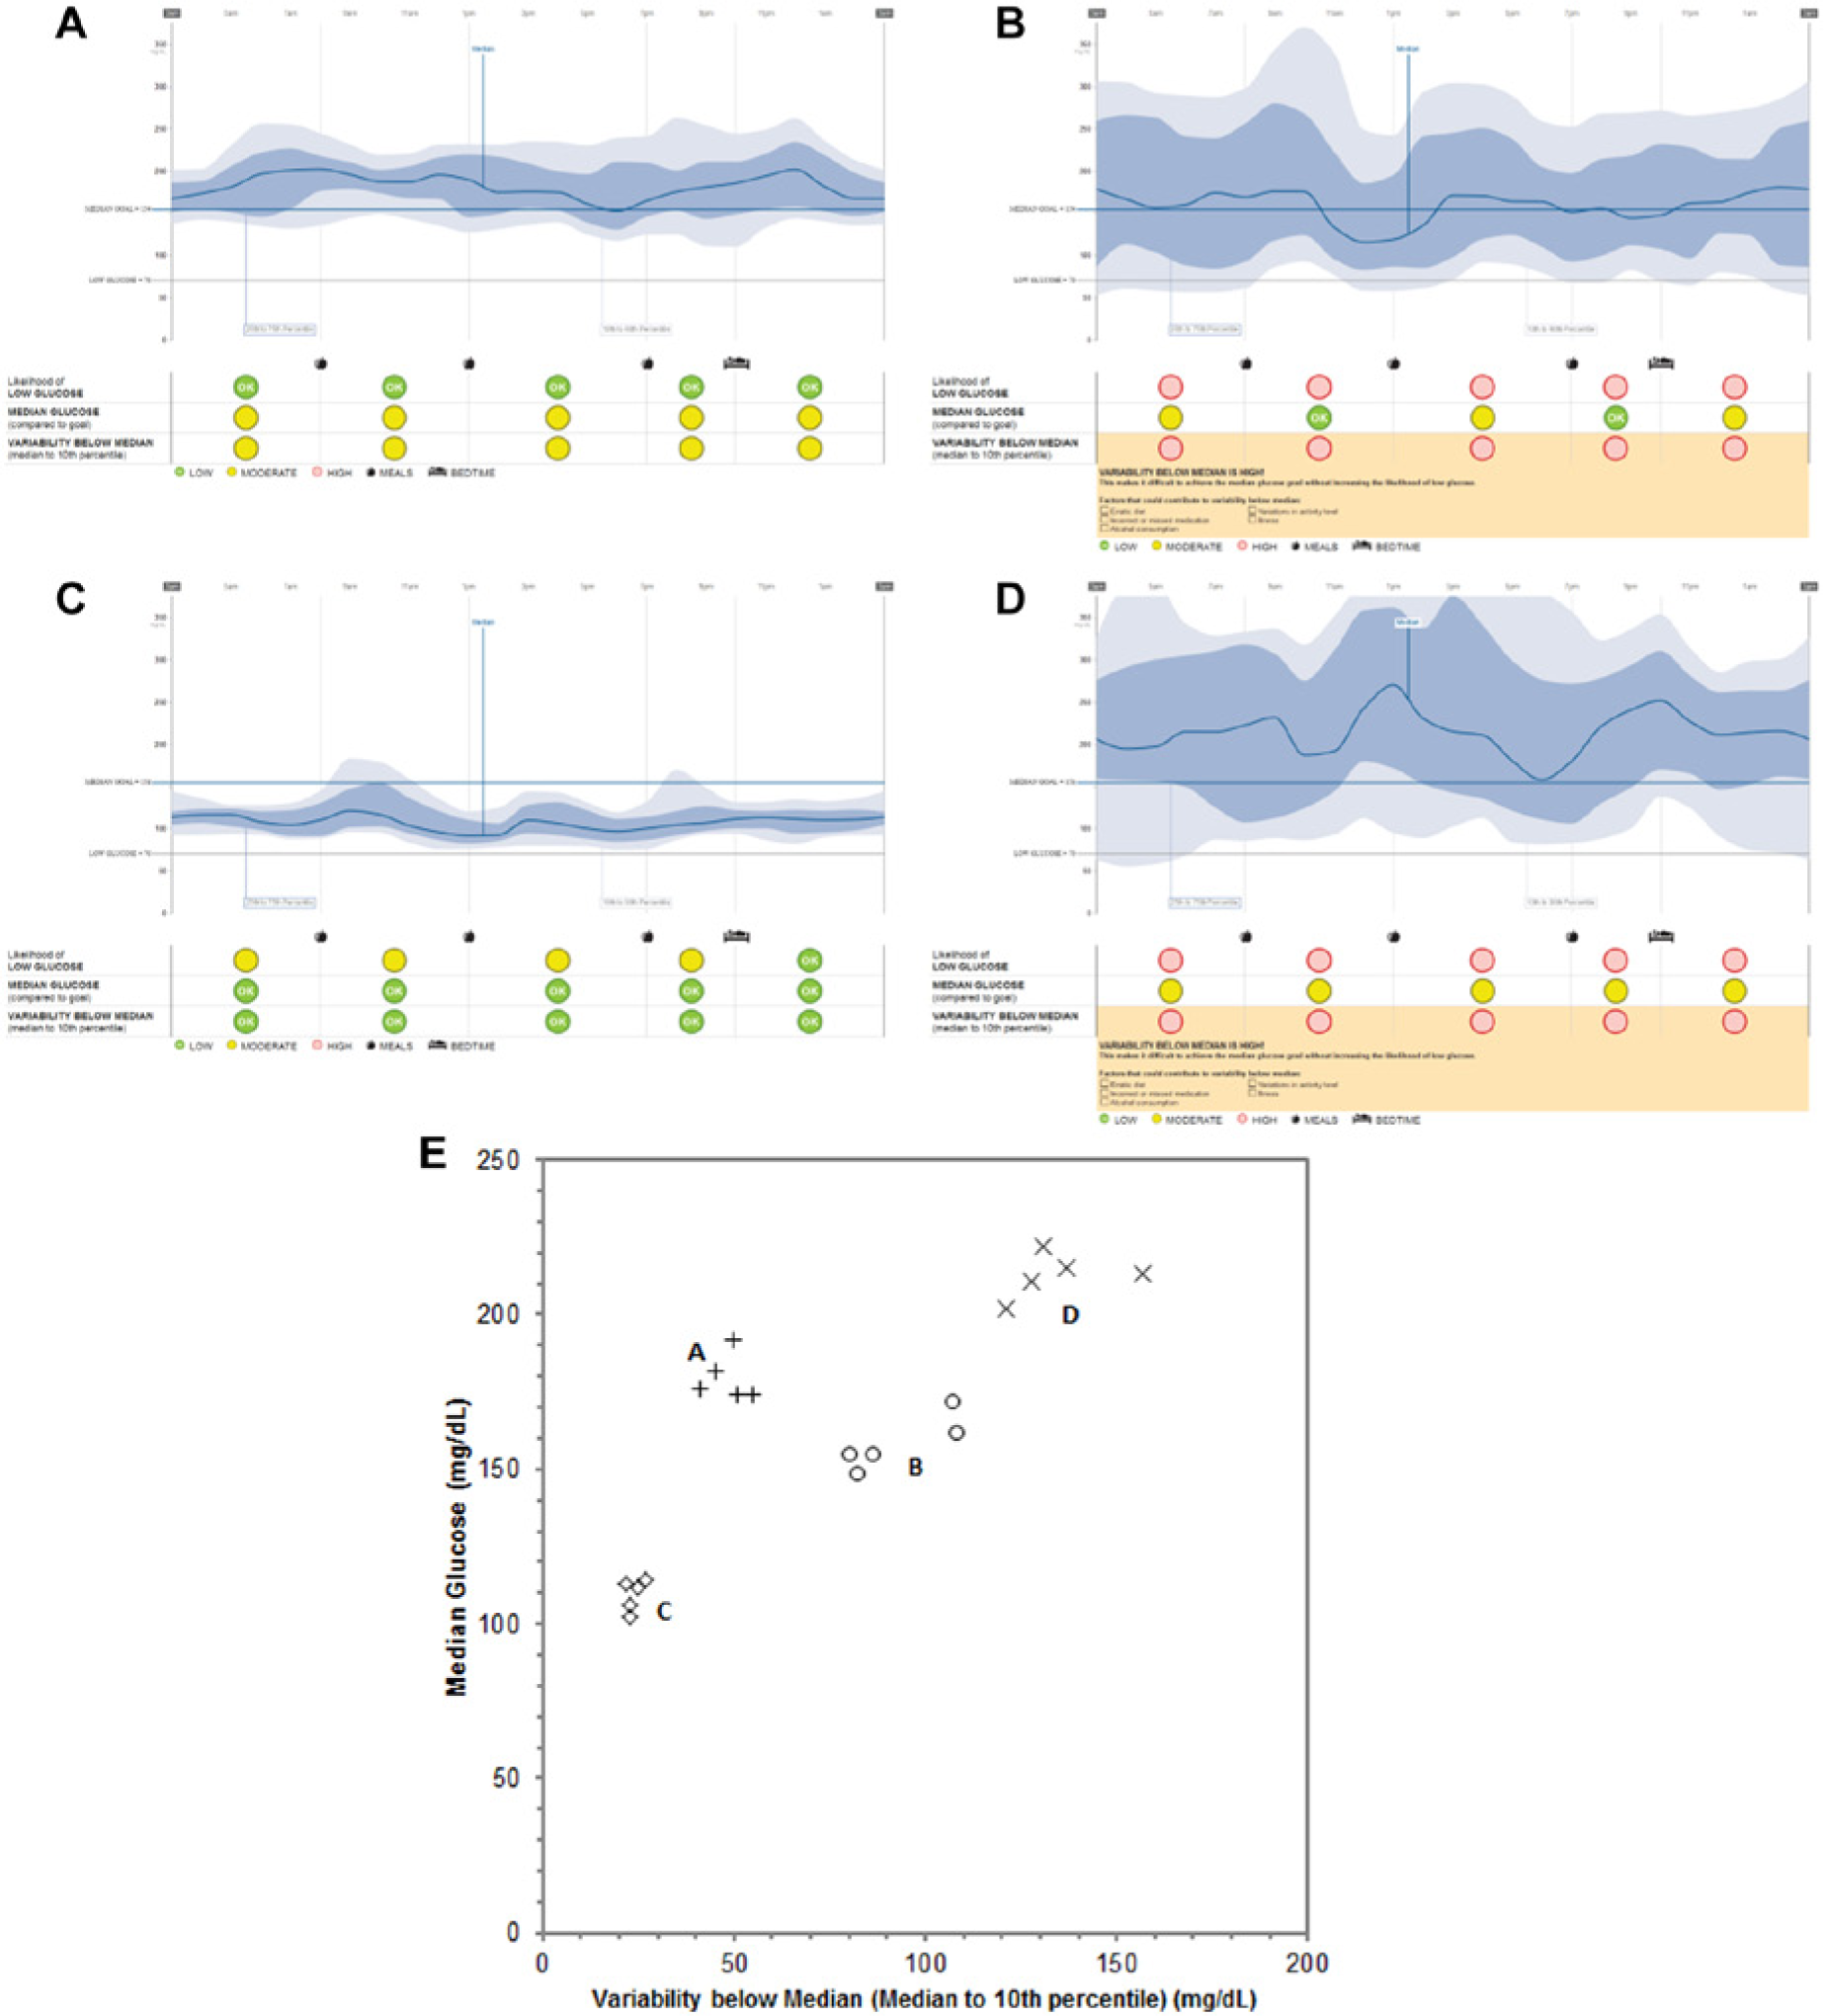
Examples of the Insights report of patient data from the JDRF-CGM trial. (A) Patient ID 17, July 15 to July 28, 2001. (B) Patient ID 295, May 26 to June 8, 2000. (C) Patient ID 257, February 27 to March 7, 2000. (D) Patient ID 250, November 20 to December 3, 2000. (E) Representation of the summary statistics for central tendency and variability of the glucose distributions for each time period for each patient. Note that study dates are deidentified in the public data set and do not correspond to the actual study dates.
The grouping of the 5 median-variability value pairs for these patient examples are shown in Figure 4E. It can be intuited that patient A would have the least LLG, as the median is high and the variability is low. In this region of the plot, none of the 10th percentile values would be lower than 100 mg/dL. Conversely, as median values decrease (patient C), variability increases (patient D), or both occur (patient B), there would be an increased LLG for these patients relative to patient A. This linkage between median, variability and low glucose is utilized by the method to create the LLG indicator. The relationships in Figure 4E will be discussed in terms of the control grid, a construct that underlies the GCA.
To define our decision support method, we propose that there are 2 important aspects that need to be considered for proper glycemic management: (1) reducing overall glucose levels and (2) reducing glucose variability to minimize inducing hypoglycemia as glucose levels are lowered. The key to this framework is to consider that for a period of time each patient has a population of glucose readings that can be described as a stationary statistical distribution. The gamma distribution is an appropriate and convenient model; like glucose values, this distribution does not allow zero or negative values and has a larger tail toward high glucose values.
For each period of the day, the distribution of glucose values can be characterized by a pair of metrics representing central tendency and variability. The median (50th percentile, or P50) was chosen as the metric for central tendency, and the difference between the median and 10th percentile (P10) as the metric for variability, also defined as the lower interdecile range, P10 to P50, 24 and named “variability below median” on the Insights report.
Percentile metrics were favored over other common statistics such as mean and standard deviation because of commonality with AGP’s use of percentiles, as the GCA is intended to compliment the AGP on the Insights report. In addition, percentiles are more robust to outliers that often occur in glucose data. The P10 to P50 metric was chosen for representing variability instead of other symmetric measures, such as the interquartile (P25 to P75) or interdecile (P10 to P90) ranges because it was a better predictor of hypoglycemia risk (analysis not shown).
Using this framework, the mathematical relationship among glucose median, glucose variability, and LLG can be described. This relationship led to rules that translated glucose data into GCA indicators to provide standardized guidance for treatment decisions.
For the purposes of this method, a hypoglycemia metric was selected that is dependent on both time and magnitude of glucose readings below 70 mg/dL, referred to as AU70 (area under 70 mg/dL). Taking all readings below 70 mg/dL, the AU70 metric is defined as the sum of all differences (70 mg/dL – reading) divided by their total number. The value of the AU70 metric used in generating the Insights report is referred to as the low glucose allowance (LGA) setting. As described previously, the report has 3 possible settings defined for LGA; each of these configures the algorithm for 3 different degrees of risk for low glucose.
As mentioned, the key concept underlying the decision support methodology is the relationship between median, variability and hypoglycemia risk. This is illustrated on the median-variability plots shown in Figures 5A to 5C, where the glucose median is on the y-axis and the glucose variability (P10 to P50) on the x-axis. A point was plotted for each patient for a period of the day (in this example 3
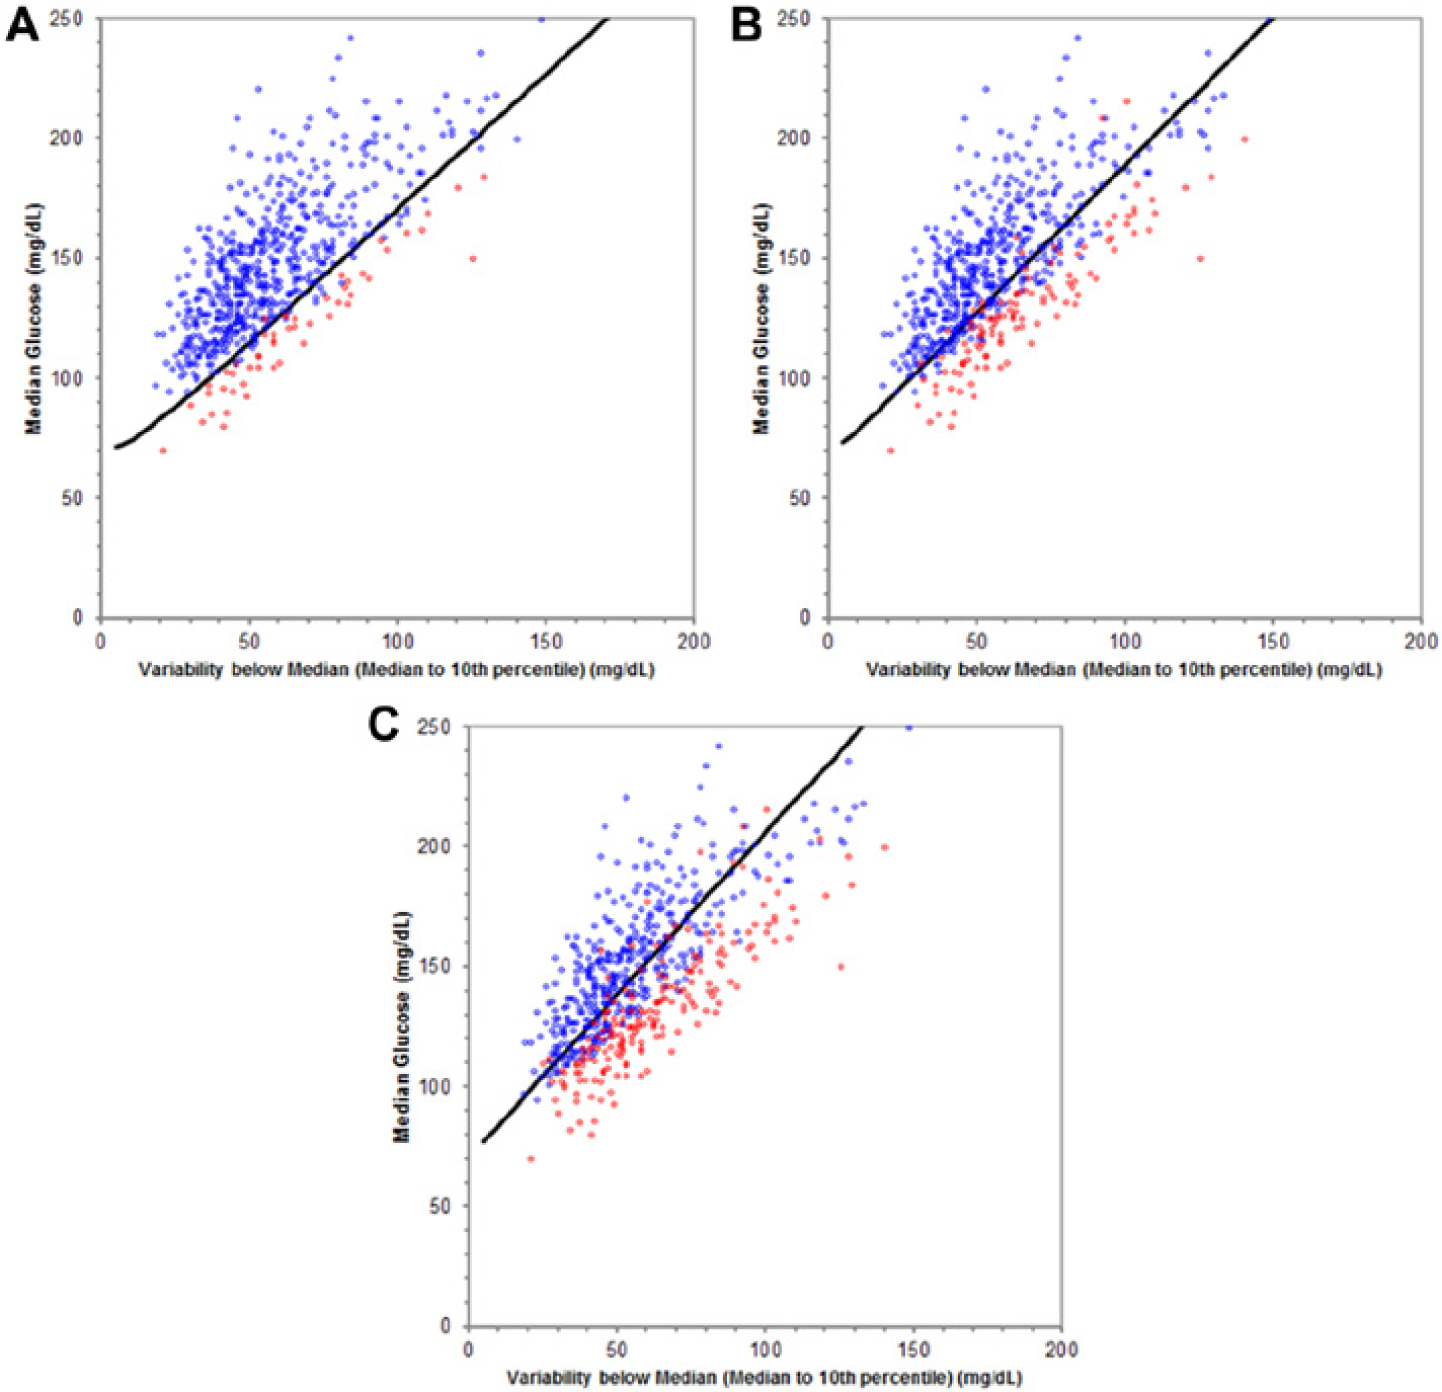
Likelihood of Low Glucose (LLG) performance for Navigator CGM from 3A to 8A at low glucose allowance (LGA) settings of large (A), medium (B), and small (C). Red points have AU70 above the LGA. The LLG indicator would be red if the point were below the high risk curve (dark line).
The gamma distribution model of the glucose data can be used, along with the AU70 definition of hypoglycemia, to theoretically derive a boundary between these 2 populations. This boundary, referred to here as the “high risk curve,” is made up of points on the median-variability plot that correspond to the same AU70 value, and can be found using the equation for the gamma distribution varied over all possible median and variability values to find those pairs where the area of the distribution below 70 mg/dL is equal to the AU70 setting. The resulting boundary is a contour of constant area under 70 mg/dL, for different median and variability values. Three high risk curves, one for each LGA setting, have been determined for use with the Insights report. Figures 5A to 5C show how well these curves separated the 2 point populations. The LGA settings were determined from a large population of median-variability points, and selected such that approximately 10%, 30%, and 50% of the LLG indicators would be below the high risk curve for the large, medium, and small settings, respectively.
The high risk curve can be used to divide the median-variability plot into 2 zones: a low hypoglycemia risk zone above the curve, and a high hypoglycemia risk zone below the curve. This concept of zones can be extended to convert the median-variability plot into a so-called control grid. Using a patient’s set of CG data, a control grid and point on it can be calculated for each of the 5 time-of-day periods (Figure 6).
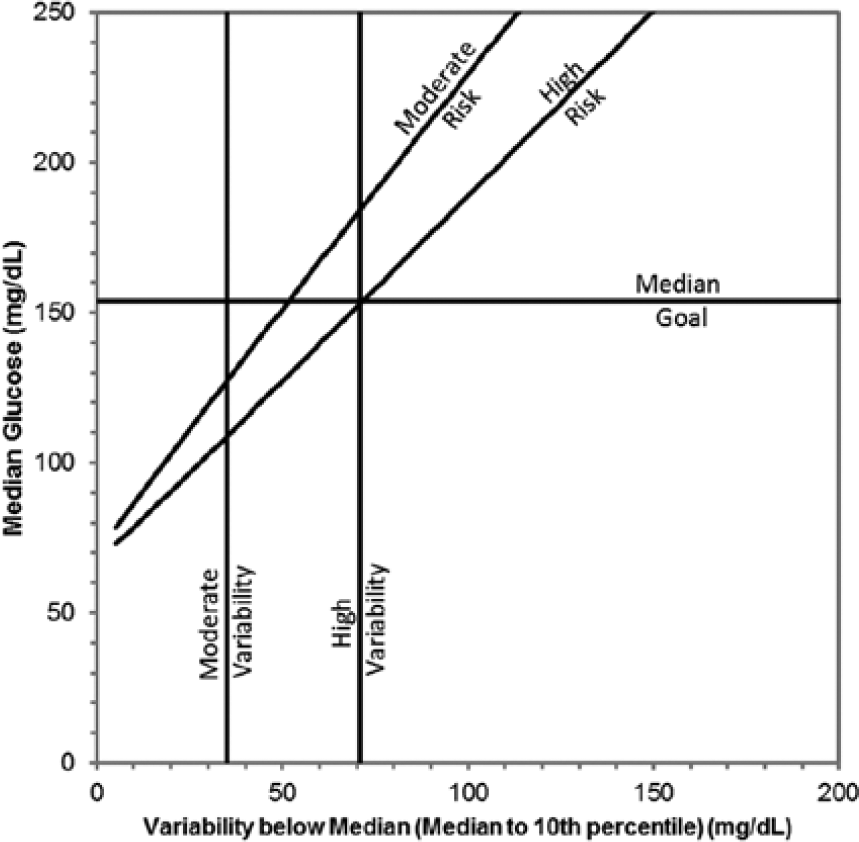
The control grid, with high risk curve for the medium low glucose allowance setting, moderate risk curve for daytime with 14 days of CGM, median goal = 154 mg/dL (approximate A1C = 7.0% equivalent).
The high risk curve divides the “high” (red) and “moderate” (yellow) LLG zones, and a moderate risk curve divides the “moderate” and “low” (green) LLG zones. The moderate risk curve accounts for uncertainty in the LLG indicator as a result of uncertainty in the values. The uncertainty of the median and variability (P10 to P50) are affected by the number of data samples available and the time-varying nature of these values. The moderate risk curve was determined empirically for each time-of-day period and LGA setting, such that patients with points in the low risk zone during one 2-week period have less than 10% chance, with 95% certainty, of landing in the high risk zone during the subsequent 2-week period. The moderate risk curve is implemented as a 60-element look-up table along the dimensions of LGA (3 levels), daytime or nighttime (2 levels), and amount of glucose measurements (10 levels). For example, the moderate risk curves for 14 days of CGM for a 5-hour period of the day have AU70 values of 0.03, 0.17, and 0.53 for daytime periods for the small, medium and large LGA settings respectively, and 0.02, 0.09, and 0.39 for nighttime periods.
The criteria for the median glucose indicator described in Figure 3 can be represented visually as a horizontal line at the median goal setting. This boundary divides “green” from “yellow” indicators, with “yellow” indicators becoming “red” if the median value for that time period is both 20% and 40 mg/dL above the 24-hr median glucose value.
The boundary for the variability below median indicator described in Figure 3 can also be represented as vertical lines in Figure 6. The high variability line is located at the intersection of the median goal and the high risk curve. This defines high variability to be such that the median glucose cannot be reduced below the median goal without indicating high LLG. The moderate variability line is fixed at 35 mg/dL (1.9 mmol/L); this value was determined by review of CGM studies in people without diabetes.7,25
The control grid identifies different zones according to glycemic conditions of clinical relevance that indicate the direction of therapy modification. The significance for therapy decision support is that the zones provided on the control grid can be the basis for mapping glucose data for a period of the patient’s day into therapy suggestions. Specifically, a point on the control grid directly maps to a column on the GCA. Figure 7 illustrates how the GCA indicators can be applied to achieve glucose control. For example, in the first row depicting 3 green signals, there is very low risk of having hypoglycemic episodes, thus no changes are needed as the patient has met the glucose goals of managing both hypo- and hyperglycemic exposure. A possible action that could be taken is to consider lowering the glucose goal if the patient is not at the A1C target. The third row of Figure 7 illustrates scenarios with either moderate (yellow) or high (red) risk for LLG and elevated variability. For these patients it would be important to address self-care behaviors to reduce glucose variability and the risk for hypoglycemia. If necessary, insulin doses may need to be adjusted to reduce hypoglycemic risk.
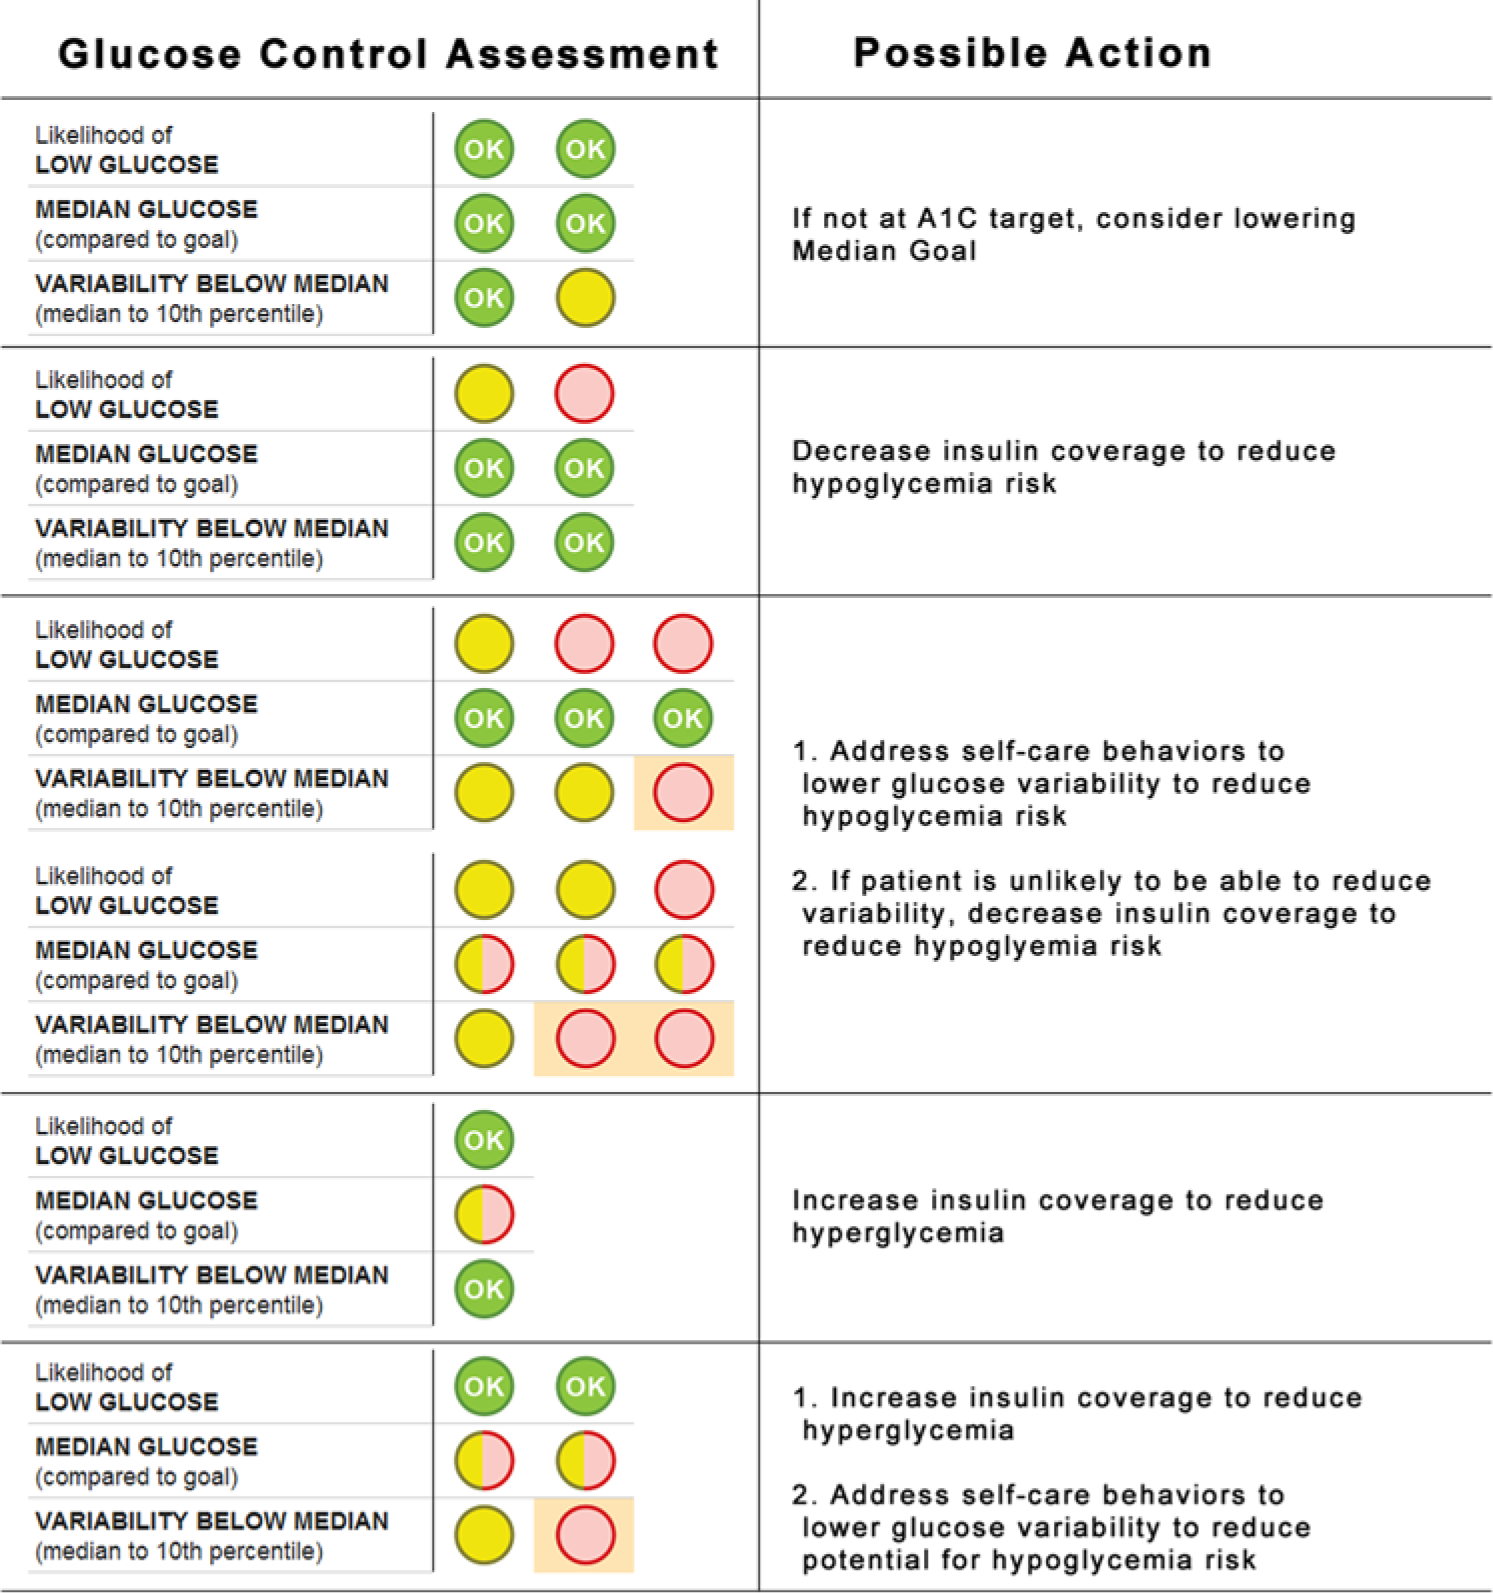
Application of the programmatic algorithm to achieve glucose control.
The preceding concepts were applied retrospectively to JDRF-CGM26,27 clinical trial data to establish hypoglycemia assessment and forecasting performance. Briefly, the JDRF-CGM trial evaluated the effect of the DexCom Seven (DexCom, San Diego, CA), the MiniMed Paradigm Real-Time Insulin Pump and Continuous Glucose Monitoring System (Medtronic, Northridge, CA), and the FreeStyle Navigator (Abbott Diabetes Care, Alameda, CA) on glucose control in patients with type 1 diabetes ages 8 to 72 years, with duration of diabetes from 1 to 63 years. CGM values for all participants were divided into 4-week segments starting at the first available sensor reading. Each 4-week period was split into two 2-week periods (1 and 2), and each period was split into 5 time-of-day intervals (3
For purposes of analysis, any value of AU70 above 0.83 was deemed excessive, and any value below 0.83 was acceptable. The comparison of either method with the AU70 of period 1 was called “in sample,” while the comparison with the AU70 of period 2 was called “out of sample.” The P10 forecast was “green” if the 10th percentile was above an upper limit, “red” if below a lower limit. A variety of lower and upper limit values were evaluated. The combinations of in and out of sample comparisons were tabulated to compare the performance of the LLG and P10 methods.
Results
There were 13 932 evaluable comparisons between low glucose risk forecasts in period 1 and actual measured low glucose exposure in period 2.
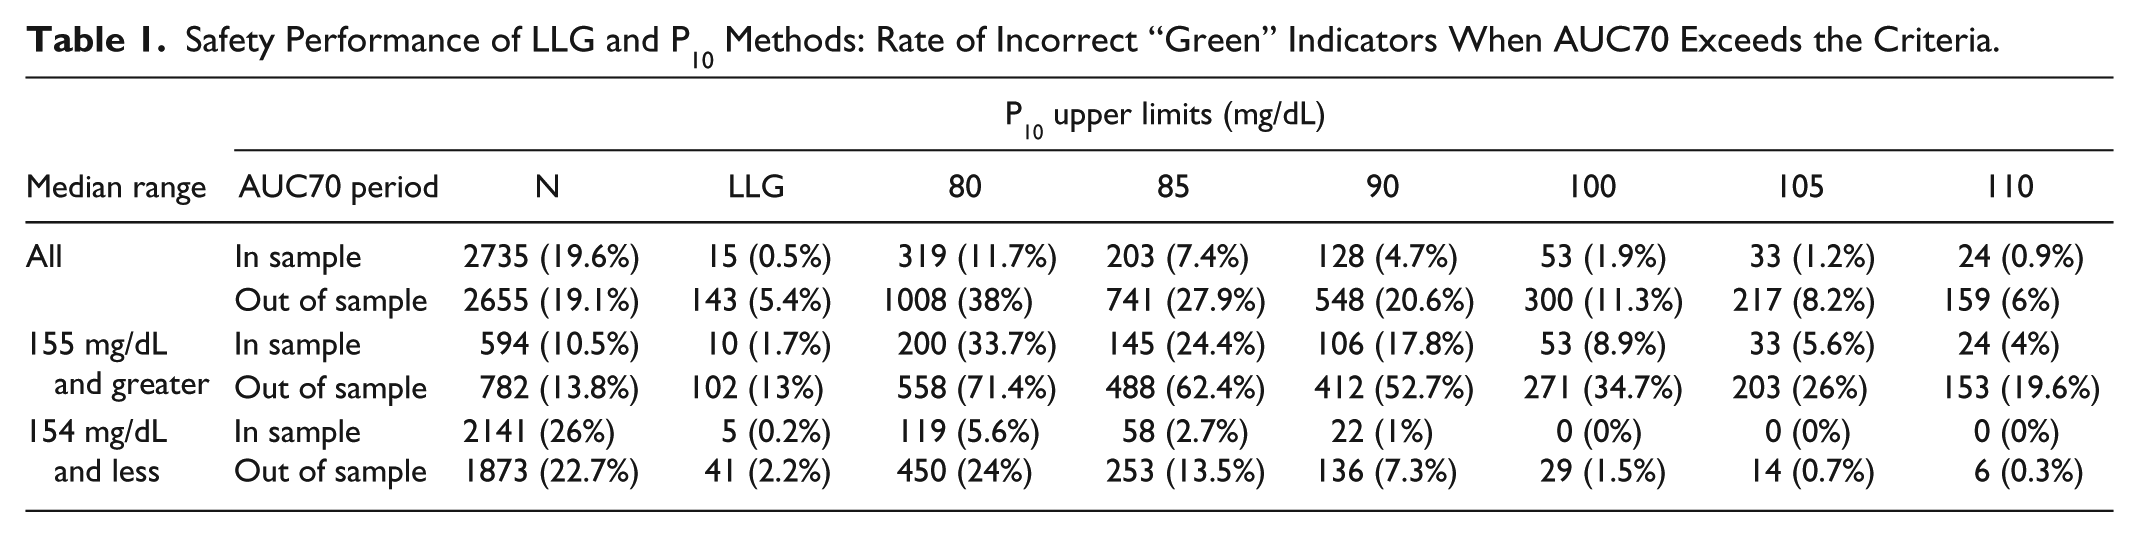
The most important safety performance criterion is minimizing the rate of missed detections of excessive hypoglycemic risk. This corresponds to “green” indicators when there is excessive AU70 (Table 1), as this is a false indicator that it would be safe to increase insulin to lower glucose when it would likely induce additional hypoglycemia. The LLG method had an in sample rate of 0.5% and out of sample rate of 5.4% for incorrect “green” indicators across all evaluated periods. These were better than the P10 method for upper limits up to 110 mg/dL. When evaluated only for the periods with median values 155 mg/dL and higher, the performance of the LLG is even better when compared against the P10 method. This performance when the median glucose is elevated above target is an important performance measure, as it is the situation that would predominately indicate an increase in insulin coverage for that period, thus carries substantial risk of inducing additional hypoglycemia.
Safety Performance of LLG and P10 Methods: Rate of Incorrect “Green” Indicators When AUC70 Exceeds the Criteria.
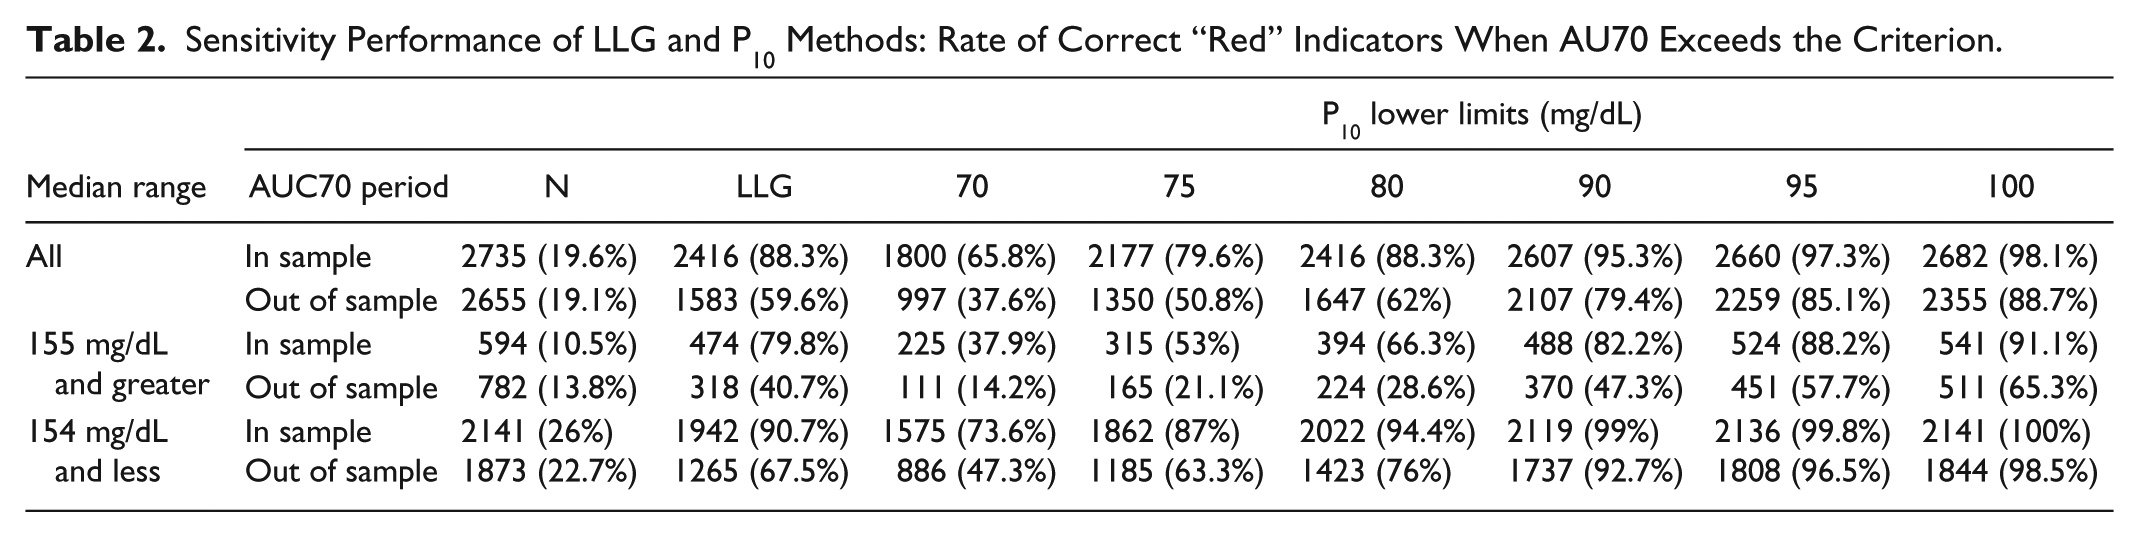
In terms of correct detection of excessive AU70, the LLG method has an in sample rate of 88.3% and an out of sample rate of 59.6% (Table 2). These were as high or higher than the P10 method up to about 80 mg/dL. When evaluated for median ranges above and below 154 mg/dL, the P10 lower limit that matched the performance of the LLG method was different. For the median range above target, the LLG was superior or equivalent up to 90 mg/dL, while for the lower median range, the LLG was superior or equivalent up to 75 mg/dL. This illustrates a challenge of using the P10 method, as limits must be varied according to the median range to match the LLG performance. The LLG method did not have this challenge as it was founded on the interrelationship of the 3 important dimensions of median glucose, variability, and hypoglycemia.
Sensitivity Performance of LLG and P10 Methods: Rate of Correct “Red” Indicators When AU70 Exceeds the Criterion.
The trade-offs associated with the dimensions of superior performance of the LLG method included having higher rates of false alarms (incorrect “red” indicators) and lower rates of true negatives (correct “green” indicators). The incorrect “red” indicators for the LLG method was 16.4% in sample and 23.7% out of sample, which was approximately equivalent to the P10 method with a lower limit of 80 mg/dL for all median levels. However, the LLG method was superior for lower median values (<154), where an incorrect red may lead to a reduction in insulin coverage. The LLG method had incorrect “red” indicators of 20.9% in sample and 30.7% out of sample, which was better than 30.5% in sample and 38.8% out of sample for the P10 method with a lower limit of 80 mg/dL.
Taking all of these dimensions of performance together, the LLG method stood apart from the P10-based methods in that no single pair of limits could match the performance of the LLG, in particular when correctly assessing risks of hypoglycemia when the median glucose level was above target.
Discussion
Diabetes clinicians traditionally have had to make treatment decisions based on infrequent glucose readings that may not adequately reflect a patient’s glycemic profile. Continuous glucose monitoring provides an abundance of information about daily glucose patterns. However, the time required to review this vast amount of data can strain clinician efficiency. The Insights report was designed to support diabetes clinicians in quickly understanding the patient’s overall glycemic condition and facilitating safe and effective therapy modifications. From the standpoint of insulin-based treatments, this method provides standardized guidance for medication adjustment (increase, decrease or maintain), and highlights the necessity to address self-care behaviors to reduce glucose variability that is elevated to the point that it limits managing both hyper- and hypoglycemia.
The key to this framework was to consider that for a period of time each patient had a population of glucose readings that could be described as a statistical distribution. A fundamental insight of this model was the defining of the boundaries between low, moderate, and high LLG based on the gamma distribution. A benefit of this reporting model is that the decision support algorithm was designed to allow the clinician to adjust the LGA setting depending on the aggressiveness of treatment, allowing for more or less conservative report indicators.
Computerized treatment algorithms using CGM data have been developed in an effort to use the abundant information in a clinically meaningful manner.15,28-32 In a 2-month study of 22 insulin-dependent subjects using daily capture of self-monitoring of blood glucose and a predictive glucose model, Albisser et reported a reduction in rates of hypoglycemia by 9-fold and insulin therapy by −9 U/day. Computerized glucose programs have also been used for educational purposes to allow patients to gain insight into the effect of insulin dosage adjustments, diet changes, and exercise on glucose levels. 32 The Librae algorithm, a computerized diabetes simulator in diary format developed as an educational tool for patients, 16 correlated well with the CGM data, however there were also some clinically unacceptable errors at extremes of blood glucose levels. The programmatic model described herein differs from other models in the robustness of the glycemic forecast comparisons that were used reduce missed detections of excessive hypoglycemia. Two key advances of the LLG method are its sensitivity in detecting incorrect green and correct red forecasts for improved predictive capabilities when compared with the methods relying solely on the lines of the AGP. The predictive aspect of the proposed algorithm provides clinicians with targeted areas to focus on, such as high risk for hypoglycemia and variability, which in turns aids in determining how aggressive corresponding treatment should be. The proposed model also displays potential reasons for glycemic variability that can be addressed with the patient, and used for patient education about lifestyle behaviors.
There were some challenges associated with designing the programmatic model presented in this article. For instance, each of the 3 high risk curves was associated with a single constant value of the hypoglycemia metric, selected to be AU70. Because there is no established guidance on how much hypoglycemia area is “excessive” or “problematic,” the AU70 settings had to be empirically derived. In a patient exam using the Insights report, the clinician would be able to further probe the hypoglycemic experience and assess the need for intervention. Understanding the alignment between these AU70 settings and clinical diabetes management needs further investigation, particularly for different patient profiles of diabetes type, age, duration of diabetes, and presence of comorbidities. There are likely instances where more or less hypoglycemia are acceptable based on the needs of the patient. For example, an elderly patient who lives alone may need to be more vigilant about the possibility of a severe hypoglycemic episode compared with a younger individual who can recognize hypoglycemic symptoms, is trained to treat hypoglycemia and is using CGM with low glucose alarms. This established the clinical need to have multiple settings (large, medium, and small) of LGA based on the characteristics of the patient, but further work is needed to understand how to clinically apply and validate the available settings.
The vulnerability to low glucose can be higher overnight while sleeping because of impaired hypoglycemia symptoms.33-35 This motivated the decision to have empirically derived the moderate risk curve for each time period. This derivation met expectations of resulting in more conservative settings overnight compared to daytime. Fear of hypoglycemia has been reported by pediatric and adult populations,36,37 as well as by caregivers,38,39 and is associated with increased frequency of severe hypoglycemia. Moreover, fear of hypoglycemia may contribute to poor glycemic control, weight gain, and emotional distress. 37 The use of the programmatic report described here, which highlights time periods of increased risk for hypoglycemia, may be a valuable tool for overcoming fear of hypoglycemia. Further research in the clinical population is needed to investigate this potential benefit.
The Insights report provides a model for assessment of high risk times of the day that require therapeutic intervention, and provides more detail than A1C alone. As shown in Figure 2, patients may present with the same A1C value, yet have very different daily glucose patterns. The Insights report offers pattern recognition capability that highlights areas of variability. A key feature of this report is the suggestions for topics to discuss with the patient, which could aid in trouble-shooting potential reasons for increased glucose variability that may be associated with elevated hypoglycemia risk.
A study by Allen et al found that 27 non-insulin-using patients who received behavioral intervention consisting of review of CGM data and “role model” data about exercise benefits showed greater improvements in A1C, moderate activity, systolic blood pressure, and body mass index when compared with the control group who received generic education and advice. 40 These results, although in a small population of noninsulin patients, show the benefits of glucose reports in patient education and treatment.
The analyses presented here have several limitations. For the LLG versus P10 safety and performance analysis, the time-periods of the day used in the analysis were at fixed times of the day, not individualized to actual daily activities of patients, and may therefore bias the results. The analysis does not account for the interplay between time periods when managing glucose levels. Furthermore, this was a retrospective analysis and was not incorporated into a glucose-control intervention. The performance may vary under the conditions of using the hypoglycemia forecasts to support clinical treatment decisions. Finally, there was no accounting for the repeated assessments on the same study participants over the longitudinal course of the study.
There is a need for well-designed, prospective CGM trials to investigate the role of CGM reporting in clinical decision making. Future studies are needed to understand how this programmatic model responds in clinical trial and real-world settings. CGM devices gather vast quantities of data that can aid in treatment, but this must be supported by reporting models that deliver data in a manner that is clinically meaningful and efficient.
Conclusions
The LLG algorithm used continuous glucose monitoring data to analyze and characterize level of risk for low glucose. It was able to integrate the data into an intuitive display showing key areas of potential therapeutic importance, such as variability and high risk for low glucose levels. Prospective trials are needed to further understand the practical value of this report and how it can provide clinical benefit.
Footnotes
Acknowledgements
Suzie Webster, RN, of ConsignMed, Inc contributed to the writing of this article.
Abbreviations
AGP, ambulatory glucose profile; AU70, area under 70 mg/dL; CG, continuous glucose; CGM, continuous glucose monitoring; GCA, glucose control assessment; LGA, low glucose allowance; LLG, Likelihood of Low Glucose; P10, 10th percentile; P50, median or 50th percentile.
Declaration of Conflicting Interests
The author(s) declared the following potential conflicts of interest with respect to the research, authorship, and/or publication of this article: TCD, GAH, and KJD are full-time employees of Abbott Diabetes Care.
Funding
The author(s) disclosed receipt of the following financial support for the research, authorship, and/or publication of this article: HAW is a physician at the Joslin Diabetes Center, the Joslin Diabetes Center has received research funding from Abbott Diabetes Care.