
Abstract
In this work we describe the application of a careflow mining algorithm to detect the most frequent patterns of care in a type 2 diabetes patients cohort. The applied method enriches the detected patterns with clinical data to define temporal phenotypes across the studied population. Novel phenotypes are discovered from heterogeneous data of 424 Italian patients, and compared in terms of metabolic control and complications. Results show that careflow mining can help to summarize the complex evolution of the disease into meaningful patterns, which are also significant from a clinical point of view.
A major source of complexity in the management of type 2 diabetes (T2DM) patients arises from the large variability of events they undergo during disease progression. These events, such as hospital admissions, follow-up visits, laboratory tests, or therapy changes, can be stored in different data repositories with different formats and occurring in temporal sequences that represent the patient careflow. 1 Current data management technologies 2 are able to gather and merge data distributed in electronic health records (EHRs) and in administrative data warehouses (DW), thus enabling the access to large quantities of complex data that can be reused for better understanding chronic diseases. The application of longitudinal data analysis, and careflow discovery, enables the recognition of hidden temporal patterns, population stratification, and phenotypes definition. Careflow mining techniques can automatically detect the most frequent temporal patterns from routinely collected administrative and/or clinical data. Once identified, the careflows might be exploited to identify subgroups of individuals in large cohorts of patients.
Electronic phenotyping has been defined as the use of EHRs and secondary data to recognize a set of clinical conditions and characteristics that define a subcohort of patients, which is a computable phenotype.3,4 Careflow mining techniques can be used as a novel approach for electronic phenotyping. Examples of frameworks able to automatically extract phenotypes from EHR data are still limited and none of them is able to represent longitudinal data. While they combine different sources of EHR data, they tackle the complexity through rule-based approaches, 5 or they rely on semisupervised methods to extract patient narratives, but without explicitly representing temporal relations among events. 6 Recent applications 7 have shown the possibility of performing accurate predictions of hospital acquired complications as a function of health care system exposure using temporal clinical data. Yet few works are applied to characterize T2DM. Some cross-sectional approaches demonstrate improved performance in using EHR data, when compared to basic covariates. 8 Wei et al 9 apply a high-throughput clinical phenotyping algorithm to recognize T2DM cases and controls, and demonstrate the impact of insufficient longitudinal data on the accuracy of an algorithm, thus suggesting careful consideration of temporal aspects in the design and execution of T2DM phenotyping algorithms. In our previous work, we defined electronic temporal phenotyping by mining careflows, and we show how careflow mining (CFM) can be a useful instrument to identify the evolution of clinical states over time, across a population of breast cancer patients. 10
In this work, we present an extension of the method implemented in Dagliati et al, 10 and its application to analyze T2DM evolution, especially in terms of complications and assessment of metabolic control. This application shows a number of complex features. First of all, due to the chronic nature of T2DM, patients are usually followed for a long time. During this period, the progression of the disease is slow, and the process of care is characterized by frequent modifications (eg, changes in treatment). The clinical events each patient undergoes could be heterogeneous and influenced by multiple conditions. For this reason, the resulting dataset is characterized by high variability in the number and type of the events.
Methods
Dataset Description
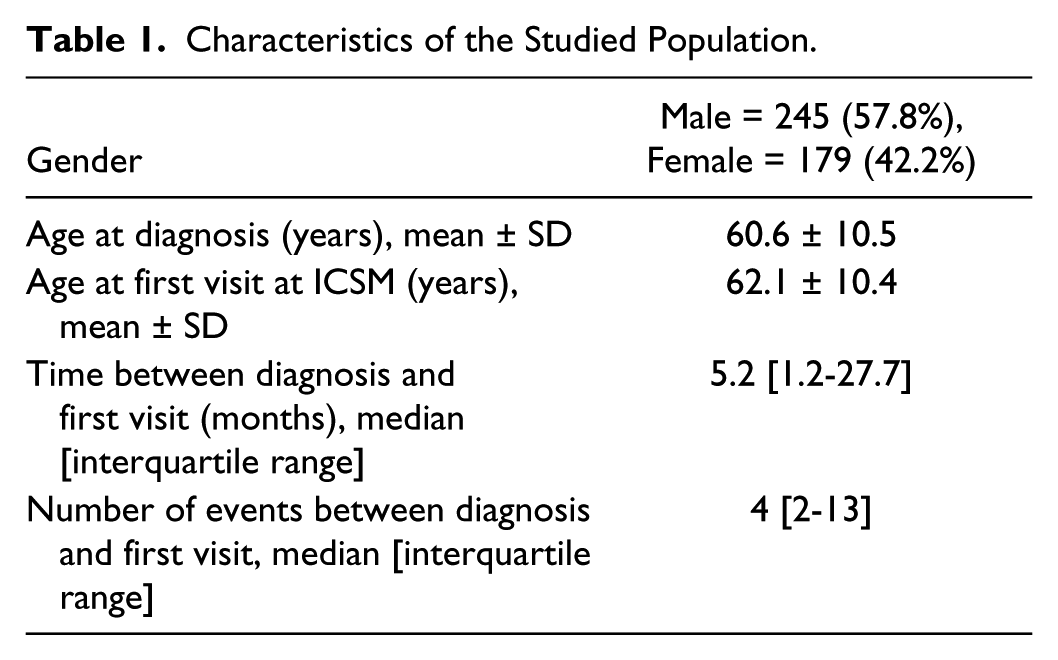
We considered a cohort of patients studied within the MOSAIC project, a EU funded grant aimed at developing a set of models and tools for improving T2DM management and control. 11 Among the initial set of more than 1000 patients available to the project, we selected a group of 424 subjects who were diagnosed with T2DM after 2004, and currently treated at the Istituti Clinici Scientifici Maugeri (ICSM) hospital in Pavia, Italy. ICSM is a specialist center where patients are referred to when they cannot be managed anymore by their general practitioners, typically when they start showing complications or poor control of the disease. In this work, we focus on the analysis of the administrative data collected on this cohort by the Pavia Local Health Care Agency (ATS), which were available from 2004. In particular, on the basis of clinicians’ interests, the algorithm was applied to the events patients underwent in the period between the diagnosis of T2DM and the first visit at ICSM. These events occur in a period during which the patients were still not followed by ICSM, and allow characterizing the process of care that took place at the early stages of the disease. These events refer to patients’ encounters within health care facilities other than ICSM, or general practitioners follow-ups. The characteristics of the analyzed population are shown in Table 1.
Characteristics of the Studied Population.
Careflows Discovery
To analyze the presented dataset, we have relied on the CFM algorithm presented in Dagliati et al. 10 This algorithm takes into account the temporal nature of the data, explicitly including both process and clinical information in a two-steps approach. The algorithm mines the most frequent patient histories for process events, and illustrates the evolution of the disease enriching the histories with clinical information. The choice of mining careflows through process data has its first reason in the fact that such data are already well-structured to be represented as event logs, which enable their exploitation for workflow modeling while avoiding costly procedures of preprocessing the entire corpus of clinical data. The patterns mined in the discovery step are the substrate for the additional inferences performed in the second step, where appropriate clinical data are used to enrich and compare specific transitions.
The detection of frequent careflows is based on two parameters, that guide the search process. These parameters are the minimum number of patients who verify a careflow (min_support), which can be expressed both in terms of absolute number or of proportion over the total population, and the maximum length of the mined careflows (max_length). The use of events temporal alignment to recognize similar profiles of patients adds a temporal dimension to the electronic phenotype. The results are represented using a directed acyclic graph (DAG) where events are connected through arcs that represent temporal connections.
To apply the algorithm to complex histories such as those of T2DM patients, we have developed an extension to consider activities that might occur in parallel, indicating two or more events that occur in the same time span in any order. In business process modeling, there are several advantages in exploiting parallel routing. Within process discovery, one of the first algorithm to be developed was the alpha algorithm, which scans event logs for specific patterns and represents them as Petri Nets. 12 The algorithm captures ordering relations between events through the so-called footprint of the event logs, which is a transition matrix representing relations for each pair of events. The alpha algorithm detects parallel events if the sequence of the footprint matrix allows representing parallel relations in events if sequences like <B, C> and <C, B> are detected. This is possible because in the footprint matrix each event is considered only once and, as typical in process mining, it does not consider the moment of occurrence of events within real histories.
One of the main differences of the developed CFM algorithm is that it produces a DAG, where events are shown as they occur in sequences during time. To represent parallel events, the same approach exploited with alpha algorithm is not applicable. Nevertheless, it was possible to apply a strategy for their detection inspired to the same relations among events. The strategy to detect and represent AND events is applied after the main DAG is mined, as an optional feature in the second step of the algorithm. The technique we have developed takes into account couples of events that might occur in parallel.
To describe this strategy, we will consider the example in Figure 1. In this example, the CFM algorithm resulted in two different careflows, namely <A,B,C,D> and <A,C,B,D>. Our methodology searches the mined pathways for sequences of events in the form <B, C> and <C, B>, but applies a further restriction on the moment when these sequences occur. Parallel events are detected in different paths of the history while satisfying the parallelism condition and occurring exactly at the same point of the history, in this case after the first event of the history (event A) and before the fourth one (event D). When the condition is detected, the two sequences <B, C> and <C, B> are merged and represented together as <B AND C>. The number of patients undergoing the new event <B AND C> is computed as the sum of the number of patients undergoing the original sequences of events.
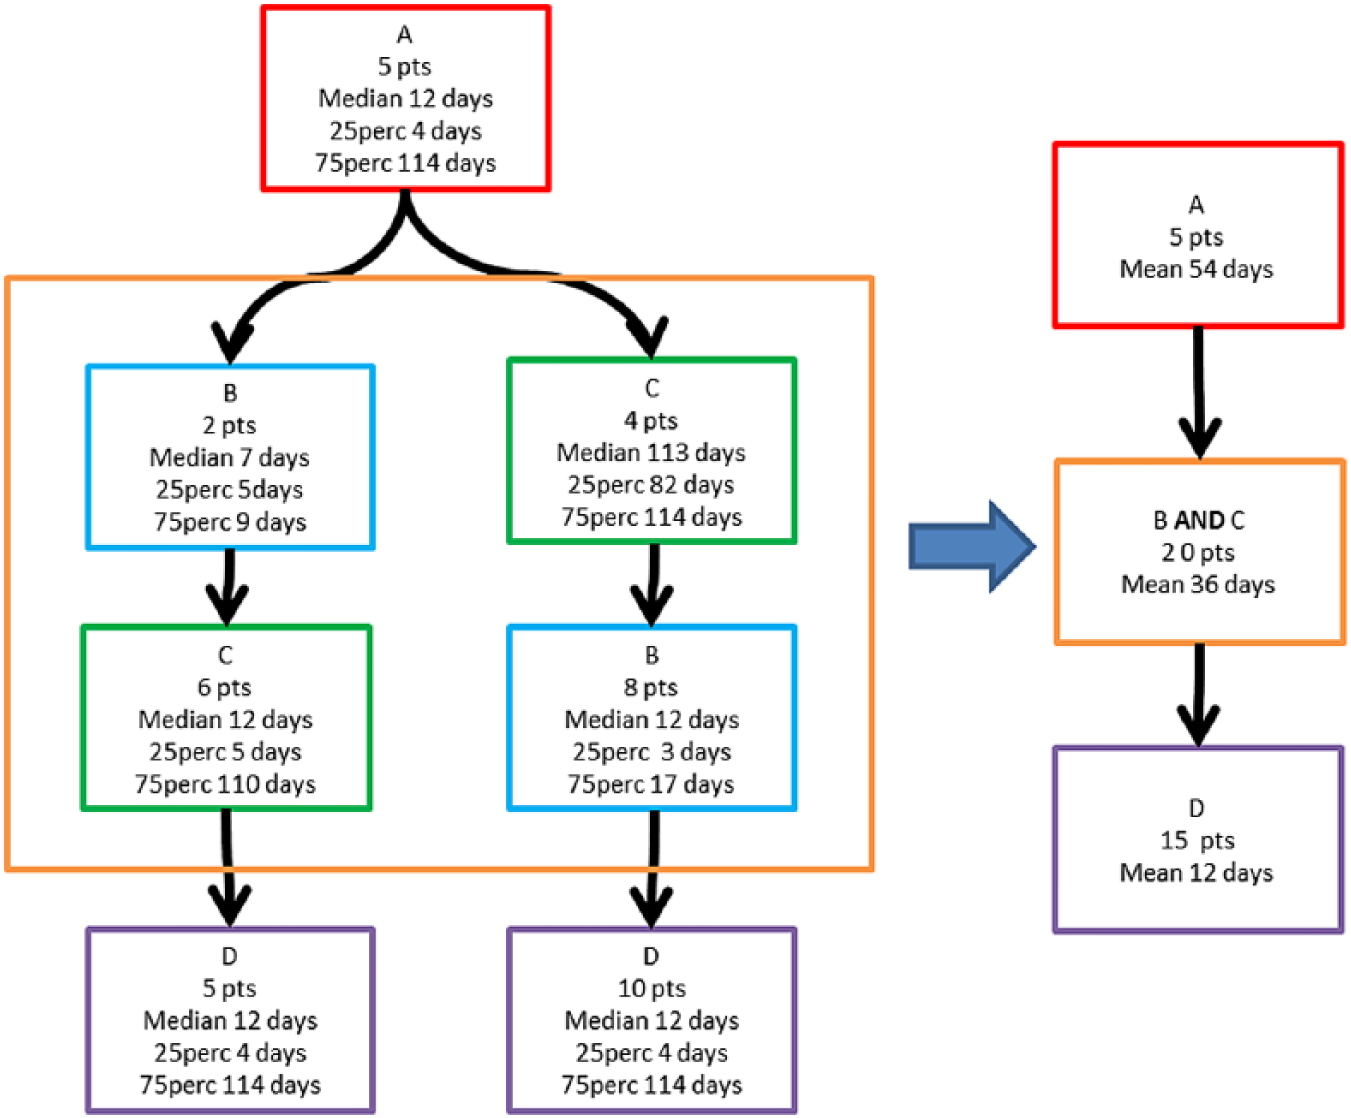
Concurrent events recognition and representation in the CFM algorithm.
This post processing approach might rise some issues related to the temporal features of events and arcs. The CFM algorithm presented in Dagliati et al, 10 enriches nodes and arcs by computing the median of the temporal durations for all the patients included in each careflow. In the present work, we chose not to use the median as measure of heterogeneous events duration when merging different events: finding the appropriate median when merging two events or arcs would require a new scan of the original data set. For computational simplicity, we used the mean instead, since this allows computing the mean of the mean of the original events.
Once the AND detection is performed, a possible loss of information can occur, especially in terms of temporal and clinical characteristics of the cohorts identified by the careflows. As a result of the merging, several arcs (which might contain some information useful to physicians) are not visible anymore, and the number of resulting subcohorts is reduced. Considering these issues, the detection of parallel events and their merging in AND was implemented as an additional functionality of the algorithm, giving the possibility to the user to select whether to use it or not.
Careflows Similarity
Mining careflows from process data allows precise descriptions of patients conditions and treatments. 13 Differently from other approaches, where the temporal similarity is exploited during clinical workflows mining, 14 the careflows extracted by our algorithm represent sequences that are identical in timing and order of events’ occurrence.
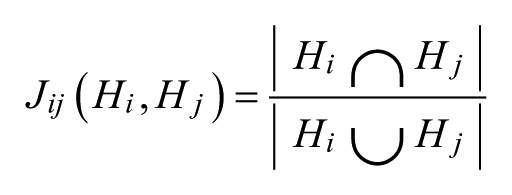
We therefore decided to use a similarity measure that allows comparing temporal phenotypes after algorithm execution. To this end, we exploited the Jaccard similarity coefficient. 15 The Jaccard index is commonly used in bioinformatics to compare genes and metabolic pathways.16,17 The Jaccard similarity coefficient is an index used to compare the similarity between finite sample sets, and it is defined as the size of the intersection divided by the size of the union of the sample sets. The result is a value between 0 and 1 representing a degree of similarity, where 0 means that the sets are completely dissimilar and 1 that they are identical. In this work, once the frequent histories are mined through the CFM algorithm, the Jaccard similarity coefficient is computed for each pair of sequences of events that build the histories associated to a detected phenotype. For each pair of mined histories Hi and Hj represented as sequence of events, Jij is computed as:
The result is a symmetric matrix of size N × N, where N is the number of the mined frequent histories. Intuitively, the similarity matrix allows understanding if the disease evolution of a group of patients, who underwent a certain history Hi, will be similar or not to another group of patients who underwent Hj.
The CFM algorithm allows discovering phenotypes where clinical procedures have similar evolving patterns. The disease progression in time can be better understood through the identification of the most meaningful paths in the DAG, which are the basis of phenotypes. The exploitation of the CFM results to convey phenotypes can be used for patients’ stratification. The identified subcohorts can be compared, assuming that similar careflows intuitively have comparable responses to treatments and are likely to encompass the same type of complications. Clinical decisions can be therefore tailored on the basis of the medical procedures expressed in the mined histories, enhancing precision medicine.
Results
In this section the potential of the developed methods for exploratory analysis and hypothesis generation on temporal phenotypes is evaluated. The goal is to leverage on process data, usually not available to physicians and decision makers, to identify subcohorts on the basis of the CFM algorithm and to detect potential interesting temporal patterns in the clinical histories of the patients. The relevance of the findings is evaluated from the clinical and disease management point of view, mainly through descriptive analysis. The goal is to evaluate whether it is possible to study in depth the characteristics of the identified subcohorts or specific patients, to detect potential treatments issues, and to compare them with other patient groups.
Data Preprocessing
In this work, we considered ambulatory procedures, inpatient hospitalizations, short procedure unit (SPU) visits, and drug purchases as clinical events. The different event types were preprocessed as follows:
Ambulatory procedures were grouped on the basis of the taxonomy used at the ATS that indicates the ward where procedures have been performed
Hospitalizations and SPU procedures were mapped into the first levels of the Clinical Classifications Software (CCS) for ICD-9-CM contained in the discharge summary 18
Drug purchases, already classified on the basis of ATC levels, were filtered to take into account only treatments for diabetes (i.e., insulin, sulfonamides, repaglinide, acarbose, incretin mimetic drugs, metformin, pioglitazone, glycosuric agents, and combinations). On the basis of clinicians’ suggestions, we aggregated metformin with pioglitazone, and sulfonamides with repaglinide. Consecutive purchases of the same drugs have been aggregated into single events
Diagnosis and first visit at ICSM were extracted from the hospital EHR
Parameters Selection
To select the parameters to be used in the CFM algorithm, we performed a grid search by varying min_support in the range 1-10 and max_length in the range 3-10. At each iteration, we computed the number of resulting careflows, the average number of patients included in the careflows, the average number of events not represented in the final careflows, and the proportion of real patient sequences fully represented by the mined careflows (true match rate). We decided to use the parameters that resulted in the best trade-off among the considered indicators. In particular, it is important to balance the number of extracted careflows to avoid excessive patient segmentation, and the expressivity of the resulting careflows in terms of representation of the real patients’ histories. Maximizing the true match rate allows maximizing the homogeneity of the sequences that are included in the same careflow. As shown in Figure 2, the parameters max_length = 10 and min_support = 3 result in an acceptable number of detected histories, while preserving a good matching rate and a low number of missed events.
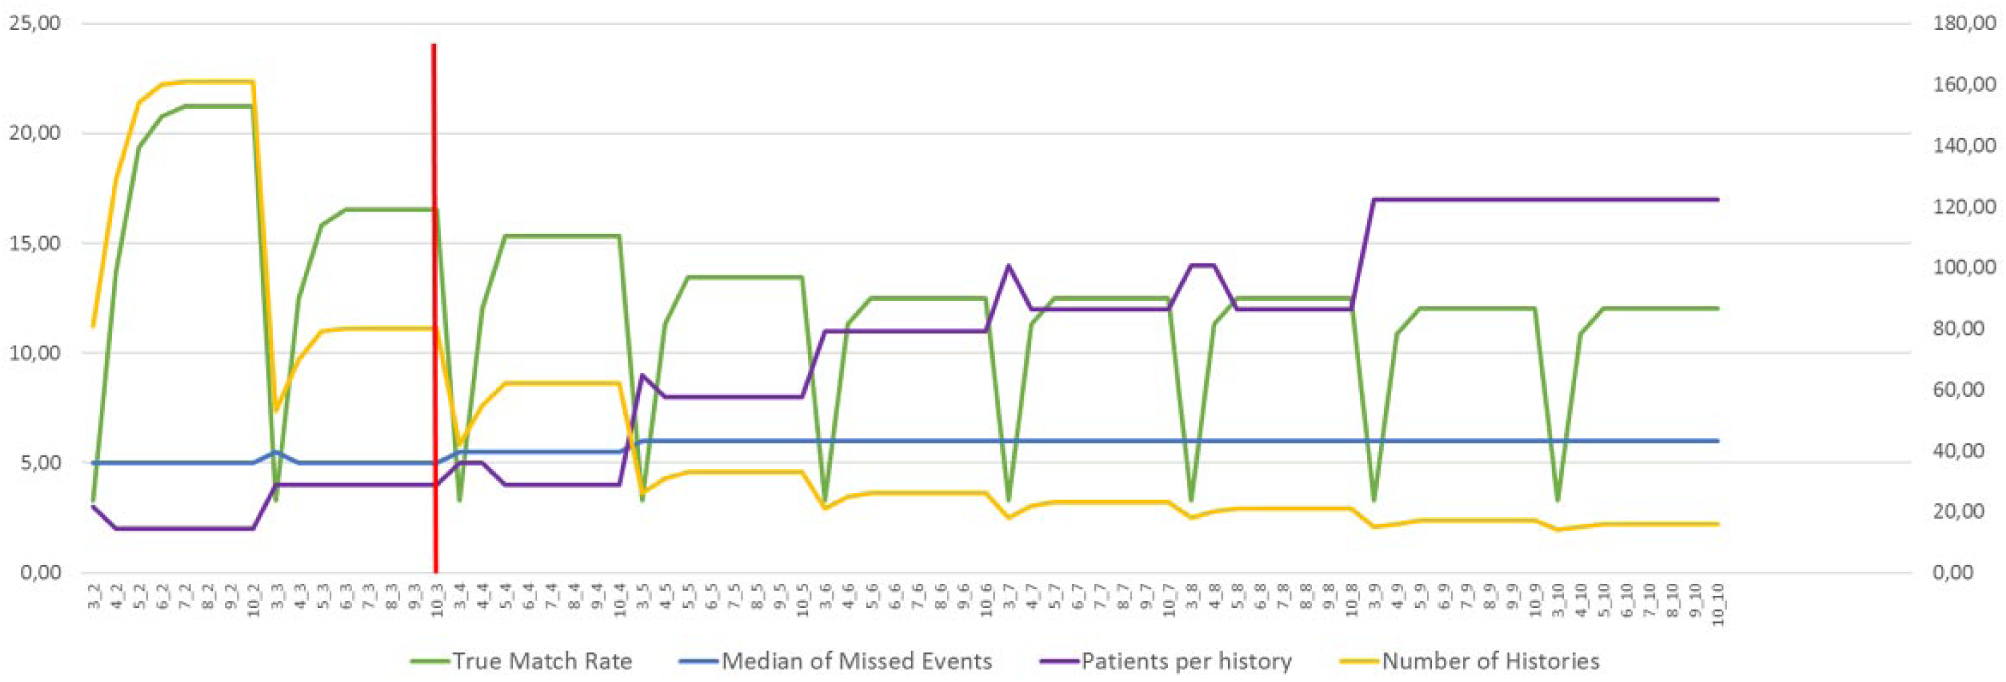
Grid search for parameters selection. True match rate: proportion of patient sequences fully represented by the mined careflows. Median of missed events: average number of events not represented in the final careflows. Patients per history: average number of patients included in the careflows. Number of histories: number of careflows detected by the algorithm.
Careflow Mining Results
Figure 3 shows the most frequent careflows extracted by our algorithm. It is possible to identify 12 phenotypes (Φ1 . . . Φ12). To obtain a compact representation, we represented only the first three events of the histories, instead of 10. This allowed obtaining careflows verified by a sufficient number of patients. This number is at least 10, with the exception of two careflows (Φ5, including 4 patients, and Φ7, including 8 patients).
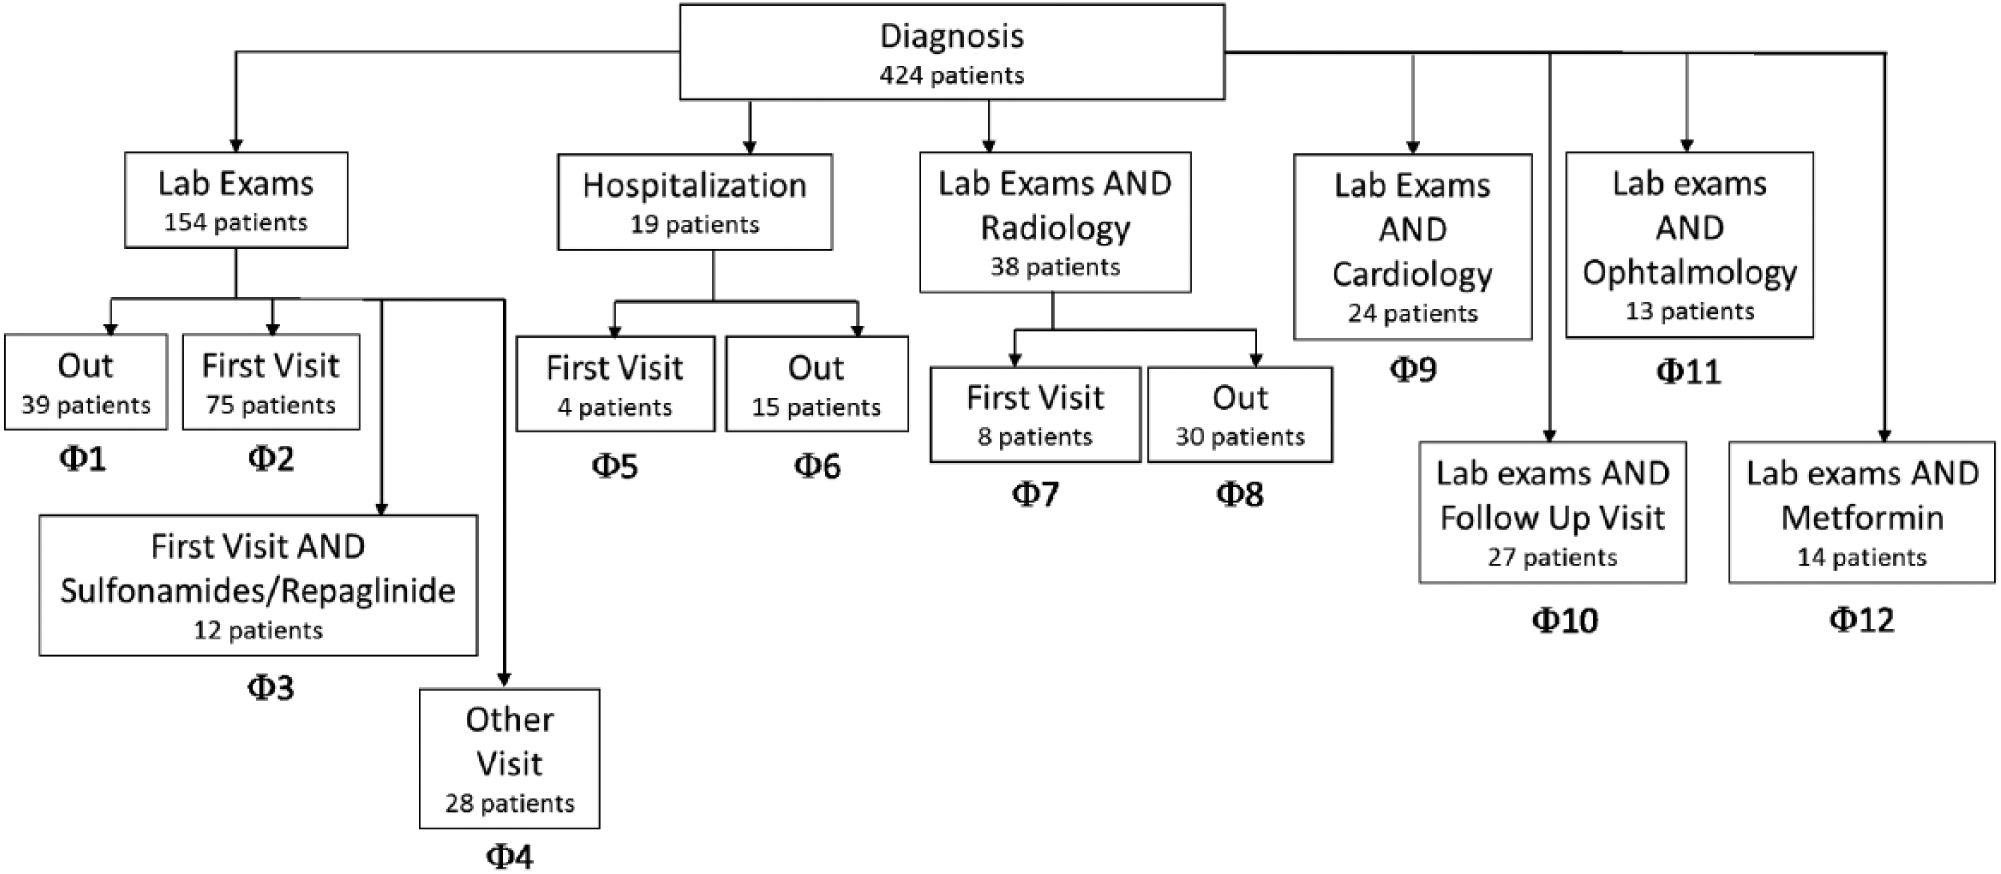
A view of the most frequent careflows extracted during the mining phase, considering only the first three events of each history.
The first event represented in the careflow is the T2DM diagnosis (Diagnosis). After the Diagnosis, the majority of the patients (66%) undergo a laboratory exam, which can be executed alone (Φ1 to Φ3) or in combination with other visits or tests (Φ4 and Φ7 to Φ11), such as cardiology visits, ophthalmology visits or imaging. Such visits are common in patients who have just been diagnosed with diabetes, as they are used to screen possible complications of the disease, such as cardiovascular complications or diabetic retinopathy. A group of patients experience early treatment with metformin (Φ12). Interestingly, a group of 19 patients (Φ5 and Φ6) undergo a hospitalization just after the diagnosis.
Patients identified by the careflows Φ7 - Φ12 represent examples of how parallel events have been extracted. Patients associated with Φ8 follow either the careflow “Diagnosis → Laboratory Exam → Radiology → End” or the careflow “Diagnosis → Radiology → Laboratory Exam → End.” The event “Laboratory Exam AND Radiology” is detected and represented.
To assess the informative power of the careflow mined from process data, clinical outcomes were used to enrich the mining results. Hba1c has been selected as the most meaningful biomarker for T2DM control. We considered HbA1c measures performed between the diagnosis and the first visit for all the patients, and compared the values among all the different careflows using the Kruskal-Wallis test. The test resulted in a P-value of .004, showing significant differences in terms of metabolic control among careflows. Moreover, the post hoc analysis revealed that patients following careflow Φ3 are the most different from others in terms of metabolic control. This careflow includes 12 patients, who, after performing an initial set of lab exams, are directed to ICSM for the first visit and contextually receive a treatment with oral hypoglycemic agents. This group of patients shows median Hba1c values of 97.3mmol/mol, while in the other subgroups it ranges from 42 to 87.9mmol/mol. In addition, if we compare the time elapsed between the diagnosis and the first visit among Φ2 and Φ3 using a Wilcoxon test, we obtain significant results (P = .025). This means that the group of patients who start to be treated in proximity of the first visit is also the one that starts to be followed earlier by ICSM. These patients are probably the most complex ones, as confirmed by the high HbA1c values, and they need to be treated with early medication.
Only one group of patients reported HbA1c values higher than Φ3, although not resulting significantly different from the others due to the low dimension of the sample (4 patients). This group corresponds to careflow Φ5, and it is related to patients who undergo an hospitalization and are then directed to ICSM to start being followed by the diabetology unit. Also in this case, patients who are directed to the specialist center just after a hospitalization, are those who need closer control.
To further investigate the progress of disease, we chose to consider the onset of complications after the first visit at ICSM. In this work, we consider T2DM complications as divided into macrovascular and microvascular complications. Macrovascular complications include cardiovascular diseases such as stroke, acute myocardial infarction, chronic ischemic heart disease, and occlusion and stenosis of carotid artery. Microvascular complications include diabetic retinopathy, nephropathy, and neuropathy. In our sample, 75 patients 17.7%) developed a microvascular complication after the first visit at ICSM, and 94 (22.2%) patients developed a microvascular complication after the first visit. The distribution of complications is shown in Table 2.
Statistics on the Complications After First Visit in the Resulting Careflows.
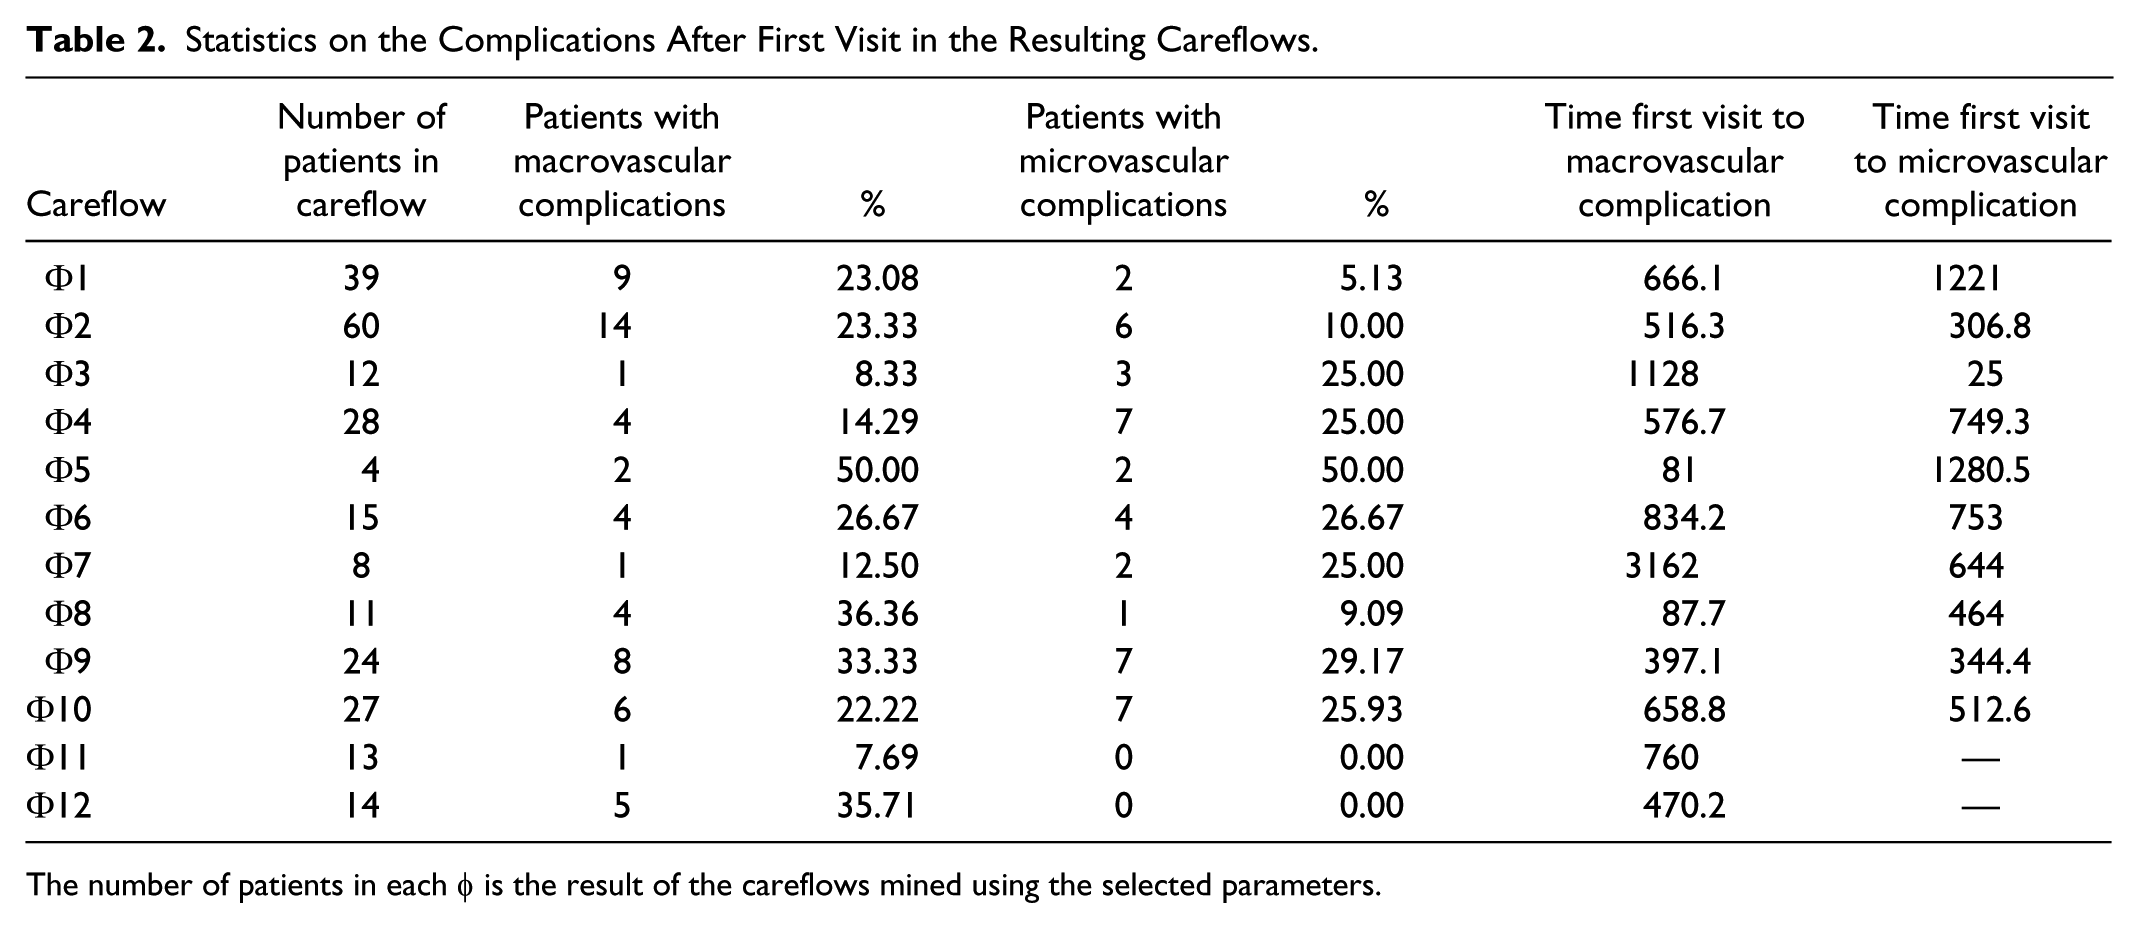
The number of patients in each φ is the result of the careflows mined using the selected parameters.
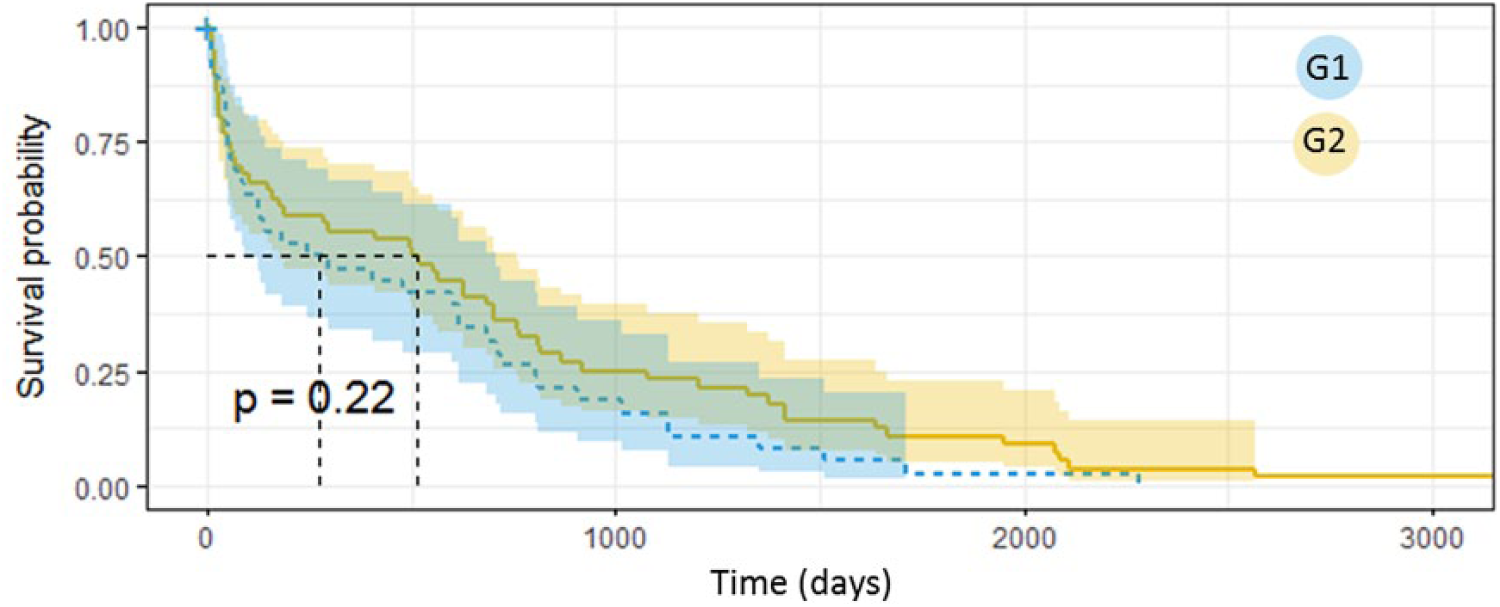
Given the relatively small number of complicated patients in our dataset, performing an analysis on each of the careflows in Table 2 would lead to results that are not robust, as there are careflows with a very small number or zero complicated patients. For this reason, we have performed an aggregation of the careflows relying on the Jaccard similarity. As a result of this analysis, we found a group of careflows that show a similarity >0.7. These careflows are Φ1, Φ2, Φ3, Φ9, Φ10, and Φ12. We thus merged patients belonging to these careflows in a single group G1, and compared them using the Kaplan-Meier survival curve to a group of patients including all the others (G2).
We first considered the onset of any complication, without differentiating between macrovascular and microvascular. The results are shown in Figure 4. Patients belonging to G1 show a significantly faster worsening of the disease when compared to the other patients.
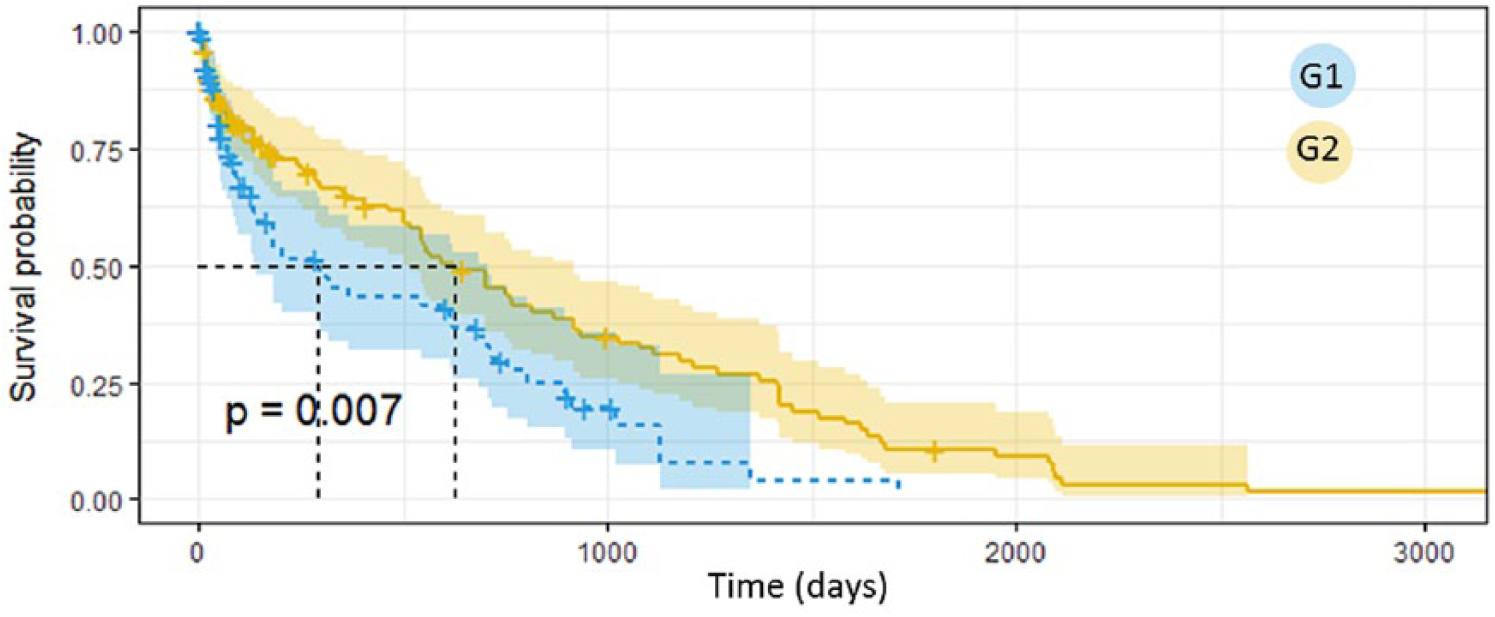
Survival analysis on the onset of complications in G1 and G2.
When analyzing the complications separately, we found significant results for the microvascular complications (P = .01, Figure 5), whereas the results for macrovascular complications, although not significant, show that patients in G1 have the tendency of developing the complication earlier than the patients in G2 (Figure 6). When comparing the median time of complication onset after the first visit with a Wilcoxon test, we obtained significant results (P < .01) both for microvascular and macrovascular complications, with G1 showing always smaller values.
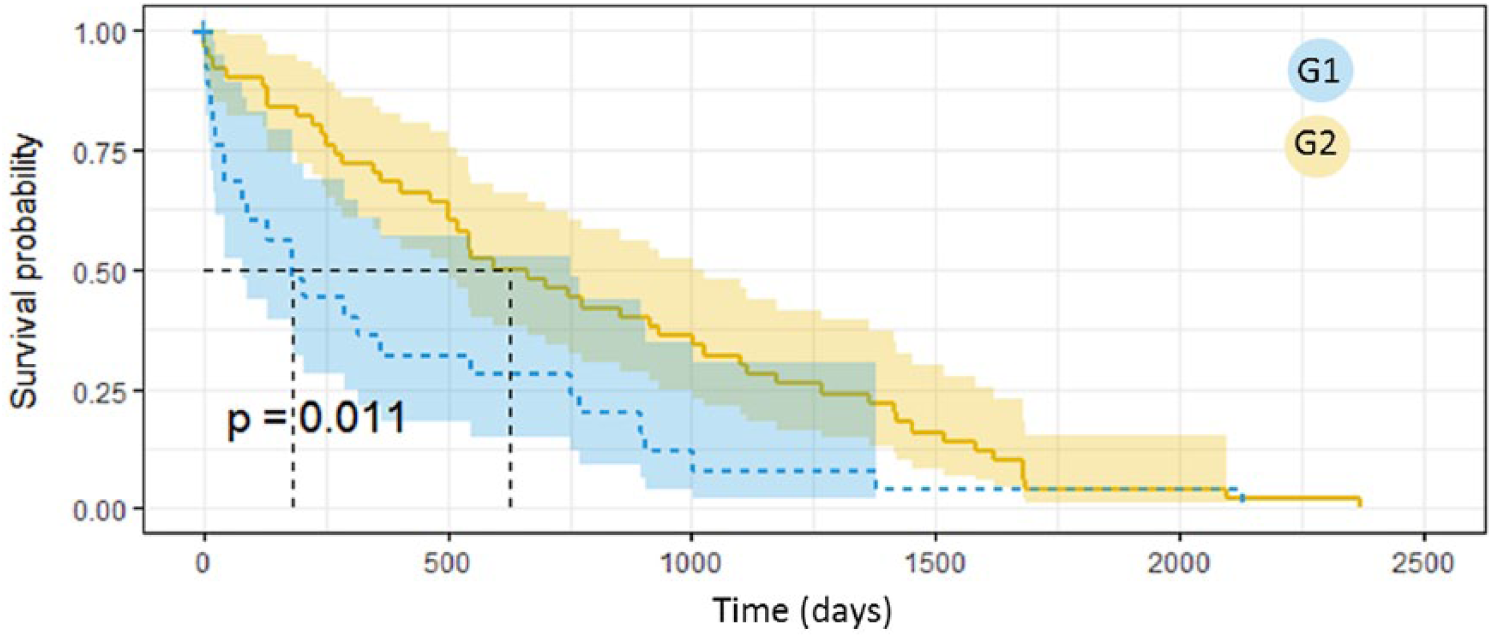
Survival analysis on the onset of microvascular complications in G1 and G2.
Survival analysis on the onset of macrovascular complications in G1 and G2.
Discussion and Conclusion
In this article we have shown how CFM techniques can be used to characterize the patterns of care experienced by the patients during the course of their disease. These techniques have the advantage of explicitly modeling the temporal dimension of clinical data, and to summarize complex evolutions into a synthetic representation, which can be used to further reason about the data. Besides the capability of leveraging on longitudinal instead of static data, the use of the CFM algorithm to automatically retrieve phenotypes from careflows detected in a specific clinical setting, allows dynamically reassessing risk profiles and characterizing the complexity of chronic patients.
As already pointed out, T2DM disease careflows can last for a long time (data available to the MOSAIC project had been retrospectively collected for 10 years), the disease progression is slow and characterized by frequent modifications. Moreover, events can be related not only to the diabetic disease, but to any other condition experienced by a subject in such a long time (eg, national screening procedures, seasonal flu or traumatic events). In this context, it is important to find meaningful groups of patients who follow the most frequent patterns of care, as well as being able to identify those critical cases who need specific attention. Our results show that the CFM algorithm can well serve to this objective, as it was able to synthesize the variability of the patients into 12 easy to interpret careflows. The detected temporal patterns make possible to reconstruct clinical pathways and estimate metabolic control deviations, which might arise during the process of care. In particular, the algorithm was able to isolate some critical groups with poor disease control measured in terms of HbA1c levels. It is important to point out that this characterization could be done on the careflows that were mined without taking into account any clinical parameter of the patients.
As automatically retrieved from retrospective process data, phenotyping results should be checked for clinical relevance. Besides using HbA1c time series, we have also considered complications as an indicator of disease progression, and we use them to evaluate the capability of the extracted phenotypes to stratify the population in this respect. The presented analysis framework identifies interesting clusters of patients with similar care histories, who also showed similar characteristics in terms of developing complications.
The proposed approach has some limitations. As already mentioned, T2DM patients experience a lot of different and heterogeneous procedures over long periods of time. The assumptions for pruning the mined careflows close to the diagnosis is motivated by the high variability characterizing this chronic disease, in addition to the necessity of choosing a support able to balance the clarity of the mined careflows and the meaningfulness of the phenotypes. However, some clinically relevant events that occur later in patients’ histories or in small groups of patients are not represented. The same consideration holds for repeating or cyclic events, which might occur because of the constant monitoring, and cannot be automatically detected by the careflow discovery step. To overcome these context-related problems, efforts need to be focused on better preprocessing events and merging data into more informative, knowledge-based, events. This is an emerging area in process mining, and efforts can be found in the recent literature to aggregate activities to detect both typical and infrequent behaviors in complex clinical processes. 19 Moreover, events aggregation could be performed by relying on semantic similarity based on knowledge formalizations (eg, ontologies). 20
In this article we have presented an extension of the original CFM algorithm to include parallel events modeled by a logical AND. This allowed creating larger and more synthetic groups. To further aggregate the extracted patterns, it could be possible to consider also the detection of alternative events, modeled by a logical OR, or increasing to more than two the number of events involved in the parallel routing. Finally, up to now we have compared the careflows using only the Jaccard similarity index. Future efforts will be dedicated to explore also other measures, such as the edit distance and ontology structure-based similarity measures, 17 especially for histories composed of large number of events.
Footnotes
Abbreviations
ATS, Agenzia di tutela della salute; CCS, clinical classification software; CFM, careflow mining; DAG, directed acyclic graph; DW, data warehouse; EHR, electronic health record; ICSM, Istituti Clinici Scientifici Maugeri; SPU, short procedure unit; T2DM, type 2 diabetes mellitus.
Declaration of Conflicting Interests
The author(s) declared no potential conflicts of interest with respect to the research, authorship, and/or publication of this article.
Funding
The author(s) disclosed receipt of the following financial support for the research, authorship, and/or publication of this article: This work was supported by the European Union in the VII framework program grant number 600914.