
Abstract
Background:
Continuous glucose monitoring (CGM) systems are increasingly becoming essential components in type 1 diabetes mellitus (T1DM) management. Current CGM technology requires frequent calibration to ensure accurate sensor performance. The accuracy of these systems is of great importance since medical decisions are made based on monitored glucose values and trends.
Methods:
In this work, we introduce a calibration strategy that is augmented with a weekly updating feature. During the life cycle of the sensor, the calibration mechanism periodically estimates the parameters of a calibration model to fit self-monitoring blood glucose (SMBG) measurements. At the end of each week of use, an optimization problem that minimizes the sum of squared residuals between past reference and predicted blood glucose values is solved remotely to identify personalized calibration parameters. The newly identified parameters are used to initialize the calibration mechanism of the following week.
Results:
The proposed method was evaluated using two sets of clinical data both consisting of 6 weeks of Dexcom G4 Platinum CGM data on 10 adults with T1DM (over 10 000 hours of CGM use), with seven SMBG data points per day measured by each subject in an unsupervised outpatient setting. Updating the calibration parameters using the history of calibration data indicated a positive trend of improving CGM performance.
Conclusions:
Although not statistically significant, the updating framework showed a relative improvement of CGM accuracy compared to the non-updating, static calibration method. The use of information collected for longer periods is expected to improve the performance of the sensor over time.
Background
Recent developments in continuous glucose monitoring (CGM) technology have significantly advanced clinical management in type 1 diabetes mellitus (T1DM). 1 CGM sensors provide estimates of glucose concentration based on interstitial glucose measurements at every 1-5 minutes. The sensor is placed on the subcutaneous tissue of the body and measures the electrical signal produced by an electrochemical reaction, taking place on the electroactive surfaces of the sensing region. A calibration process is required to translate the signal measured by the glucose sensor to a meaningful clinical value using a reference glucose value as the standard. Common calibration processes for commercial CGM systems use capillary blood glucose concentration measurements taken by self-monitoring blood glucose (SMBG) as the reference glucose value. 2 Recalibration of the currently available sensors is required in frequent time intervals varying from several to one calibration per day, due to changes in sensor sensitivity over its lifespan.3,4 Another innovative technological trend in glucose monitoring is the flash glucose monitoring system that is factory calibrated and therefore does not require additional fingerstick SMBG measurements for sensor calibration. 5
However even the latest generation of sensors at the time of this writing have a small degree of error, with reported mean absolute relative difference (MARD) of 9% for the latest Dexcom G5/G4 with 505 algorithm, 6 10% for the Medtronic Guardian Sensor 3, 7 and up to 13% for the Dexcom G4 prior to the 505 upgrade. 6 CGM systems measure glucose in the interstitial fluid. Therefore, the time required for glucose to diffuse into the interstitial space 8 results in a time lag between CGM and true blood glucose (BG) readings. As artificial pancreas (AP) technology relies on CGM for adjusting doses of insulin as frequently as every 5 minutes, 9 dynamic accuracy of the CGM is paramount to the performance of an AP controller and entailing features, for example, fault detection. 2 Therefore, there is a distinct need to ensure the ability of CGM to provide precise and accurate BG measurements in an effort to enhance the quality of diabetes care.
Several methods aiming to improve glucose sensor accuracy have been reported in the literature, with some performed using batch data analysis offline, while others performed analysis point-to-point that could potentially be used in real-time. In Guerra et al, 10 to account for the interstitial to blood glucose dynamics, deconvolution of the raw sensor signal is performed and a continuous BG profile is obtained that is instead used for calibration. The estimation of the calibration parameters of this method was enhanced by using a Bayesian framework that incorporates a priori statistical knowledge of the parameters. 11 A retrofitting algorithm was developed to retrospectively improve CGM accuracy originally tested on Dexcom Seven Plus 12 and then on Dexcom G5 data. 13 Barceló-Rico et al 14 proposed an adaptive method to compute on-line data normalization parameters of a dynamic calibration model that consists of a set of local models. Other approaches using dynamic calibration models have also been considered.15-17
However, these methods do not capture the essential cyclic nature of CGM use in people with T1DM. That is, current CGM sensors are replaced after several days (5-76,18 or 14 days 19 ) of continuous use. This continuous usage provides rich, personalized, time-paired data of raw sensor signal values and SMBG measurements prior to new sensor operation. As a result, continuous CGM wear can be considered within an updating framework to successively improve the accuracy of the CGM over time. 20 Such algorithms have been previously used for adaptation of diabetes care regimens to individuals through modification of critical clinical parameters, such as insulin basal rate 21 or insulin-to-carbohydrate ratios.22,23 In addition, AP systems have also been employed within an adaptive framework.24,25
We hypothesized that errors in CGM accuracy could be minimized by exploiting the observed bias of sensor readings in individual patients, as some individuals with T1DM report consistent patterns of error at given times (for example, CGM frequently reporting lower values than their BG meter when glucose is in the lower range). To attempt to account for this trend, we designed and evaluated a novel week-to-week updating calibration strategy to improve sensor accuracy after each week of successive CGM use in individuals with T1DM, personalized to the sensor pattern observed in each individual. Subsequently, we evaluated the calibration scheme on a new cohort of subjects to show generalizability.
Methods
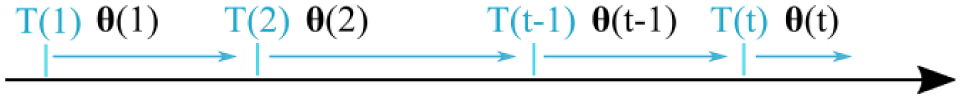
The proposed calibration strategy consists of a calibration model, an online calibration mechanism and an updating feature. The strategy was refined by evaluating 6 weeks of Dexcom G4 Platinum CGM data collected by 10 adults with T1DM (over 10 000 hours of CGM use), with seven SMBG data points measured per day by each subject in an unsupervised outpatient setting. The calibration mechanism periodically estimates the calibration model parameters to fit SMBG measurements taken approximately every 12 hours. After evaluating each week of data, an optimization problem that minimizes the sum of squared residuals between reference and predicted blood glucose values of the past weeks is solved remotely to identify personalized calibration parameters. The calibration model is then updated with the newly identified parameters for the following week of CGM use (Figure 1). In the following sections, we present the details of the proposed framework.
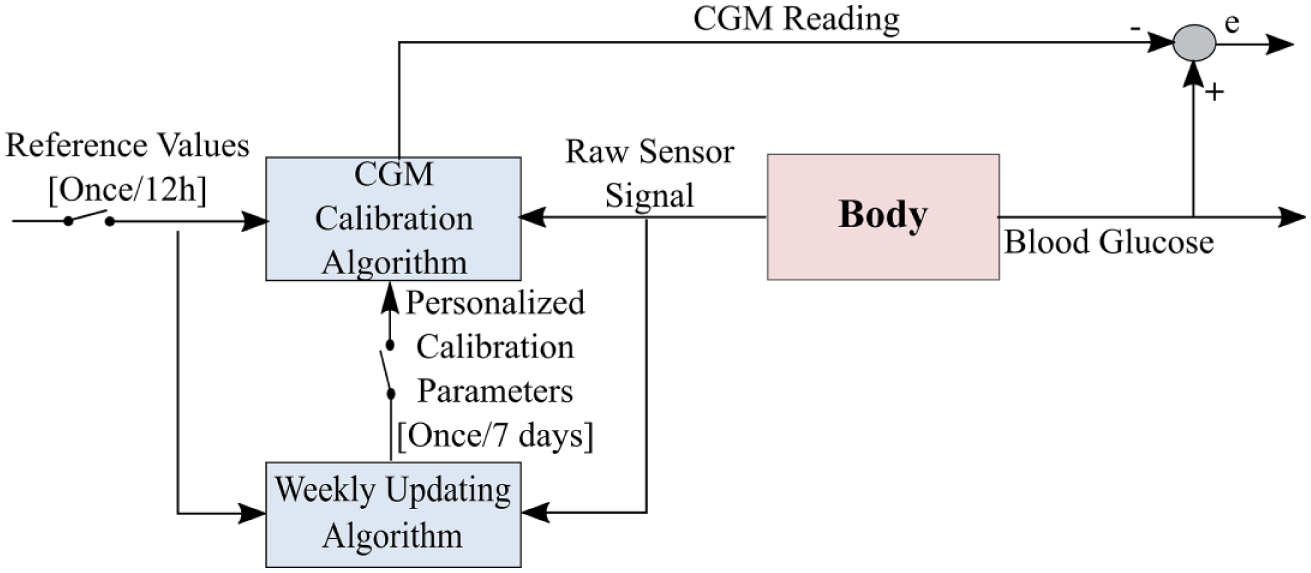
A schematic demonstrating the weekly operation of the proposed calibration strategy. The proposed calibration method is applied directly on the raw senor signal and therefore there is no learning from the original calibration.
Calibration Model
A linear calibration model that is widely considered in the literature4,16 is used to translate raw sensor signal to glucose predictions. A linear drift of the sensor signal is considered to approximate the change of sensor sensitivity over time.4,11

We choose the independent variable
Calibration Mechanism: Recursive Least Squares Parameter Estimation
The sensor takes measurements at discrete times with constant sampling intervals τ = 5 min. Approximately every 12 hours (for Dexcom G4 sensors) the sensor is calibrated and a new time pair of reference glucose value and sensor signal is obtained

where

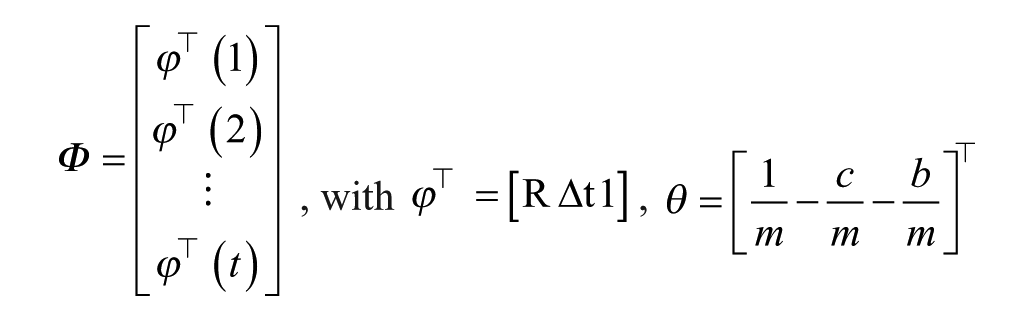
and
while
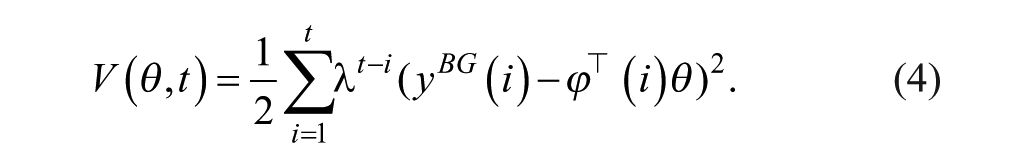
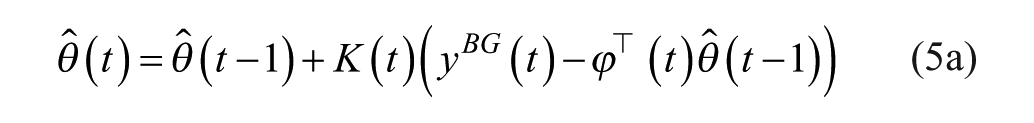
This problem can be solved using recursive least squares with forgetting factor, such that θ is obtained from:

with
Here, the weighting factor
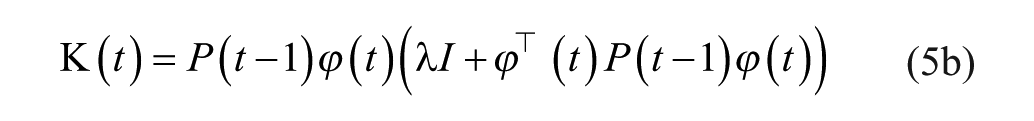
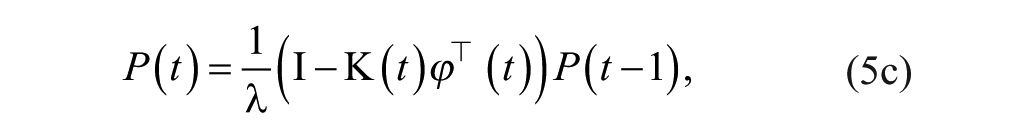
where matrix P is referred to as the covariance matrix. Details on the algorithm derivation can be widely found in the literature.
27
At every new calibration point, the estimates on parameters
Calibration process. The calibration parameters denoted with
Blood glucose SMBG samples lying outside the reporting range of the sensor, that is,
Week-to-Week Update
Herein, we introduce an updating framework that utilizes each subject’s past calibration data points to identify personalized calibration parameters that initialize the calibration process of the following week. Thus, starting from population values, as explained in the Initialization section below, every week the calibration process is initialized using the newly identified calibration parameters. It is important to note that the weekly updating computations can be performed remotely and therefore no additional resources are required for commercial devices.
At the end of every week of continuous use, the following cost function is minimized:

Where
The solution of equation 6 gives the set of parameters
The weekly updating feature is applied and evaluated for three windowing schemes (Figure 3).
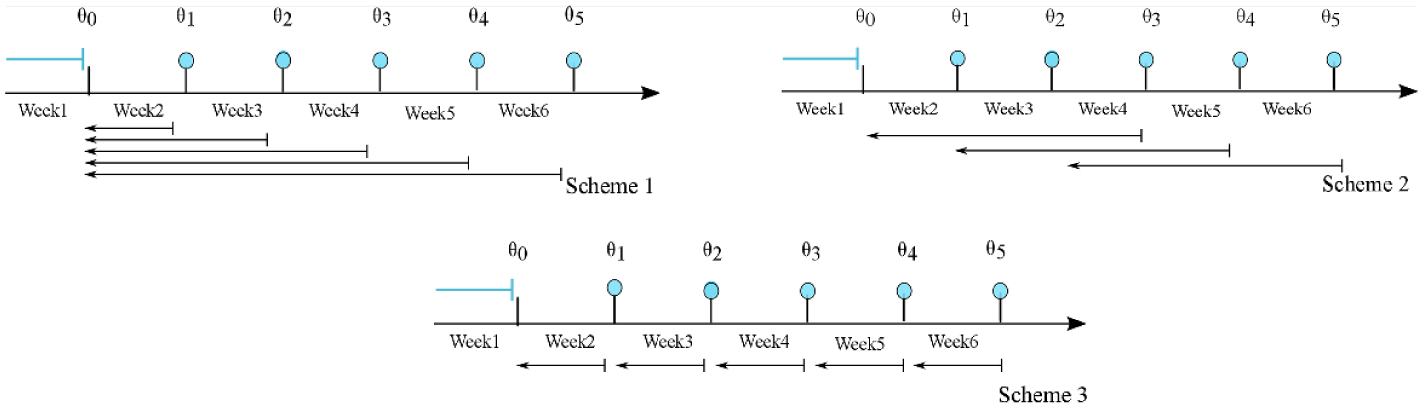
Updating schemes. The blue filled circles denote the end of each week and the implementation of the weekly updating algorithm. The arrows show the history of data used in each scheme. Week 1, in all cases, is not considered in the process, and it is only used to obtain an initial estimate of the parameters.
Scheme 1: In the first scheme the entire history of the calibration data is used for every subject.
Scheme 2: In the second scheme a moving window of the past 3 weeks of calibration data is used for every subject.
Scheme 3: The third scheme is a special case of scheme 2 with one-week horizon.
The idea of using past weekly calibration data to identify individualized calibration parameter sets over time, is based on the assumption that there is an individual consistent pattern of body response to a foreign object. Indeed, it is anticipated that different body reactions can take place after sensor insertion depending on the insertion procedure itself, the insertion site, the chemistry of the biomaterial surface and the transient provisional matrix that forms around it, 28 any of which could have an effect on the calibration procedure. As summarized in Anderson et al, 29 there are two distinct characteristics that can influence the host response interaction. The first is the material variables, such as composition, surface chemical composition, porosity, and so on of the biomaterial and the second is the generic host response to biomaterials such as protein absorption, macrophages activation and foreign body giant cell production. We assume that since the commercial sensors come in a box of four and all sensors used were from the same factory batch (same lot numbers), the first source of variability of the interactions is minimized and therefore, we focus only on characterizing patient-specific response to the sensor, as reflected through individualized calibration parameters. For the case when sensors from different factory batches are used, the algorithm will gradually adapt to the new calibration settings over time when more weekly sets of data are collected.
Initialization
For the calibration algorithm initialization, two variables need to be specified, the initial values of the parameters
Performance Evaluation Metrics
The following outcome metrics were used for evaluation:
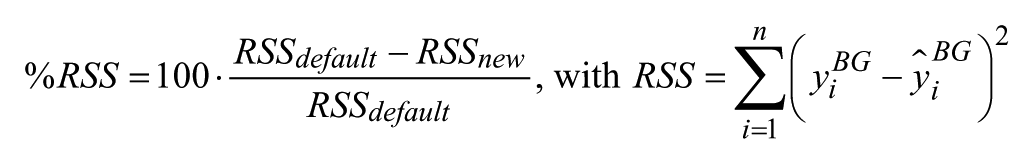
1) Percentage improvement of sum of squared residuals
2) Root mean square error

3) Mean absolute difference

where n is the number of data pairs.
Mean absolute relative difference (MARD) is a commonly considered metric to assess sensor accuracy. 30 However, the objective of this study was to learn the personalized calibration parameters of each subject using SMBG data usually collected in everyday life. Therefore, the SMBG dataset collected is not appropriate to compute meaningful MARD values since it is small, and it consists of infrequent SMBG measurements obtained under unsupervised setting. Hence, we decided to exclude MARD for performance assessment since it could result in misleading conclusions when compared to the usual ranges commonly reported in the literature.
Data Sets
We use two sets of data consisting of 6 weeks and 10 subjects. We refer to set 1 as the training set and to set 2 as the validation set, since the first set is used to develop the proposed mechanism, and the second set as a completely novel and independent set that we use to evaluate the performance of the proposed mechanism. However, there is a second level of data differentiation. We divide the SMBG data in both sets to data labeled as “calibration data points” and to “test-set data points.” We use the calibration data to apply the algorithm (recursive least square and weekly updating feature) and the test-set data is used exclusively for performance evaluation. The SMBG data obtained in both datasets was labeled as either calibration data or SMBG data; therefore, the distinction between data points was inherent in the dataset and not performed by us.
Training Data Set
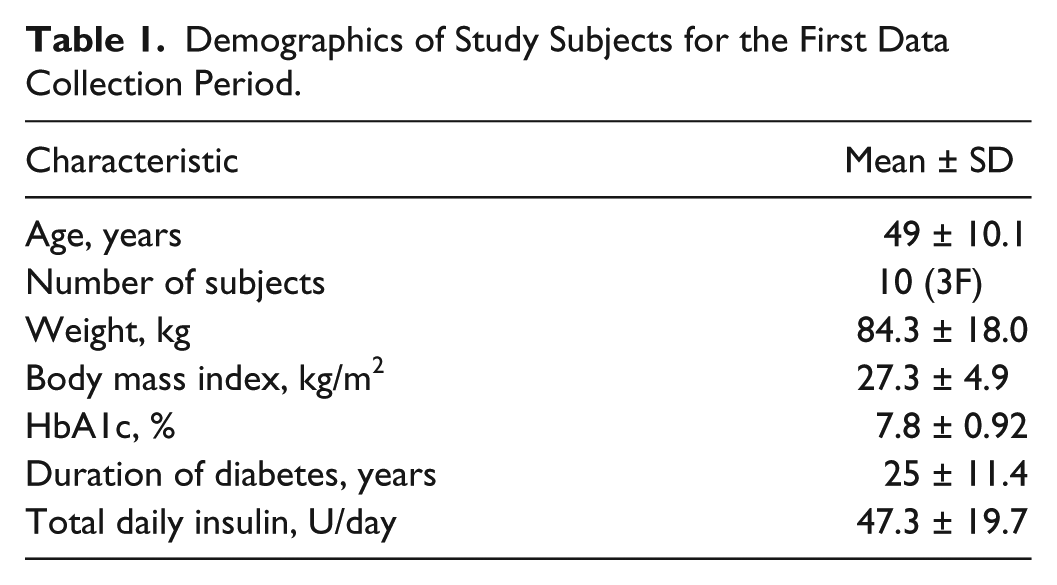
To evaluate the proposed method, 10 subjects with T1DM collected 6 weeks of CGM data per subject, with instructions to check at least seven fingerstick glucose measurements per day. Demographics from this first clinical cohort who completed the protocol are presented in Table 1. The data set collected by this cohort was treated as the training set to finalize the design details of the proposed method.
Demographics of Study Subjects for the First Data Collection Period.
First, we evaluated the performance of the proposed calibration process. We refer to this calibration process as static since no week-to-week updating of the parameters is performed yet. We consider the static calibration as an intermediate to compare the proposed updating scheme to the default calibration. Since the details of the default calibration are proprietary and, hence, not available, the weekly updating scheme cannot be directly applied to the CGM internal calibration algorithm. The static calibration is initialized for all subjects and all weeks with the average parameter set obtained from week 1, as described in the Initialization section. Therefore, week 1 for all subjects is not included in the analysis. Furthermore, for a fair comparison of the proposed algorithm with the original CGM, test BG points that correspond to default CGM values that are outside the displayed range of 40 to 400 mg/dL are excluded from the performance evaluation analysis. Finally, if 80% of the available test-data for a particular week is missing, this week is not considered in the evaluation process, to prevent introduction of bias in the computed performance metrics.
Hence, 16 of the total 60 weeks were not included in the analysis and a total of 1531 SMBG samples over all subjects and all weeks were used for evaluation. The performance metrics were computed for all data points in every week and for every subject and a weekly median interquartile range (IQR) over all subjects is reported.
Validation Data Set
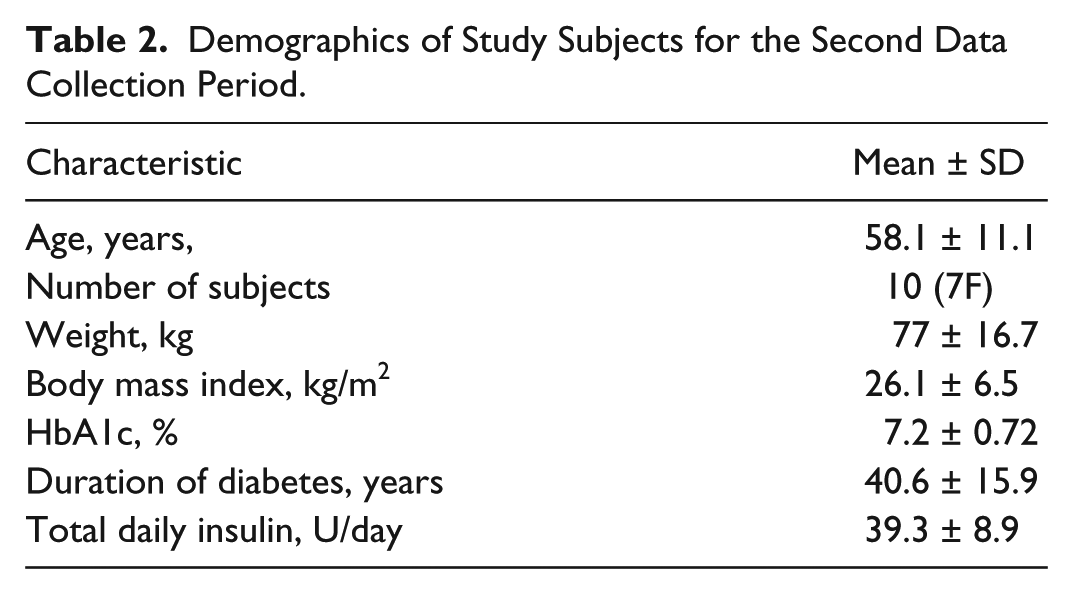
To test the generalizability of the algorithm, a second cohort of subjects with T1DM collected 6 weeks of CGM data per subject, with instructions to check at least 7 fingerstick glucose measurements per day. Demographic characteristics of the 10 subjects who completed this second data collection protocol are shown in Table 2.
Demographics of Study Subjects for the Second Data Collection Period.
Similarly to the evaluation process considered for the training set cohort, data labeled as calibration are excluded from the performance analysis and only test-set data points are included.
Selection of Design Parameters
The design parameters that need to be specified are the forgetting factors λ (equation 4) and μ (equation 6) and the parameter δ of the covariance matrix P0 (equation 5c). To determine parameters λ and δ, we consider that their values vary in the following ranges: λ
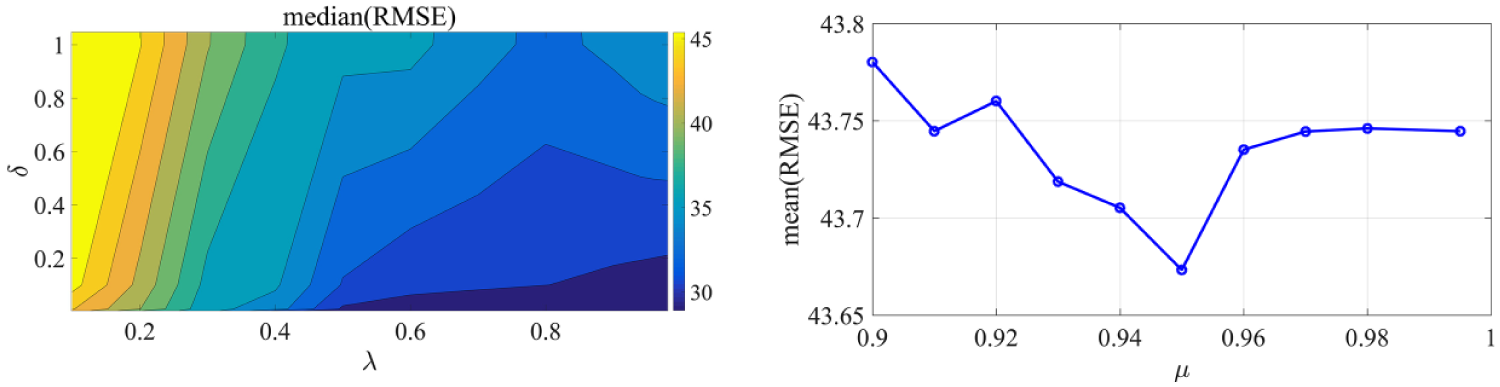
(Left) Contour plot zoomed in the area of interest (
Results
Evaluation of the Proposed Method
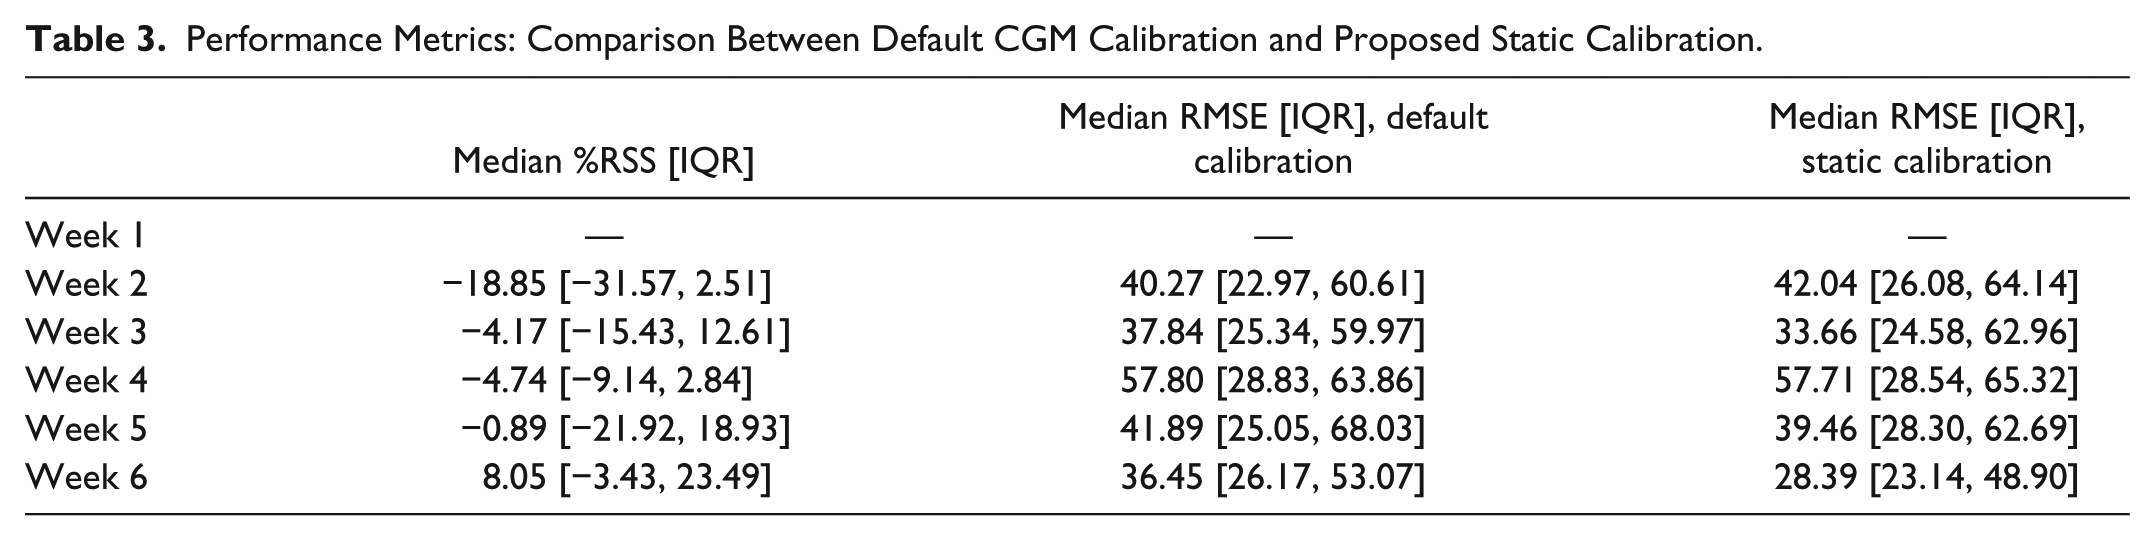
The performance metrics calculated for the training set are presented in Table 3. We can observe that the proposed calibration performs similarly to the default CGM calibration and the difference in the reported values is not statistically significant (P value > .05). The median RMSE compared to the default calibration is decreased for all weeks except week 2. Indeed, the maximum decrease in median RMSE is 8.10 mg/dL in week 6. This improvement is consistent with the reported %RSS, that for week 6 the median sum of squared residuals of all subjects is decreased by 8.05%. However, for weeks 2 to 5 the median value of %RSS is negative, indicating that the sum of squared residuals is greater for the static calibration compared to the default calibration. The two performance metrics do not show a consistent pattern of accuracy improvement for all weekly sets of data. Nevertheless, the focus of this article is to evaluate the augmentation of the internal calibration algorithm with the weekly updating feature. Since the details of the calibration mechanism employed by commercial CGM are unknown, the proposed calibration algorithm can be considered as an acceptable alternative to default calibration that can be used for the evaluation of the week-to-week updating schemes. The performance of the static calibration is presented in Figure 5 and compared to the default CGM for an exemplar subject. For this particular subject the %RSS is computed to be −8.6%.
Performance Metrics: Comparison Between Default CGM Calibration and Proposed Static Calibration.
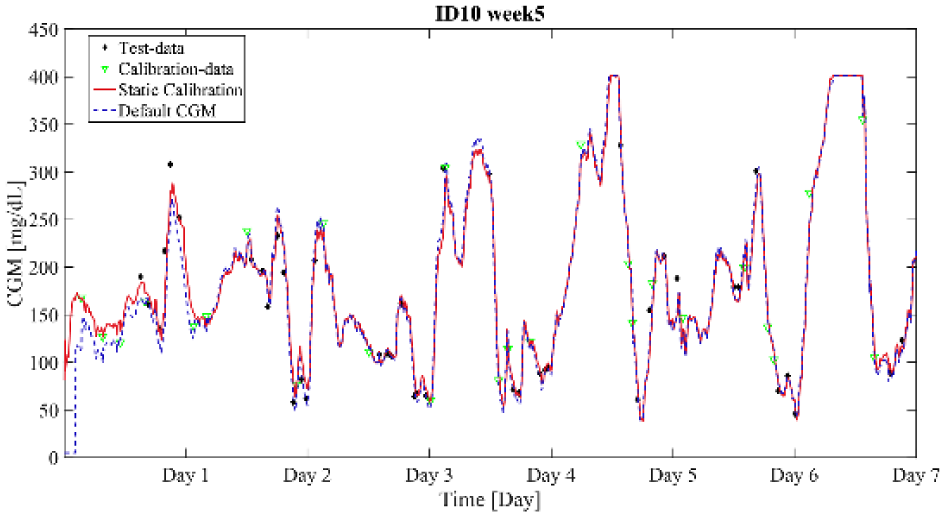
Default calibration versus static calibration for adult no. 10 during week 5. The %RSS is computed to −8.6%.
The performance of the calibration algorithm augmented with the three weekly updating schemes is compared to the static calibration, and presented in Figure 6. As depicted from the figure, the reduction in sum of square residuals for all schemes is apparent even after one week of implementation, with %RSS ranging from 4.63% to 5.45%. Scheme 1 that uses all past calibration data shows a continuous reduction of %RSS that is maintained across the continuous weeks of use between 0.65 and 5.45%. Scheme 2 does not show the same improvement in %RSS as scheme 1 at week 6, with %RSS being −0.99% compared to 0.65% for scheme 1. This leads to the conclusion that using a window of four consecutive weeks of data (weeks 2, 3, 4, and 5) gives better parameter estimates than when using 3 weeks of data. However, to strengthen this conclusion further studies using more weeks of data are required to determine the optimal window length. Typically, a window of 4 weeks of consecutive CGM use will consist of a well distributed SMBG dataset.
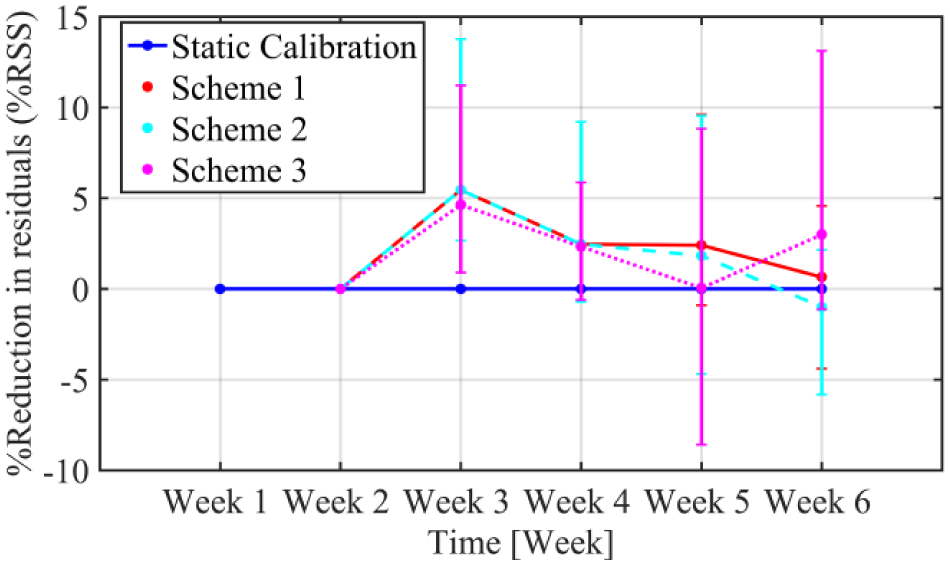
Improvements in percentage reduction of sum of squared residuals (%RSS) over successive weeks of use in terms of median (IQR) static calibration (blue line) versus the three updating schemes, normalized by residuals of the static calibration.
The effect of the quality of the dataset on the parameter estimates is more pronounced for scheme 3 as demonstrated in Figure 6. Although, an initial reduction of 4.63% in %RSS is observed for the first week of implementation, the following weeks the improvement is not consistent and further iteration of the algorithm actually decreased the sensor performance, as for example in week 5 that static calibration outperformed scheme 3 for 50% of the subjects. The median RMSE at week 6 for calibration with scheme 1 is reduced to 29.87 mg/dL compared to scheme 2 with RMSE 30.38 mg/dL and scheme 3 with median RMSE 32.72 mg/dL. While MAD for the same week is reduced from 25.62 mg/dL for scheme 3 to 23.99 mg/dL for scheme 2 and to 23.57 mg/dL for scheme 1.
From Figure 6, we can conclude that scheme 1 presents a consistent reduction in the sum of square residuals for all evaluated weeks. In the rest of the article, we will only consider scheme 1 as the weekly updating scheme. It should be emphasized that scheme 1 is chosen for the particular data set. When more weeks of continuous CGM use are considered, instead of using all-prior data, a moving window with an optimally defined length should be used. In this way, the effect of long-term or seasonal changes in the physiology that could reduce the algorithm’s learning ability is restricted.
Figure 7 presents a boxplot representation of the distribution of RMSE computed on the test-set for separate segments of the week for the default CGM, the static calibration and the weekly-updating calibration with scheme 1. The RMSE distributions are calculated for all subjects and all weeks (except week 1). As demonstrated in the figure, for days 1-3, the weekly-updating feature (median RMSE = 36.98 mg/dL) improves the accuracy of the sensor when compared to the default calibration (median RMSE = 43.37 mg/dL, P value = .34) but not for the static calibration (median RMSE = 36.10 mg/dL, P value = .88). In days 2-4 and 3-5, the weekly-updating calibration augmented with scheme 1 demonstrates a decrease in median RMSE compared to the default CGM, by approximately 1.4 mg/dL and 2.7 mg/dL respectively. However, for these segments of the week the RMSE distributions of static and weekly-updating calibration are similar. The same profile is observed for days 4-6 and 5-7, where the weekly updating calibration presents a slight improvement over the static calibration, with the median RMSE being reduced by 2.5 and 0.3 mg/dL respectively.
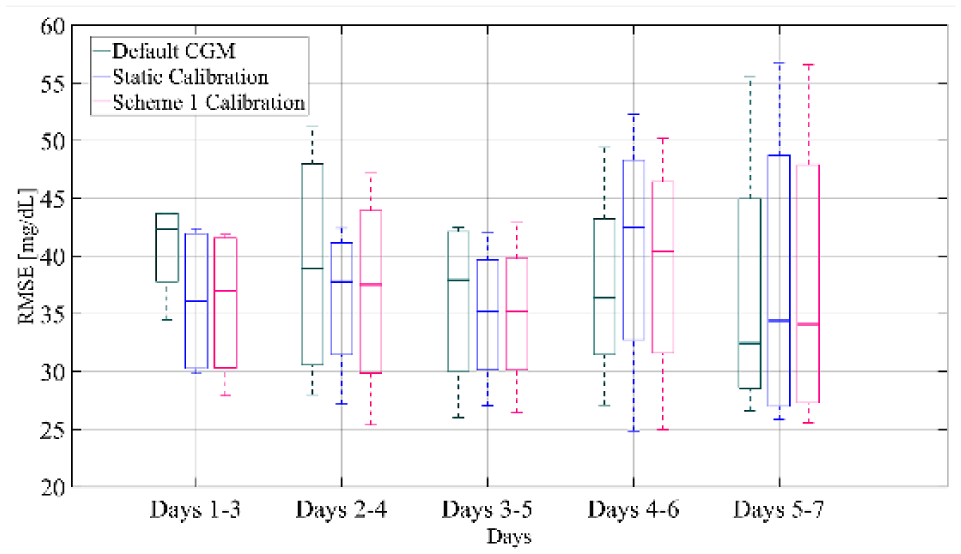
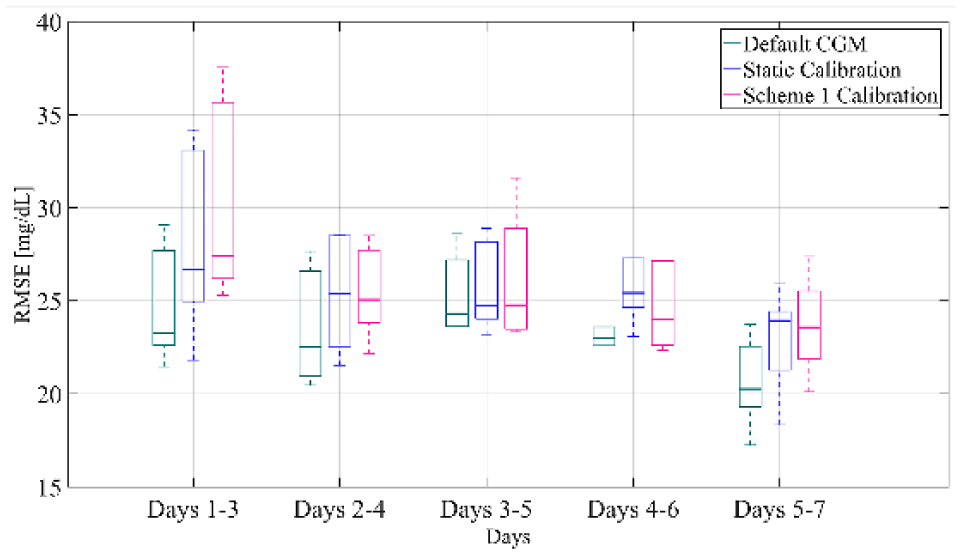
Box-and-whisker plot representation of RMSE distribution over all subjects and all weeks of the training set computed for separate segments of the week for the default CGM, the static calibration and calibration augmented with Scheme 1.
Validation of the Proposed Method
In this dataset, it was noticed that for some subjects there had been a sensor failure before the end of a week and therefore the sensor had to be replaced. For these cases, the parameter w in equation 6 was not updated and the BG data points for the particular segment of the week had the same weight as the previous week’s data points. For a fair comparison of the alternative calibration mechanisms for all subjects, these segments of the week are excluded and only full weeks are considered in the comparison study. Figure 8 presents the boxplot representation of the RMSE distribution over all subjects and all weeks computed for the test-set data pairs for separate segments of the weeks. We can deduct that over all weeks and all subjects days 1-3 after sensor insertion demonstrate a slight increased median RMSE for scheme 1 calibration (27.40 mg/dL) compared to static calibration (26.70 mg/dL, P value = .34). On the contrary, in days 2-4 and 3-5 RMSE presents similar distributions for the static and the weekly updating calibration. However, for days 4-6 after sensor insertion, the median RMSE of calibration with scheme 1 is 23.99 mg/dL compared to 25.43 mg/dL (P value = .88) for static calibration, while for days 5-7, the median RMSE is reduced to 23.57 mg/dL from 23.94 mg/dL (P value = .88) with static calibration.
Box-and-whisker plot representation of RMSE distribution over all subjects and all weeks of the validation set computed for separate segments of the week for the default CGM, the static calibration and calibration augmented with Scheme 1.
In conclusion, Figure 9 shows the comparison of RMSE distribution between default CGM, static calibration and calibration with scheme 1 for each week. It can be seen that after week 2 there is a consistent improvement in RMSE for the weekly updating calibration compared to the static calibration. In more detail, the median RMSE of the weakly updating feature for all subjects decreases by 1.89 mg/dL for week 3, by 1.15 mg/dL for week 4, while weeks 5 and 6 present a reduction of 0.49 and 0.52 mg/dL, respectively. It should also be noted that the results are comparable to the default CGM, except for week 5, since the proposed method based on the available data could not capture the sensor performance. Nonetheless, this analysis indicates that the updating of the calibration parameters can improve the accuracy of the CGM over consecutive weeks of use.
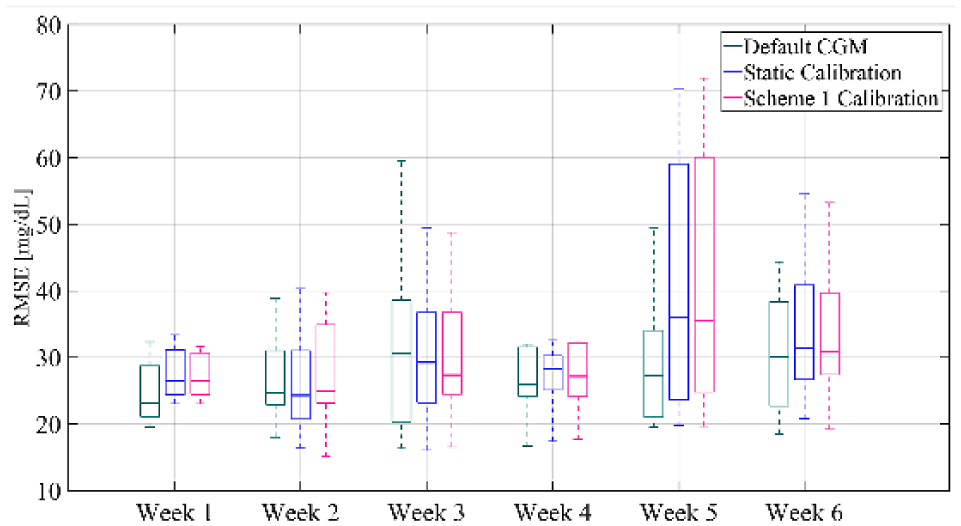
Box-and-whisker plot representation of RMSE distribution averaged over all subjects of the validation set and computed for each week for the default CGM, the static calibration and calibration augmented with Scheme 1.
Discussion
Improving the accuracy of CGM is very important for diabetes care in general, as well as for the performance of artificial pancreas technology that may rely exclusively on the CGM for insulin dosing.
Our design aims to improve the accuracy of current CGM sensors by leveraging information that is collected progressively over consecutive CGM use. Unlike studies on sensor accuracy reported in the literature where data sets are collected under supervised settings and at frequent time points,11,12,31 the design of this particular study was not intended to evaluate the sensor accuracy. Therefore, the data points collected and used by the proposed algorithm are available during standard CGM use; that is, SMBG calibration points required by the users for satisfactory sensor operation. This, however, can lead to high variability in the number and quality of calibration points collected by the users. Since there are usually few calibration data points per week, it is important to evaluate the distribution of available SMBG data that will be used for parameter estimation; obtaining parameter estimates based on sampling data that is biased for example toward hyperglycemia will not provide reliable parameter values to initialize the calibration process of the following week. Therefore, the sampling scheme selected, is not only a function of the number of consecutive weeks but also a function of the level of adequate data representation. Hence, datasets with varying window lengths can be chosen based on the variance of the calibration data obtained at each consecutive week. A longer study is thus required to evaluate the efficacy of the proposed method.Another factor that could have restricted the effect of the updating feature on the performance of the CGM is the calibration mechanism itself. The sensor calibration method performed by commercial CGM is proprietary, and therefore completely unknown. This implies that the selected calibration model and/or calibration mechanism may differ significantly from the underlying in the default CGM. Even though the static calibration demonstrated similar performance to the default CGM, the updating feature did not perform significantly better than the static calibration. However, we strongly believe that using past data to identify individual calibration parameters will improve the sensor accuracy over time. Therefore, if the proposed method is applied and further tailored to the specifics of the default calibration method then we can investigate directly its impact on the sensor accuracy without being constrained by errors occurring due to the intermediate step of static calibration.
Conclusions
Accurate CGM performance is of paramount importance for people with T1DM to achieve better glycemic control. The proposed algorithm uses weekly sets of calibration data to identify individual sensor calibration parameters to ultimately improve sensor accuracy over time. Although the results presented in this work do not show statistically significant improvement, the use of information of past calibration data collected on a weekly basis to estimate the calibration model parameters showed a positive trend toward reducing the weekly RMSE when compared to a static calibration algorithm. Using data points that are collected in an outpatient setting entails the challenge of biased and infrequent sampling that can restrict the performance of the developed algorithms. A dataset comprising of longer duration of continuous CGM use and respective SMBG points is necessary to identify the benefits of using updating features to improve CGM performance over time.
Footnotes
Acknowledgements
The authors would like to thank Dr Sunil Deshpande and Dr Ankush Chakrabarty (Harvard John A. Paulson School of Engineering and Applied Sciences, Harvard University) for fruitful discussions, and Tyler Jean and Dr Wendy C. Bevier for helping to collect clinical data (William Sansum Diabetes Center).
Abbreviations
AP, artificial pancreas; BG, blood glucose; CGM, continuous glucose monitoring; IQR, interquartile range; MARD, mean absolute relative difference; RMSE, root mean square error; MAD, mean absolute difference; SMBG, self-monitoring blood glucose; T1DM, type 1 diabetes mellitus.
Declaration of Conflicting Interests
The author(s) declared no potential conflicts of interest with respect to the research, authorship, and/or publication of this article.
Funding
The author(s) disclosed receipt of the following financial support for the research, authorship, and/or publication of this article: This work was supported by the JDRF grant SRA-2016-147 and National Institutes of Health grant DP3DK104057. Product support was provided by Dexcom, Inc, and the Investigator-Initiated Study Program of LifeScan, Inc.