
Abstract
Background:
Insulin degludec (IDeg) has significantly lower day-to-day and within-day variability compared to insulin glargine (IGlar) 100U/mL (U100) and 300U/mL (U300). Here, we report post hoc assessments to confirm the robustness of these observations while accounting for potential experimental confounders.
Methods:
Two euglycemic clamp studies in type 1 diabetes patients, comparing IDeg to IGlar-U100 (Study A, parallel design, 54 patients; Study B, crossover, 22 patients) and one study comparing IDeg to IGlar-U300 (Study C, crossover, 57 patients), all dosed at 0.4U/kg, were evaluated. Pharmacodynamic parameters were assessed at steady state from glucose infusion rate (GIR) profiles following three 24-hour euglycemic clamps in Studies A (162 clamps) and C (342 clamps), and one 42-hour clamp in Study B (44 clamps).
Results:
Pooled data (Studies A and B) showed that IDeg had an even distribution of glucose-lowering effect over the 24-hour dosing interval that was consistent with Study C. IGlar-U100 showed a constant decrease in glucose-lowering effect over 24 hours while IGlar-U300 had a lower effect in the middle of the dosing interval (6-18 hours). Relative within-day variability of IDeg was 40% and 37% lower than IGlar-U100 and -U300, respectively. Exclusion of profiles with low response in Study C (19/342 clamps) did not impact the difference in the distribution of glucose-lowering effect or within-day variability. Day-to-day variability was significantly lower with IDeg compared to IGlar-U100 and -U300 based on smoothed and unsmoothed GIR data.
Conclusions:
Significantly lower relative within-day and day-to-day variability was confirmed irrespective of experimental considerations for IDeg compared to IGlar-U100 and IGlar-U300.
Pharmacodynamic profiles of basal insulins should ideally be flat and peakless, that is, they should be characterized by low variability in absorption. 1 The term “variability” is often used ambiguously referring to both day-to-day and within-day variability. Low day-to-day variability allows reproducible glucose-lowering effect between daily injections, while low within-day variability produces a consistent glucose-lowering effect during a 24-hour dosing interval. Low day-to-day variability and low within-day variability are both key parameters in ensuring predictable blood glucose (BG) control and a low risk of hypoglycemia in patients with diabetes. 1
The pharmacodynamic effect of basal insulins is largely dependent on their duration of action and mechanism of protraction.2,3 It has been established that the long acting basal insulin, insulin degludec (IDeg) and insulin glargine, up-concentrated to 300 U/mL (IGlar-U300) have a more even pharmacodynamic profile compared to insulin glargine 100 U/mL (U100).4-7 IDeg has lower day-to-day and within-day variability compared to both concentrations of IGlar, U100 and U300.4-6 This observation could potentially be due to the differences in the modes of protraction between the insulins. Upon subcutaneous injection, IGlar forms microprecipitates that need to be redissolved before absorption, whereas IDeg forms long multihexamers that create a soluble depot from which IDeg monomers are released into the circulation slowly and steadily.3,8-10
Very few studies comparing the day-to-day and within-day variability of long-acting insulins have been published, thus far. As it is important to understand the impact of methodological details in studies investigating pharmacodynamic variability, we present here post hoc assessments from three studies in type 1 diabetes (T1D) patients comparing pharmacodynamic parameters between IDeg and both IGlar-U100 and -U300, while discussing potential confounders that could influence the outcomes.
Methods
Study Design
Clinical pharmacology studies investigating the pharmacodynamic properties of IDeg and IGlar, namely Study A (IDeg vs IGlar-U100, NCT00961324 4 ), Study B (IDeg vs IGlar-U100, NCT011145426), and Study C (IDeg vs IGlar-U300, NCT02536859 5 ) are included. Key study design features are presented in Table 1. All studies were conducted at Profil (Neuss, Germany) and sponsored by Novo Nordisk A/S (Bagsvaerd, Denmark).
Overview of Studies Included.
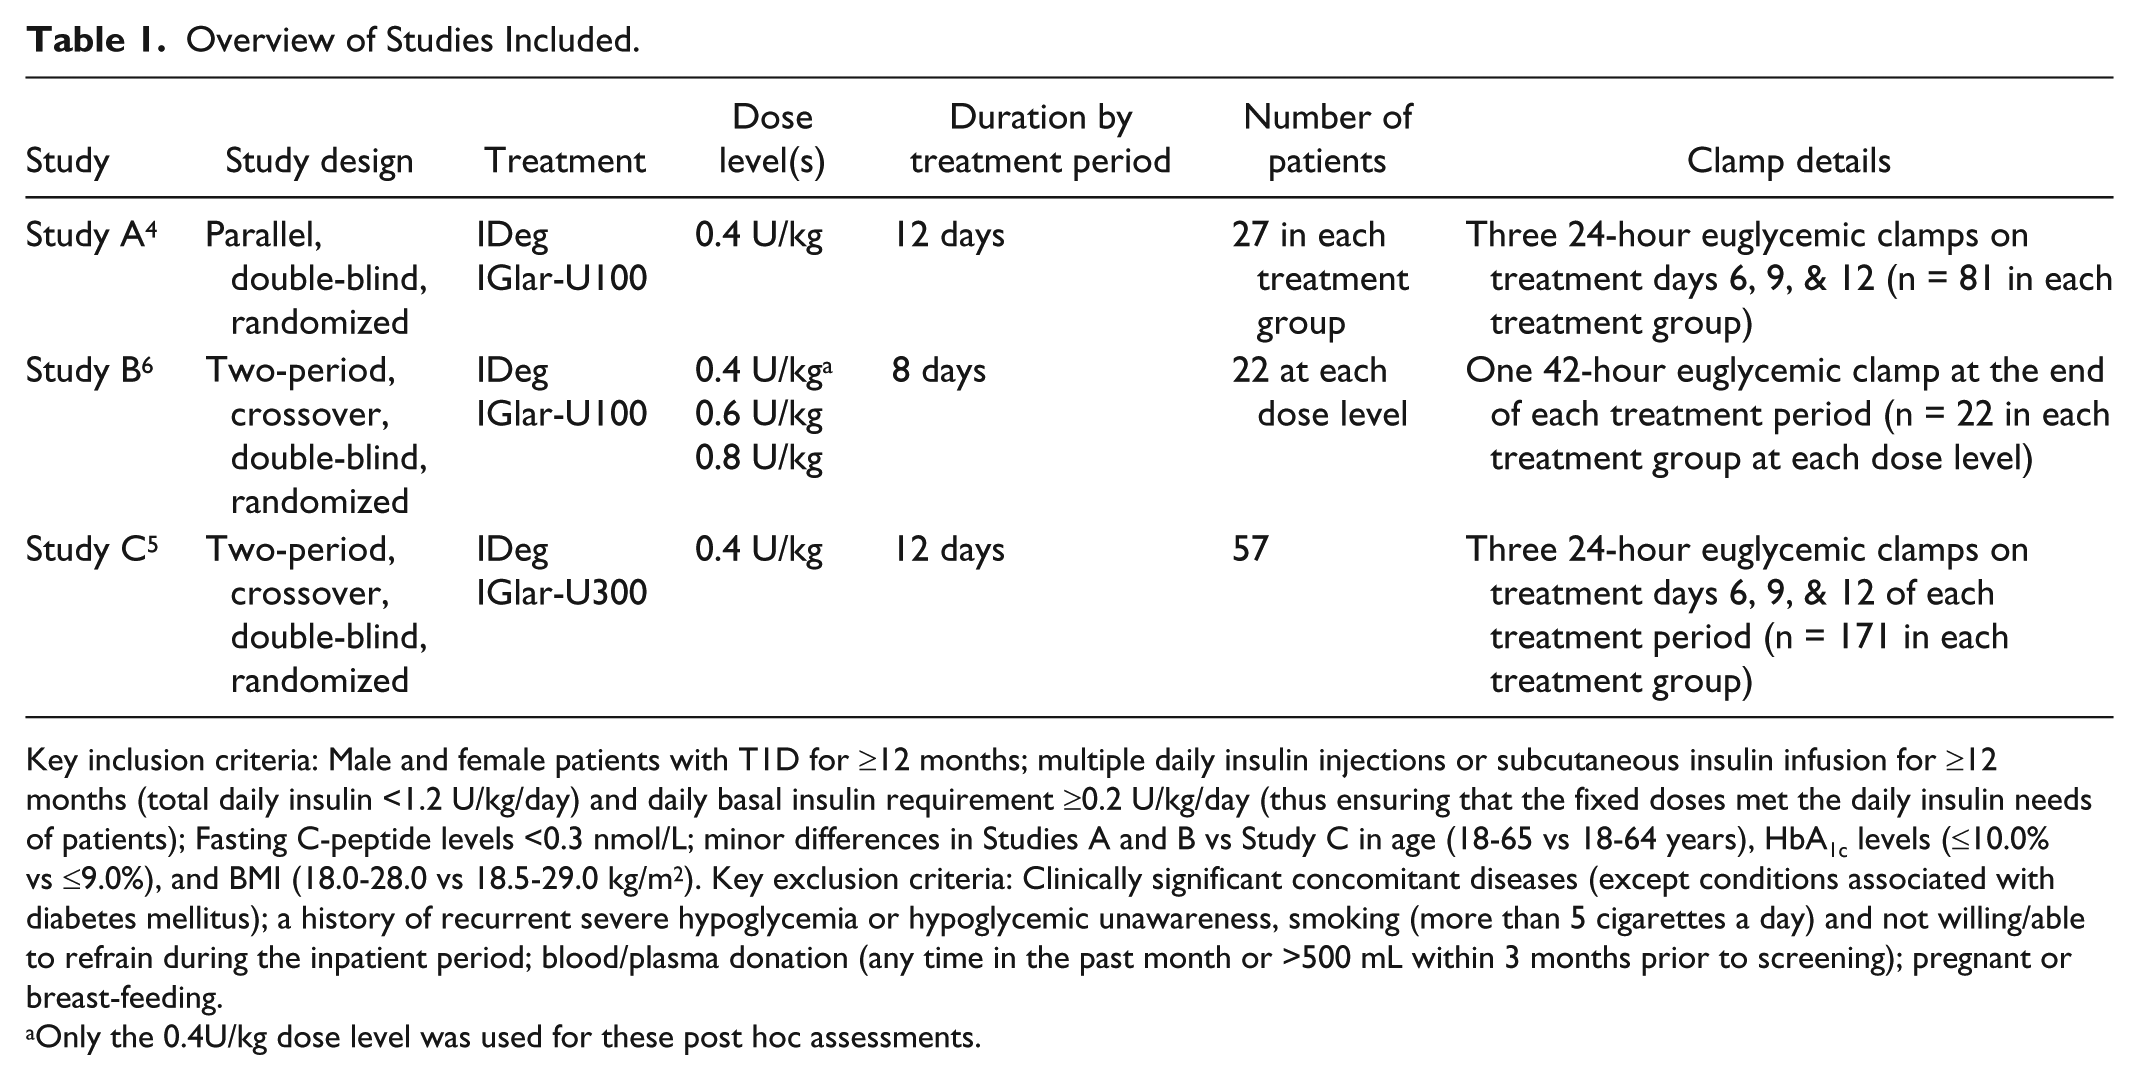
Key inclusion criteria: Male and female patients with T1D for ≥12 months; multiple daily insulin injections or subcutaneous insulin infusion for ≥12 months (total daily insulin <1.2 U/kg/day) and daily basal insulin requirement ≥0.2 U/kg/day (thus ensuring that the fixed doses met the daily insulin needs of patients); Fasting C-peptide levels <0.3 nmol/L; minor differences in Studies A and B vs Study C in age (18-65 vs 18-64 years), HbA1c levels (≤10.0% vs ≤9.0%), and BMI (18.0-28.0 vs 18.5-29.0 kg/m2). Key exclusion criteria: Clinically significant concomitant diseases (except conditions associated with diabetes mellitus); a history of recurrent severe hypoglycemia or hypoglycemic unawareness, smoking (more than 5 cigarettes a day) and not willing/able to refrain during the inpatient period; blood/plasma donation (any time in the past month or >500 mL within 3 months prior to screening); pregnant or breast-feeding.
Only the 0.4U/kg dose level was used for these post hoc assessments.
Patients
The inclusion and exclusion criteria employed in all trials were similar (Table 1).4-6
Treatment Administration
Patients were randomized to IDeg (Tresiba®, Novo Nordisk, Bagsvaerd, Denmark) or IGlar-U100/-U300 (Lantus®/Toujeo®, Sanofi, Frankfurt, Germany) once-daily for 8 days in Study B or 12 days in Studies A and C (Table 1). In Studies B and C, the first treatment period was followed by a complete crossover to the other treatment during the second treatment period with a washout period of 7-21 days between treatments. Patients in all treatment groups received a fixed dose of 0.4 U/kg and all injections were administered subcutaneously at 8:00
Clamp Procedure
Automated euglycemic clamps were used to assess pharmacodynamic endpoints. Studies A and B were conducted using Biostator® (MTB Medizintechnik, Amstetten, Germany), while Study C employed ClampArt® (Profil, Neuss, Germany). Patients, arriving at the site in a fasting state, received a variable intravenous infusion of human soluble insulin (15 IU Actrapid® [100 IU/mL, Novo Nordisk, Bagsvaerd, Denmark] in 49 mL saline and 1 mL of the patients’ blood) or glucose to obtain the target BG (5.5 mmol/L [100 mg/dL]), approximately 5 hours before trial product administration on clamp days. The clamp procedure continued for 24 hours (Studies A and C) or 42 hours (Study B) postdosing and glucose infusion rate (GIR) was recorded every minute. Premature termination of the clamp ensued if BG exceeded 13.9 mmol/L (250 mg/dL, Studies A and B) or 11.1 mmol/L (200 mg/dL, Study C) without glucose infusion for at least 30 minutes.
Assessments
GIR and BG concentrations were measured for every euglycemic clamp on Days 6, 9, and 12 for Studies A and C and on Day 8 for Study B, that is, at steady state. The distribution of glucose-lowering effect (area under the GIR curve [AUCGIR,SS] as a proportion of AUCGIR,τ,SS, where τ = 0-24 hours) across 6-hour intervals, and relative within-day variability (AUCFGIR,τ,SS as a percentage of AUCGIR,τ,SS) were evaluated from all three studies. Day-to-day variability was estimated using within-patient variance for AUCGIR,τ,SS in Studies A and C.
Statistical Methods
The standard locally weighted scatterplot smoothing (LOESS) procedure, with smoothing factors of 0.25 (Studies A and C) and 0.15 (Study B), was applied to individual GIR curves. AUCGIR,τ,SS from each clamp was calculated using the trapezoidal technique on interpolated points. Statistical methods related to the distribution of glucose-lowering effect, within-day and day-to-day variability were published previously.4-6 In addition to individual analyses from each study, data were pooled for the 2 studies comparing IDeg and IGlar-U100 (Studies A and B) to evaluate the distribution of glucose-lowering effect and within-day variability. Absolute within-day variability was calculated as cumulated AUCs of an individual’s GIR profile above and below the mean GIR over 24 hours (AUCFGIR,τ,SS) for each clamp. Relative within-day variability (AUCFGIR,τ,SS as percentage of the AUCGIR,τ,SS) rather than absolute was assessed to account for any potential differences in potency between IDeg and IGlar.5,11 The geometric means of relative fluctuation from all clamps in each treatment were compared between IDeg and IGlar using a multiplicative linear mixed effect model with treatment as fixed effect and patient as random effect when analyzing data from the Study A. The model was further adjusted for period effect when analyzing data from the crossover Studies B and C. Subsequently, a pooled analysis of relative fluctuations was performed using a multiplicative linear mixed effect model with treatment and trial as a fixed effects and patient as a random effect.
Sensitivity Analyses
Sensitivity analyses were conducted excluding patient profiles with low response where the fixed dose of 0.4 U/kg appeared to be insufficient to satisfy individual insulin requirements. These low response profiles were defined as clamps with elevated BG levels >7 mmol/L and no GIR for the majority of the 24-hour clamp period, irrespective of the randomized treatment.
Day-to-day variability was estimated using unsmoothed GIR data from Studies A and C to rule out the impact of the smoothing procedure as an additional sensitivity analysis.
Results
Patients
The number of patients and clamps contributing to the analyses in each study are reported in Table 1. Demographics and baseline characteristics of all patients were comparable.4-6
In Study A, 8/162 clamps from 6 patients receiving IGlar-U100 showed low response, while in Study B only 1 patient receiving IGlar-U100 with low response was identified.
In Study C, 19/342 clamps from 14 patients showed low response and these occurred only in patients receiving IGlar-U300. Further investigations showed that the mean (min-max) insulin infusion rate, from all clamps, 5 hours prior to study dose administration was nearly twice as high in these patients (0.07 [0.0-2.0]) compared to the remaining patients randomized to IGlar-U300 (0.04 [0.0-2.4]) and more than 3-fold higher than in those receiving IDeg (0.02 [0.0-2.3]). Correspondingly, the basal insulin dose at screening was also higher for patients experiencing low response compared to the rest of the patients (0.35 U/kg vs 0.31 U/kg).
Distribution of Glucose-Lowering Effect
IDeg had a flat and even distribution of glucose-lowering effect consistently seen in pooled data from Studies A and B (IDeg vs IGlar U-100; Figure 1a) and Study C (IDeg vs IGlar-U300; Figure 1b).
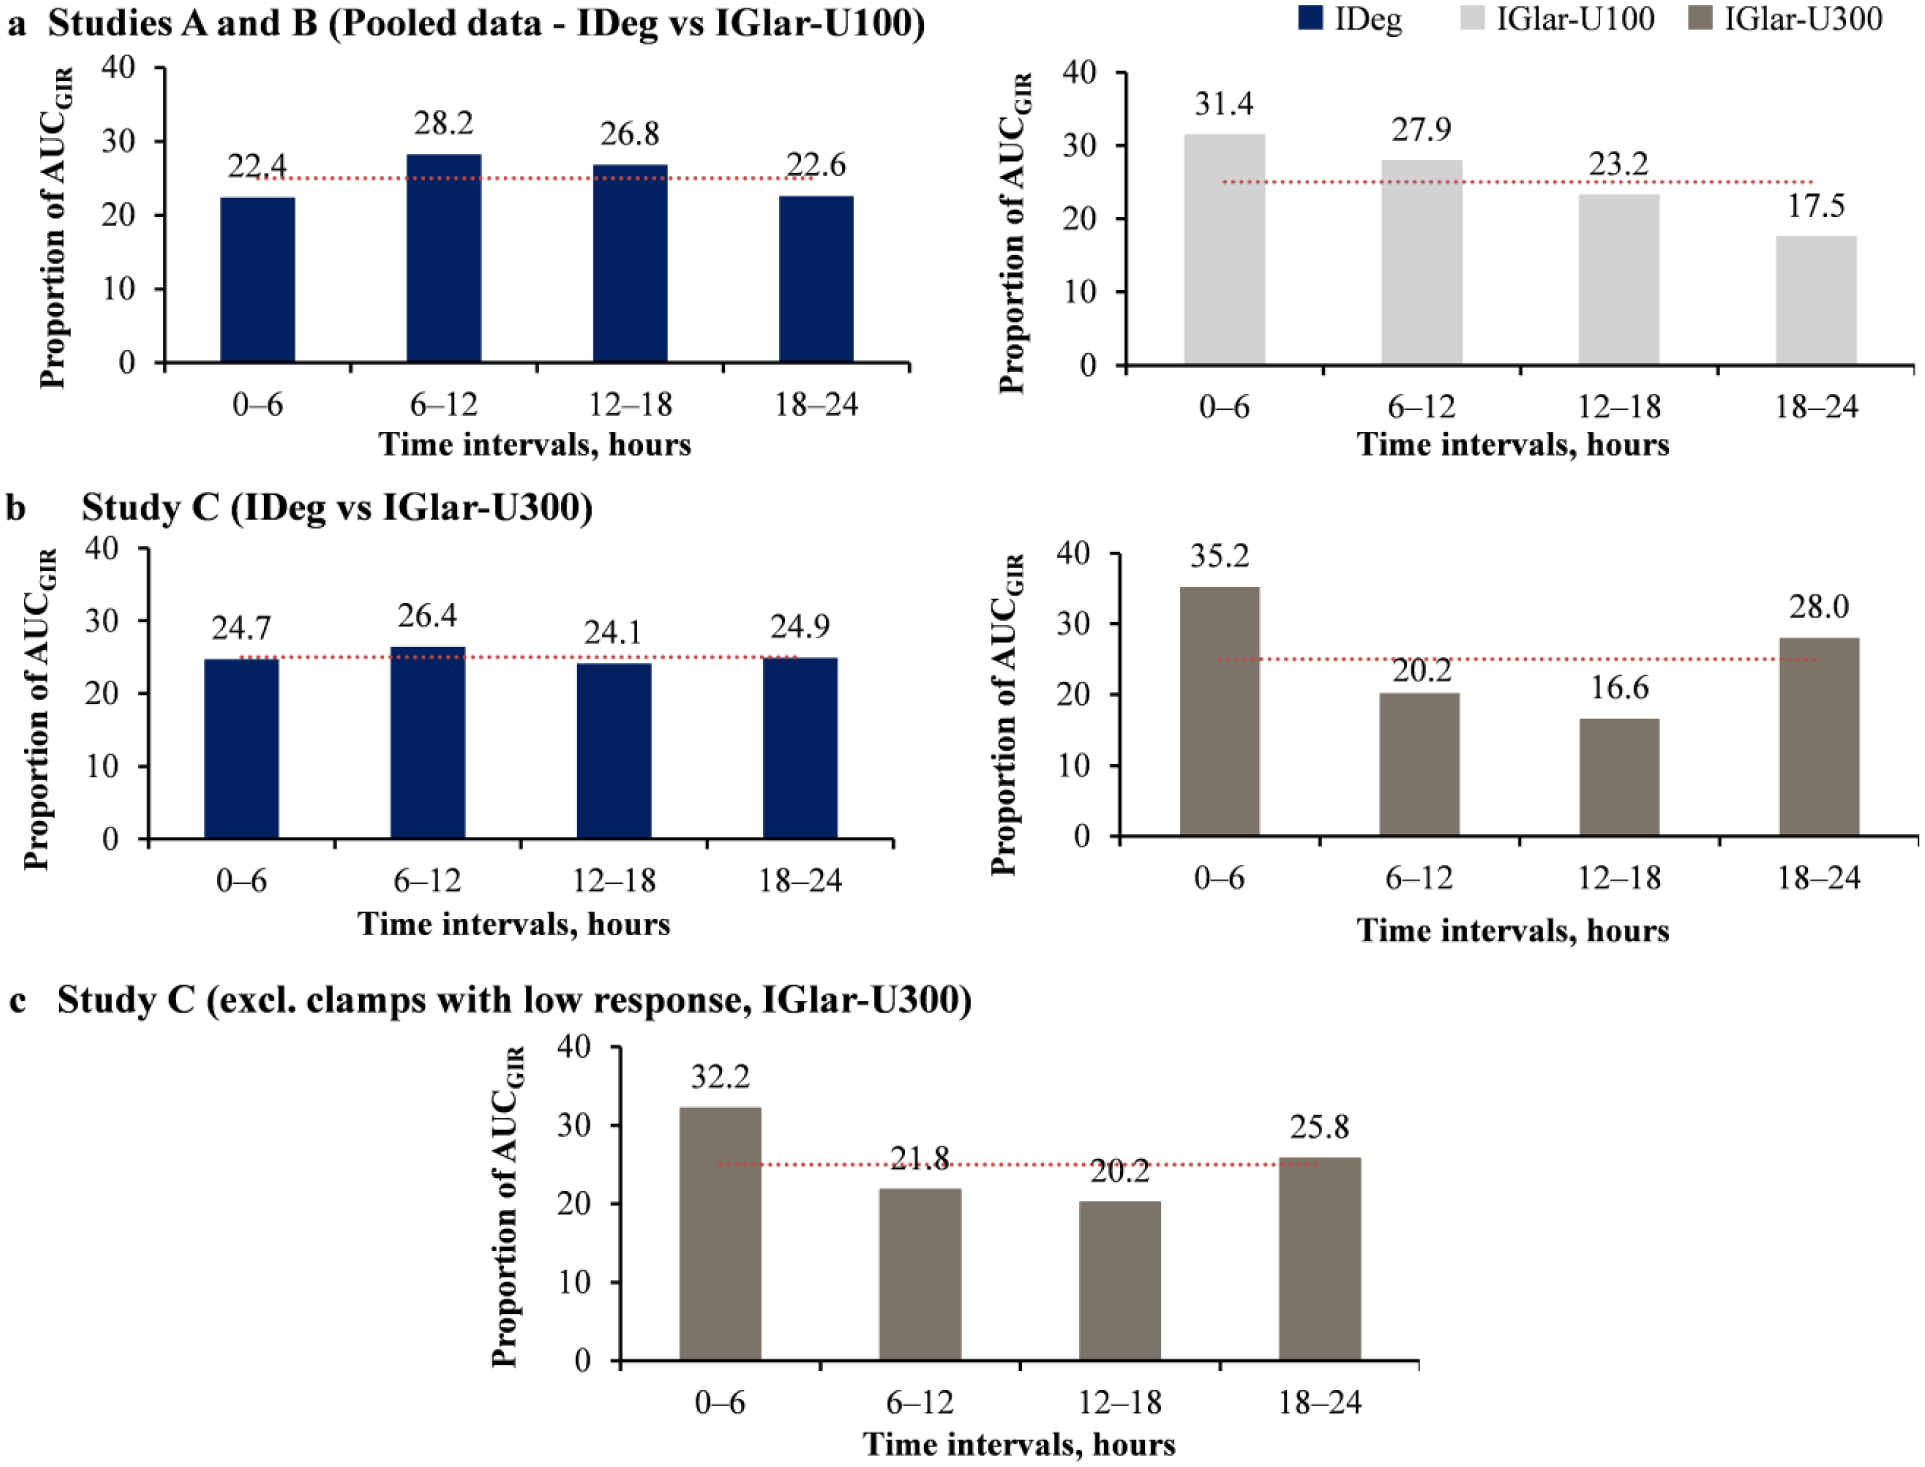
Distribution of glucose-lowering effect with IDeg compared to IGlar-U100 and -U300 at a dose level of 0.4 U/kg. (a) Pooled data from Studies A and B (IDeg vs IGlar-U100). (b) Data from Study C (IDeg vs IGlar-U300) previously published. 5 (c) Data from Study C (IDeg vs IGlar-U300), excluding 19 clamps 14 patients having low response while receiving IGlar-U300; No clamps with low response were seen following IDeg treatment.
In contrast, the pooled glucose-lowering effect of IGlar-U100 decreased over time with the lowest effect seen in the 18- to 24-hour interval (Figure 1a). In Study C, IGlar-U300 displayed a U-shaped distribution with greater glucose-lowering effect in the first and last 6-hour intervals compared to the 6- to 12-hour and 12- to 18-hour intervals (Figure 1b).
There was no impact on the distribution of glucose-lowering effect following exclusion of 19/342 clamps with low response in Study C (Figure 1c).
Within-Day Variability in Glucose-Lowering Effect
Relative within-day variability was significantly lower for IDeg compared to IGlar-U100 in Studies A and B (Figure 2). The pooled analysis from Studies A and B, showed that relative within-day variability was 40% lower with IDeg than IGlar-U100 (Figure 2). In Study C, relative within-day variability was 37% lower with IDeg compared to IGlar-U300 (Figure 2). 5
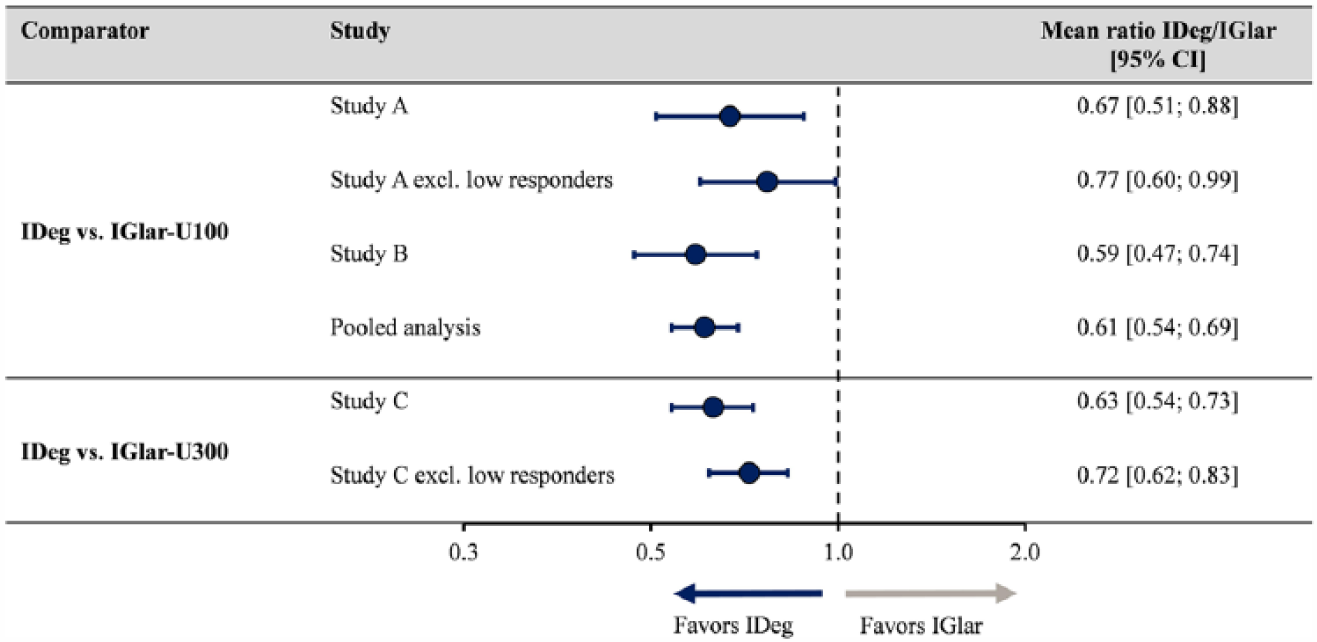
Relative within-day variability with IDeg compared to IGlar at a dose level of 0.4 U/kg. P ≤ .05 for all ratios. Only 1 patient had low response in Study B; hence, a sensitivity analyses was not conducted. Pooled analysis includes data from all patients in Studies A and B.
The significant difference in within-day variability was unaltered when the clamps with a low response were excluded from the analysis (Figure 2).
Day-to-Day Variability in Glucose-Lowering Effect
Day-to-day variability based on unsmoothed data was significantly lower with IDeg compared to both IGlar-100 and IGlar-U300 in Studies A and C, respectively. These results are comparable with the already published results based on smoothed data (Table 2).
Day-to-Day Variability in Glucose-Lowering Effect.
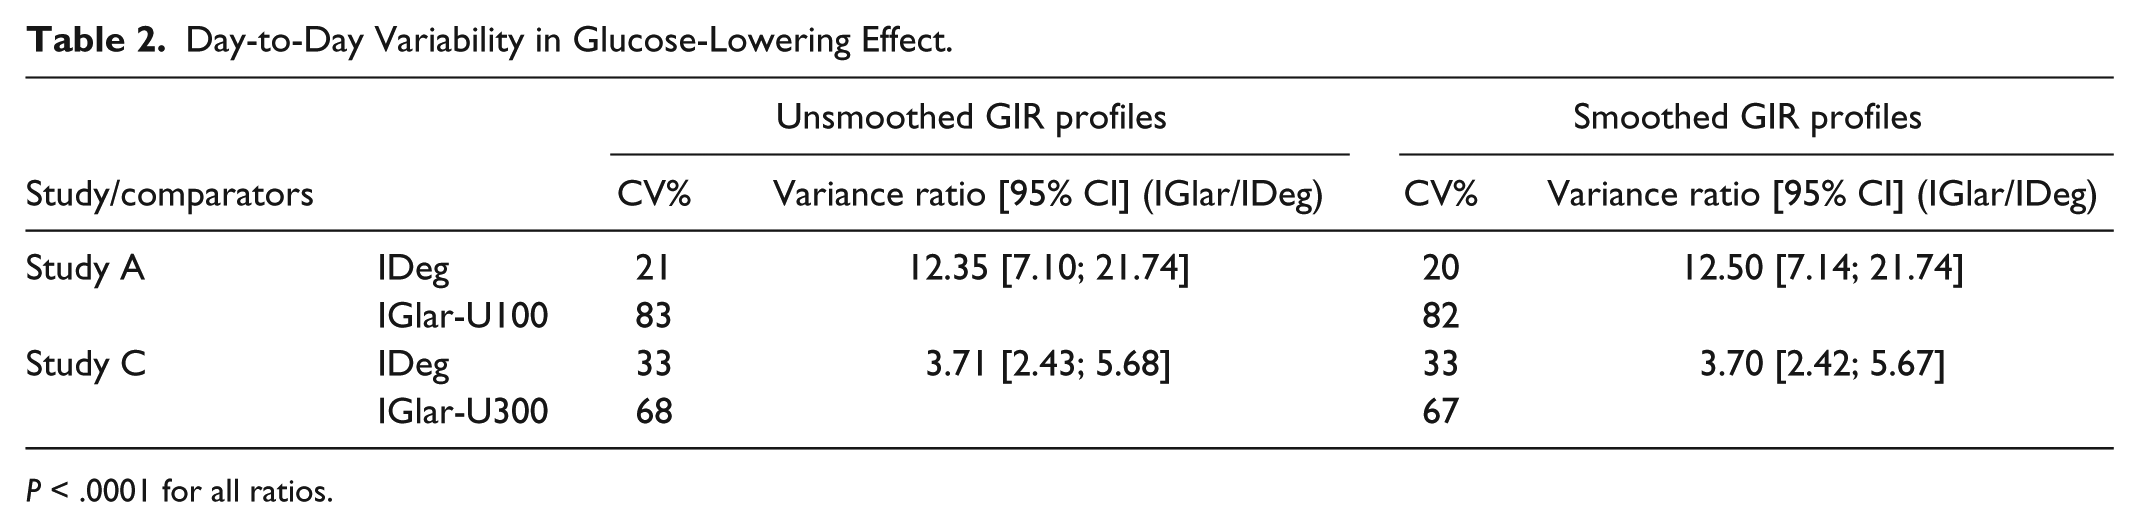
P < .0001 for all ratios.
Day-to-day variability assessed in 2-hour intervals remained low and stable for IDeg in comparison to both IGlar-U100 and -U300. Both concentrations of IGlar showed a period of increased day-to-day variability in the middle of the dosing interval (Figures 3a and 3b).
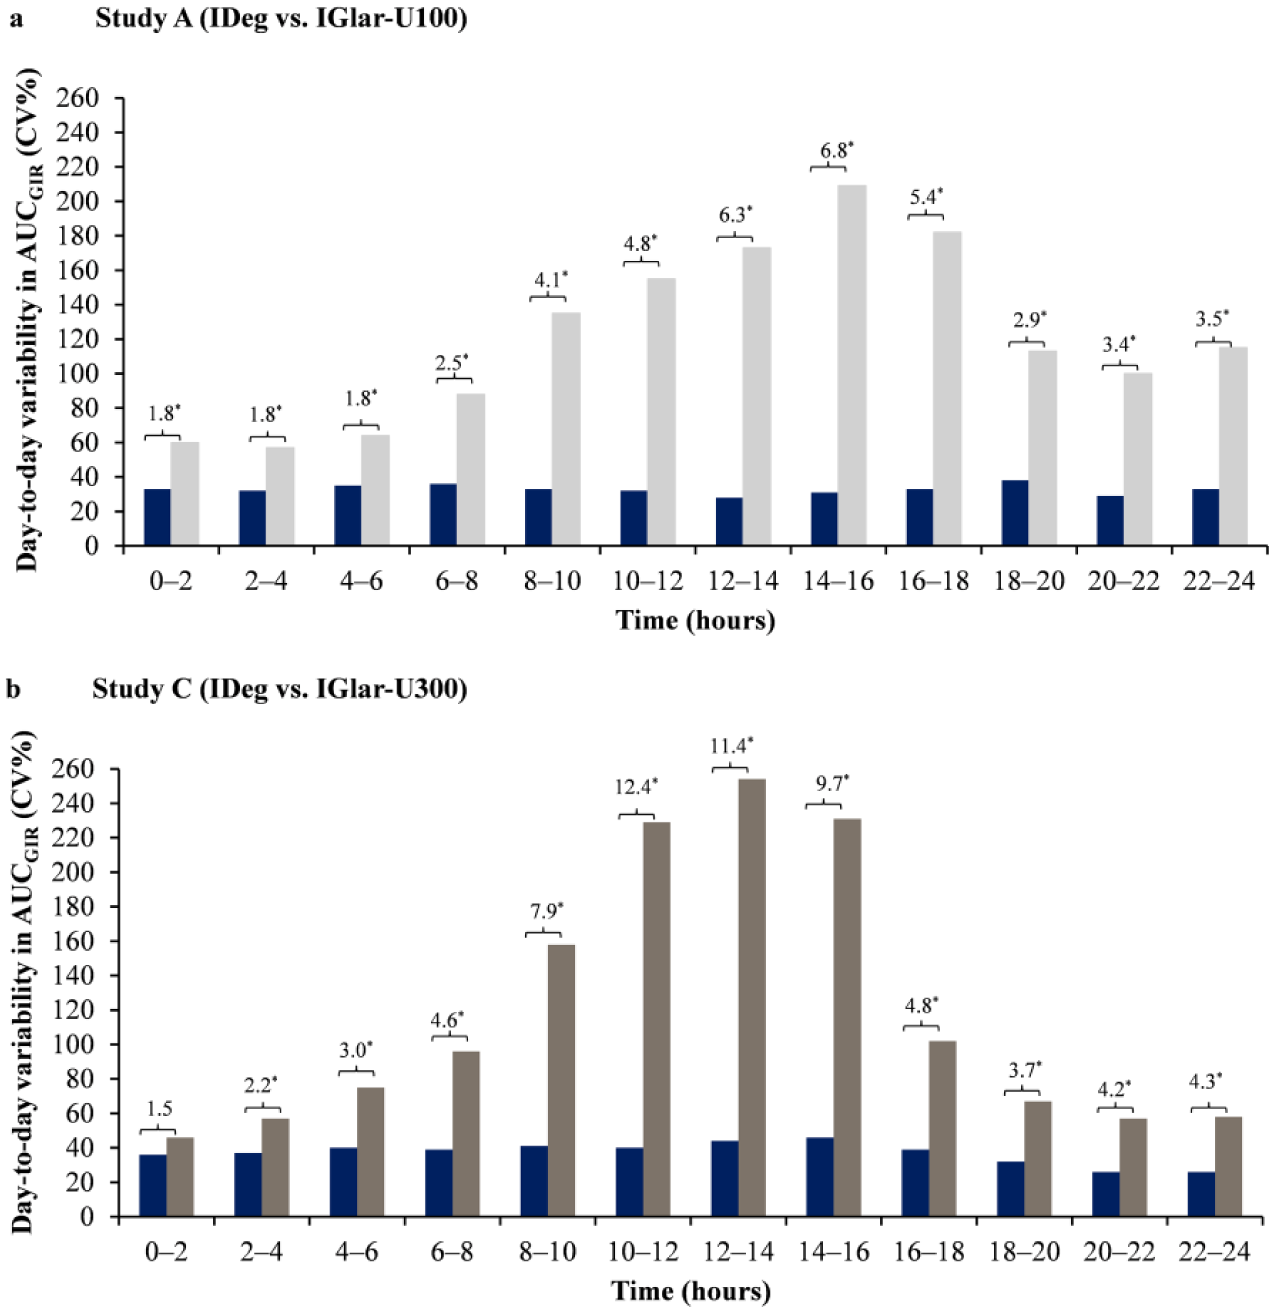
Day-to-day variability in glucose-lowering effect (2-hour intervals) compared to IGlar-U100 and IGlar-U300. *P < .05. Difference between the treatments expressed as variance ratio IGlar/IDeg. Day-to-day variability (AUCGIR) expressed as CV%
Discussion
When assessing pharmacodynamic parameters it is vital that the study design and methods for data handling and analyses can eliminate potential sources of bias as much as possible. If inadequately controlled, these aspects can increase the risk of inaccurate comparisons between two insulins. Post hoc assessments presented here confirm the robustness of previously published findings4-6 that IDeg has significantly lower day-to-day and relative within-day variability in glucose-lowering effect compared to IGlar-U100 and -U300.
Furthermore, IDeg has an evenly distributed glucose-lowering effect over 24 hours observed across all studies, consistent with previous observations including those at higher doses (0.6 and 0.8 U/kg). 6 In contrast, the glucose-lowering effect with IGlar-U100 decreased during the dosing interval, while IGlar-U300 had a U-shaped distribution. As 14 patients showed significantly elevated BG levels when receiving IGlar-U300 during the period of low insulin activity, a sensitivity analysis was conducted excluding these patients from the analysis. The results from the sensitivity analyses concerning distribution of glucose-lowering effect and within-day variability, as well as previously reported day-to-day variability 5 remained unchanged in Study C. Similarly, there was no impact of low response on the significant difference in within-day variability between IDeg and IGlar-U100 in Study A. Sensitivity analyses were not performed for Study B since only 1 patient with low response was identified. The observations from Studies A and C are most likely attributed to the relatively low number of profiles that required exclusion from the analysis. It could be speculated that since glucose infusion was zero for the majority of this period of low response the patient should have received a higher insulin dose to conduct an unbiased comparison. However, a higher dose may not have any impact on the treatment difference since published data indicate that higher doses of IGlar-U100 not only increase the total metabolic effect, but also the level of fluctuations. 6
The distribution of glucose-lowering effect provides information regarding the timing of low or high response, while within-day variability is an indicator of the fluctuation in effect, that is, the “flatness” of the profile across the 24-hour dosing interval. The comparison of absolute within-day variability is difficult if the total glucose-lowering effect (potency) is different between study insulins. Previously, IGlar-U300 has been shown to have a lower potency compared to both IDeg and IGlar-U100 resulting in 10-17% higher basal insulin doses in the EDITION-studies comparing IGlar-U300 with IGlar-U100 in different patient populations.5,11 Therefore, relative rather than absolute within-day variability was estimated between IDeg and IGlar which corrects for differences in potency that would influence the perceived magnitude of fluctuations. Essentially, the relative measurement is equivalent to adjusting for differences observed at baseline among commonly assessed parameters in clinical trials. To exemplify this concept differences in glucose-lowering effect (AUCGIR,τ,SS) between IDeg and IGlar-U300 of varied magnitude are shown from 3 patients in Table 3, with their corresponding effect on absolute and relative within-day variability. These data indicate that a difference in glucose-lowering effect between IDeg and IGlar-U300 is reflected in the relative within-day variability but not in the absolute values. Thus, suggesting that relative within-day variability is more clinically meaningful compared to absolute within-day variability.
Individual Patient Data (Based on a Single Clamp) Reflecting Changes in Absolute and Relative Within-Day Variability Dependent on Differences in Glucose-Lowering Effect.
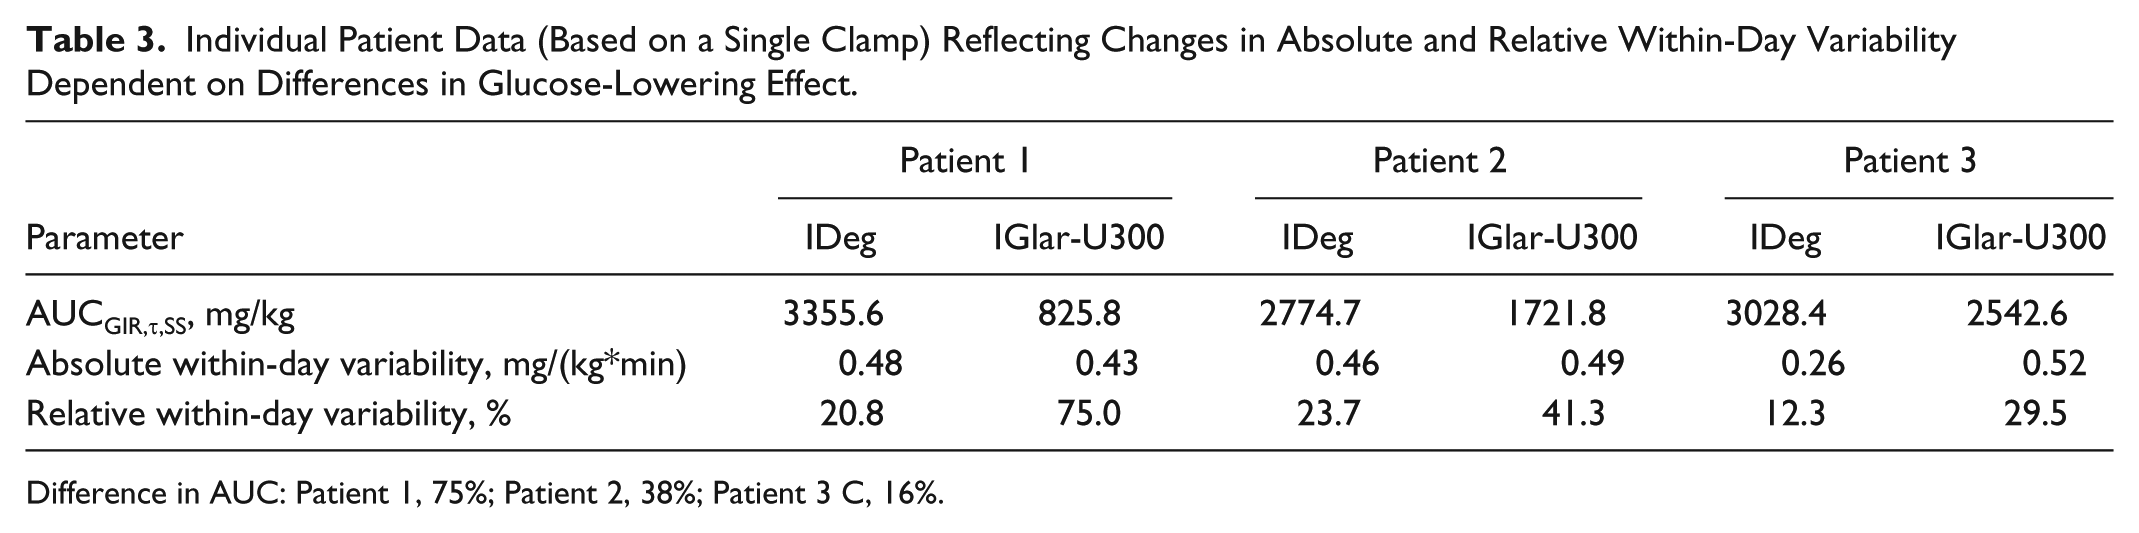
Difference in AUC: Patient 1, 75%; Patient 2, 38%; Patient 3 C, 16%.
The low within-day variability of IDeg was coupled with a significantly lower day-to-day variability than both formulations of IGlar, but the difference was more pronounced versus IGlar-U100 (variance ratio: 12.5) than IGlar-U300 (variance ratio: 3.70). This result is anticipated since IGlar-U300 possesses a longer duration of action compared to IGlar-U100, so the overlapping effects of several injections would reduce variability to some extent. 12 Yet, IGlar-U300 is also rendered inherently variable due to the formation microprecipitates that were found to be larger than those of IGlar-U100.8,10 It is known that subcutaneous injection of suspended particles is affected by particle size. The likelihood of larger particles being retained at the injection site in a smaller volume of solute is higher than that with smaller particles, thus contributing to irregular absorption. 13 Notably, higher day-to-day variability in glucose-lowering effect was observed in the middle of the dosing period for both concentrations of IGlar compared to IDeg.
The three studies described here show robust and reproducible pharmacodynamic differences between IDeg and IGlar. However, one single clamp study conducted in 24 patients recently reported that the glucose-lowering effect of IDeg was lower in the 0- to 6-hour interval compared to the remaining dosing period and its absolute within-day variability was higher compared to IGlar-U300. 14 Although data to fully comprehend the results are currently insufficient, some distinct features could potentially explain these somewhat conflicting differences. Primarily, there were indications of significant BG deviations from the target in both the IDeg and IGlar-U300 groups, especially in the beginning of the dosing interval. 14 It is possible that these deviations could have occurred due to the clamp set-up and/or dose insufficiency in the recruited population which could make assessments challenging, especially during the time BG levels were not on target. In general, the analysis of GIR data relies on the clamp principle, that is, to maintain BG as close as possible to the clamp target. If there are excursions in BG, GIR is zero but the BG effect is underestimated as the deviation is no longer reflected in the GIR calculations. Hence, it is important to present data on clamp quality such as control deviation (mean deviation from the target BG level) and precision (BG fluctuation from the clamp). 15 In our studies, data was derived from two automated clamps, Biostator and ClampArt and while the latter is a more modern device with some advantages, 16 clamp quality was acceptable and most importantly comparable between the treatments in all studies, even when including the low responders. Nevertheless, it is important to investigate the impact of clamps with low GIR response and BG elevations on the overall study outcome. In our analysis exclusion of these clamps had no impact on the overall conclusions, 5 but the outcomes could differ in smaller studies, particularly if the number of patients with BG elevations was significant. Additional factors that drive robust and sound pharmacodynamic investigations are attainment of steady state conditions, homogeneity of the study population and sample size. 17 To address this potential confounder, pooled data were used in this post hoc analysis from two studies employing the same treatment groups to increase the sensitivity of the evaluation.
Another factor for consideration is the dosing time. In our studies, patients were always dosed in the evening compared to the other clamp study
14
in which patients received a morning dose. As our studies were consistent with regard to injection time we could not assess the impact of this potential confounder. It can therefore not be excluded that diurnal changes in individual insulin sensitivity could influence the distribution of glucose-lowering effect over 24 hours; nevertheless, this effect would not impact the comparisons between the treatment groups as it is expected to be similar for all basal insulins. Furthermore, only one study which was done in type 2 diabetes patients claimed an impact of dosing time on GIR profiles.
18
In contrast, studies in T1D patients receiving IGlar suggests that the dosing time (morning [8:00
Finally, the use of LOESS and smoothing factors in relation to pharmacodynamic outcomes has been debated. While the smoothing factor might impact the graphical appearance of the mean GIR-curve, it has minimal impact on the AUCs over a long time period such as 0-6 hours as the areas of the unsmoothed curve below and above the smoothed curve will be almost equally distributed. Accordingly, the significant difference in day-to-day variability between IDeg and IGlar-U300 was similar when smoothed or unsmoothed GIR data were used to estimate AUCGIR,τ,SS. Similar results were also obtained when within-day variability was calculated using unsmoothed GIR data (data not shown).
Conclusions
In conclusion, the previously described lower day-to-day and within-day variability of IDeg compared to IGlar-U100 and IGlar-U300 is a robust finding irrespective of potential methodological confounders associated with clamp studies. These pharmacodynamic characteristics could be advantageous for optimal dose titration leading to attainment of desired glycemic targets with a lower risk of hypoglycemia. Indeed, open-label and double-blinded Phase 3 studies including more than 15 000 patients have demonstrated a lower risk of overall, nocturnal, and severe hypoglycemia with IDeg when compared to IGlar-U100 in patients with T1D and type 2 diabetes.20-24 Clinical head-to-head comparisons between IDeg and IGlar-U300 are currently under way.
Footnotes
Acknowledgements
The authors would like to thank Charlotte Thim Hansen, MD, and Michiel C. E. Van Leeuwen, MD, from Novo Nordisk A/S for scientific reviews and Ruchita Kapoor, PhD, Novo Nordisk A/S, for medical writing support.
Abbreviations
AUC, area under the curve; BG, blood glucose; CI, confidence interval; CV, coefficient of variation; GIR, glucose infusion rate; IDeg, insulin degludec; IGlar, insulin glargine; n, number of clamps; SS, steady state; T1D, type 1 diabetes; U100, 100 U/mL; U300, 300 U/mL.
Declaration of Conflicting Interests
The author(s) declared the following potential conflicts of interest with respect to the research, authorship, and/or publication of this article: TH is a shareholder of Profil, which received research funds from Adocia, Biocon, Dance Pharmaceuticals, Eli Lilly, Johnson&Johnson, Julphar, Medimmune, Mylan, Nordic Bioscience, Novo Nordisk, Poxel, Roche Diagnostics, Saniona, Sanofi, Senseonics, SkyePharma, and Zealand Pharma. In addition, he is a member of advisory panels for Novo Nordisk and received speaker honoraria and travel grants from Eli Lilly, Novo Nordisk, and Sanofi. KK and HLH are employees and shareholders of Novo Nordisk A/S.
Funding
The author(s) disclosed receipt of the following financial support for the research, authorship, and/or publication of this article: The studies reported in this publication were funded by Novo Nordisk A/S.