
Abstract
Background:
Continuously measured glucose and lactate levels in interstitial fluid (ISF) may markedly differ from their respective blood levels.
Methods:
Combining microdialysis with a bioanalytical microsystem, the interstitial glucose and lactate concentrations of eight male volunteers with different body mass index (BMI) were monitored during a 2-fold glucose tolerance test over the period of three hours.
Results:
Significant correlations were found between abdominally measured sensor results and reference measurements (R2 = .967 for glucose and R2 = .936 for lactate, P < .05). The physiological delay of the abdominally observed glucose appearance in the ISF correlated positively with the BMI (R2 = .787, P < .05). The relative in vivo recovery of glucose and lactate was inversely proportional to the BMI of the volunteers (R2 = .540 for glucose, R2 = .609 for lactate, P < .05). One subject with a BMI of > 34 kg/m2 showed abdominally as well as the antebrachially significantly reduced tissue glucose values compared to blood glucose values (P < .001).
Conclusions:
A very good correlation between abdominally measured sensor results and the results of the reference method verified the reliability of the BioMEMS. The abdominally measured glucose level in ISF decreased significantly with increasing BMI. Therefore, an in vivo calibration of glucose levels in ISF with blood levels seems to be necessary especially in markedly obese subjects.
Diabetes mellitus is one of the major life-shortening diseases, especially in wealthy countries. 1 Its worldwide prevalence was 8.5% in 2015 and the number of diabetes patients currently exceeds 422 million adults. 2 Single-use sensors are state of the art diagnostic devices and many patients have to prick their fingers several times a day. On the other hand, data acquisition by pricking the fingers is too infrequent for many patients to obtain optimal care. Ongoing developments are focusing on continuous measuring of glucose levels in the subcutaneous ISF. Recently, the German Federal Joint Committee has approved payment for continuous glucose monitoring systems (CGMS) by all insurance societies in Germany for patients with type 1 diabetes. 3
Nevertheless, in several former investigations with CGMS it could be shown that blood glucose levels frequently differ from continuously measured glucose levels in the interstitial fluid. 4 Because of difficulties related to the continuous glucose monitoring a lot of effort has been invested in the research to improve stability and sensitivity of different CGMS. Therefore, several products have reached the market in the last 20 years.5-8 Different groups performed a continuous measurement of glucose with CGMS and showed that the sensor performance relative to blood glucose measurement was stable, but calibration with blood glucose levels several times per day was necessary because otherwise wrong values were measured.9,10 In contrast to the currently available CGMS, a single sensor device has recently been introduced which does not require calibration. 11
For valid subcutaneous results more knowledge about the local metabolism is mandatory. To get insight into the local hypodermic metabolism simultaneously to glucose also lactate was monitored. A continuous measurement setup for two parameters like glucose and lactate in ISF is currently not commercially available. In addition, these measurement results can also contribute to research on various diseases like gluconeogenesis disturbances, mitochondrial disorders or for intensive care medicine. Our investigation was focused on the correlation of interstitial glucose and lactate levels with the BMI of the volunteers. We were interested to find out in which patient a calibration between interstitially measured glucose and lactate levels and blood levels is necessary and in which patient the calibration is not required.
Methods
Volunteers
Results are presented of eight healthy male volunteers. They were subdivided into two groups (each four members) including an obese and a nonobese group. The subjects gave their written informed consent and the Ethics Committee of the University of Freiburg approved the study. Table 1 shows the clinical characteristic features of the volunteers.
Clinical Characteristic Features of 8 Male Volunteers.
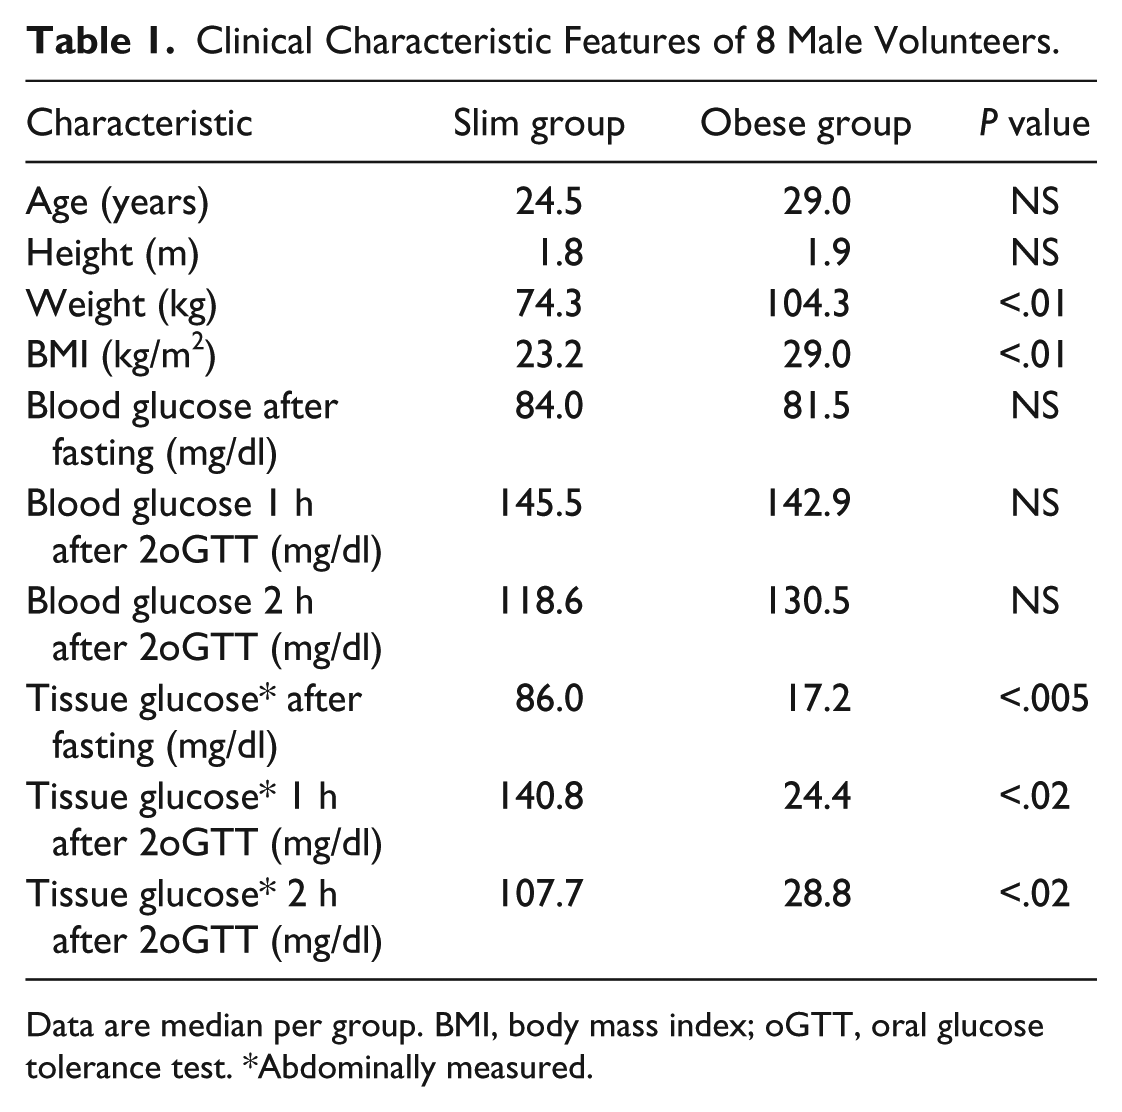
Data are median per group. BMI, body mass index; oGTT, oral glucose tolerance test. *Abdominally measured.
Study Schedule
During the whole study the volunteers were in a lying position. An intravenous catheter was inserted into the cubital vein of the left forearm. To arterialize the venous blood, a wrist-band was tempered to 37°C. Control of blood gases was performed by a blood gas analysis to ensure the arterialized character of venous blood samples. After disinfection of a 100 cm2 field, at the abdominal and antebrachial site a permanent venous catheter was placed and the CMA-70 microdialysis catheter (20kD) was inserted by the cannula. The catheter was connected with a CMA-107 microinjection pump and perfused with a degased isotonic solution. Finally, the microdialysis catheter was connected with the BioMEMS. For one hour, the fastened glucose level was measured in plasma and in subcutaneous ISF. To monitor the change of glucose and lactate content of the ISF, a double oral glucose tolerance test (2oGTT) was carried out for another 3 hours. The blood samples were taken in the preliminary phase at 15-minute intervals. After glucose intake, blood samples were taken for 1 hour at 5-minute intervals. Afterward, the blood samples were collected in intervals of 15 minutes. Table 2 shows a summary of the used chemicals and disposables
Chemicals and Disposables Used for Experiments.
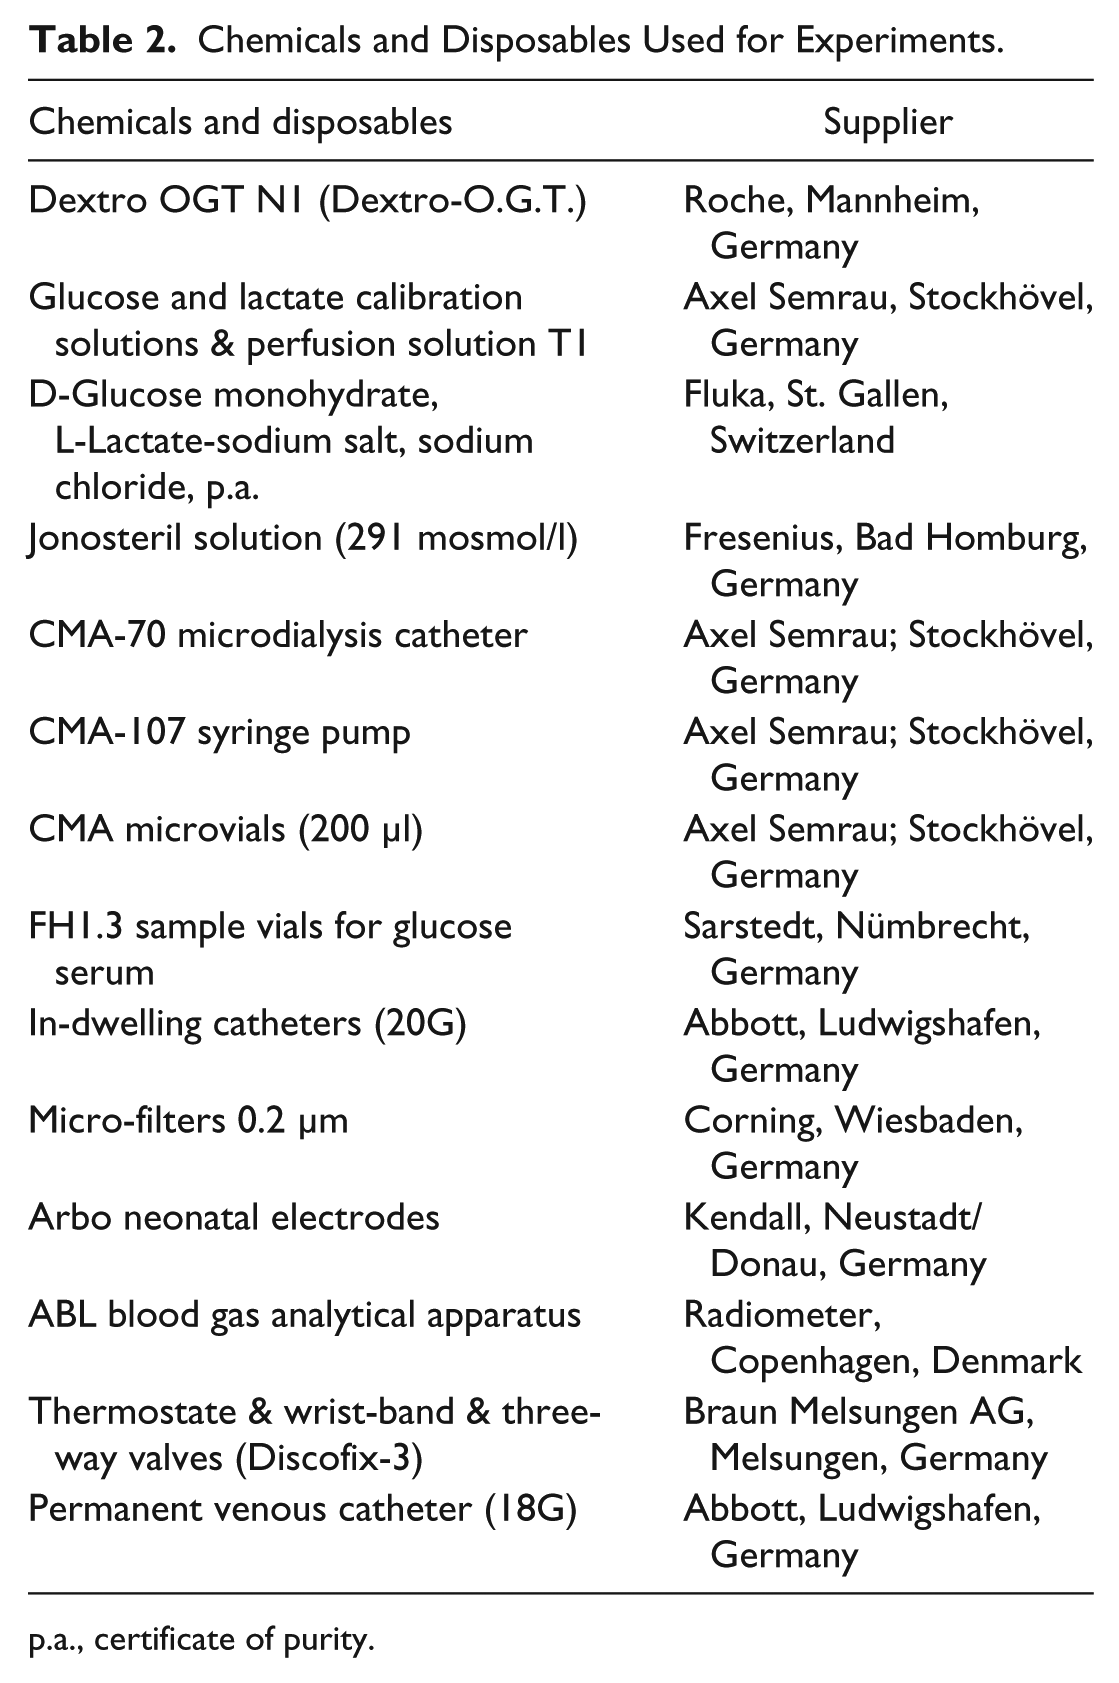
p.a., certificate of purity.
Experimental Investigations
Microdialysis
Microdialysis is based on a molecular diffusion process across a semipermeable membrane driven by a concentration gradient. In practical applications, sterilized hollow fibers of dialysis membrane are implanted and by tubing connections to a precision pump, perfused at a very low flow rate with an isotonic solution.12-14 The dialysate is then transferred to a sampling tube outside the body and discontinuously analyzed with a special enzyme-based analyzer. In contrast to this discontinuous method, which requires a pooling time of at least 10 minutes, the combination of the microdialysis catheter with a BioMEMS enables continuous monitoring of glucose and lactate with an appropriate biosensor array.
Calibration of the Measurement Setup
The BioMEMS consists of a miniaturized biosensor array which is produced by means of thin film technology and a printed circuit board (PCB) that provides micro fluidics and electrical connection. Details about fabrication and characterization were given elsewhere.15-17 The integrated glucose and lactate biosensors were previously calibrated with a three-point calibration, after each measurement a recalibration of the sensors was realized. Also the temperature dependence of the sensors was determined.
For the calibration of the measurement setup and the in vivo measurement, the BioMEMS was connected by means of an adapter with the outlet of the microdialysis catheter. The technical delay was calculated considering the volume of the dialysis tubes and the connection to the sensor. To determine the physiological delay of glucose, the temporal difference of the highest plasma glucose value was compared with the highest glucose value of the continuously measured sensor result. Because the development of lactate in subcutaneous tissue was directly induced by the rise of glucose in the tissue, the results for lactate were also shifted for the physiological delay of glucose.
Reference Measurements
To test the reliability of the used BioMEMS connected with the microdialysis catheter, the dialysate was collected after passing the sensors and used for additional analysis with the CMA-600 analyzer (CMA, Stockholm, Sweden). Glucose plasma concentration of each sample was measured with a clinical glucose-analyzer II (Beckman Coulter GmbH, Krefeld, Germany) and the lactate blood concentration was analyzed with a lactate monitor Biosen 5020 L (EKF Industrial Electronics, Magdeburg, Germany).
Relative Recovery
The “relative in vivo recovery” for glucose was defined as the relative concentration of the analyte in the dialysate referred on its concentration in the plasma. “Relative in vivo Recovery = ([c] dialysate / [c] plasma) × 100.”
Similarly, for lactate it was defined as tissue/blood ratio in percentage.
Because of a special membrane arrangement of the BioMEMS, the sensor signals were independent on the flow rate over a very wide range.18,19 In preliminary tests, an in vitro assay was realized to evaluate the relative recovery of the used setup. Therefore the microdialysis probe was connected to the BioMEMS and the recovery was measured with 5 mM glucose solution in PBS at different flow rates. By choosing a flow rate of 0.3 µl per minute it could be shown that the recovery was nearly 100%. Moreover, to circumvent problems associated with unpredictable recovery in vivo, the zero flow method was used. 20
Statistical Analysis
Statistical analyses were performed with data analysis and graphics software Origin Pro 9G. The Shapiro-Wilk test was used to test the normal distribution of the results. For normally distributed results the t-test was used to test the significance of the difference between the means of two samples and the Wilcoxon Mann-Whitney rank-sum test as a nonparametric alternative was used. The Spearman rank correlation was used to measure the degree of association between two variables for nonparametric distribution. In case of normally distribution of the results the Pearson’s multiple regression analysis was used to measure the degree of the relationship between linear related variables. Calculation of the median was done by the first quartile 25%, the second quartile (median) 50% and the third quartile 75% of the data.
Results
The relative in vivo recovery of abdominally measured glucose and lactate levels in the ISF inversely correlated with the BMI of the volunteers (R2 = .540 for glucose, R2 = .609 for lactate, P < .05). Furthermore, there was a significant positive correlation of the physiological delay of glucose with the BMI of the subjects (R2 = .787, P < .05). The average physiological delay of glucose appearance in the ISF of all lean volunteers was 10.1 ± 0.8 minutes, but 17.0 ± 6.4 minutes in obese volunteers. There was a significant correlation between abdominally measured sensor results and the results of the reference method for glucose (R2 = .967, P < .05) and lactate (R² = .936, P < .05); see Figure 1A for glucose and Figure 1B for lactate.
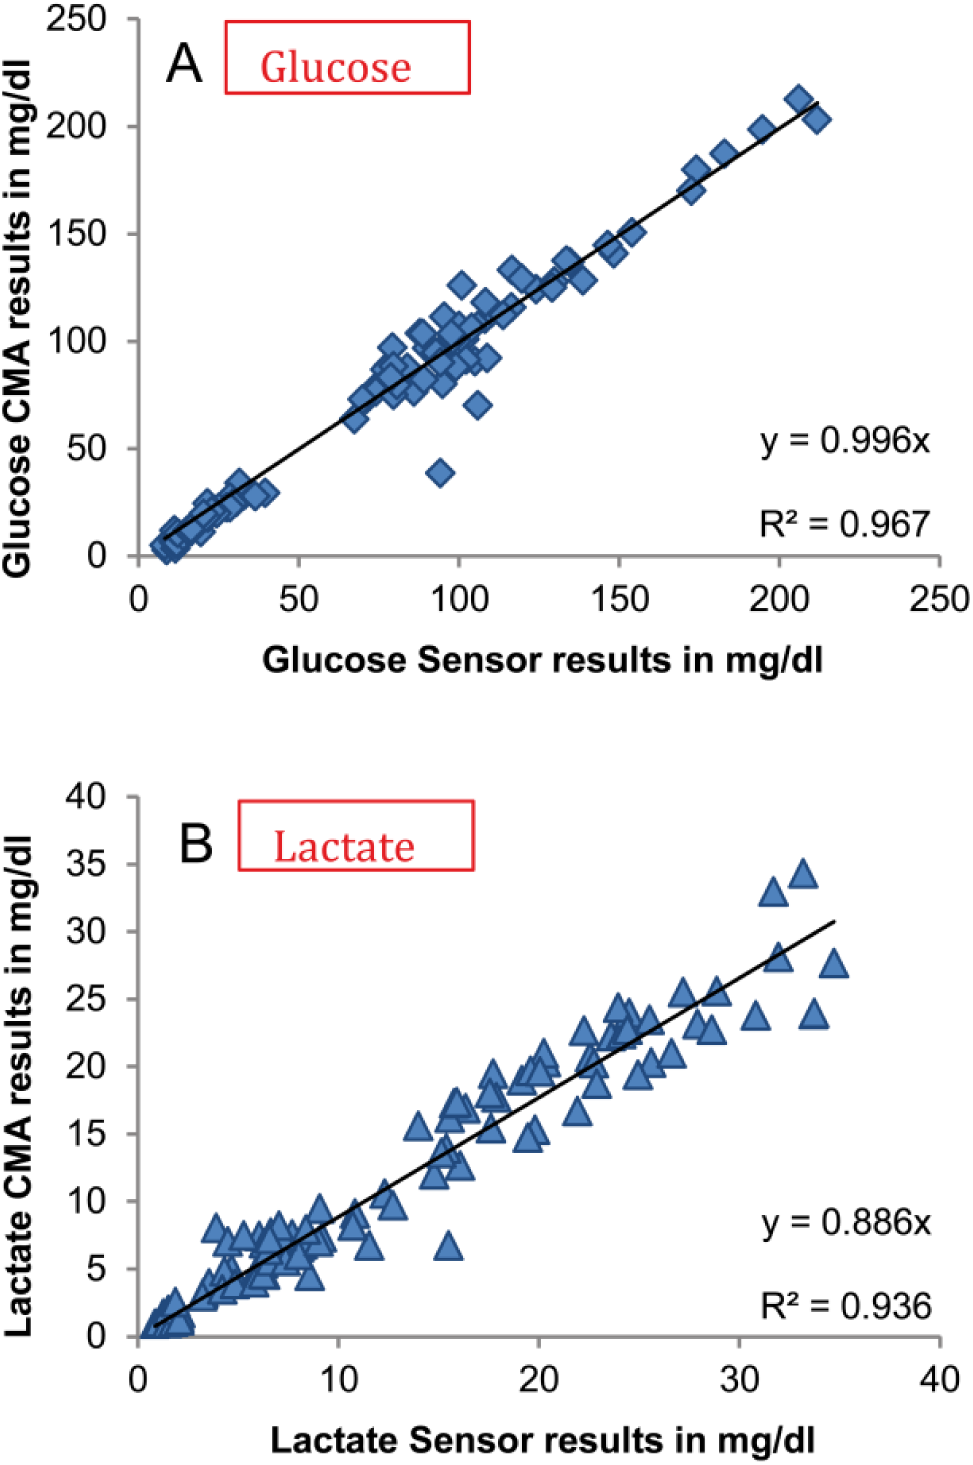
Correlation of sensor results (abdominally measured) with the results of CMA analyzer for glucose (A) and lactate (B) after correction of technical and physiological delay (P < .05). CMA samples were collected every 15 minutes in the preliminary fasting phase and another 3 h after 2oGTT and compared with the corresponding sensor values (n = 105). Runaway values verifiably caused by insufficient sample volume were eliminated.
The glucose concentration in arterialized plasma and in ISF was not significantly different in lean persons, but there was a significant difference in obese persons (P < .01). The comparison of abdominally measured tissue glucose with plasma glucose is shown in Figure 2A for lean and Figure 2B for obese volunteers.
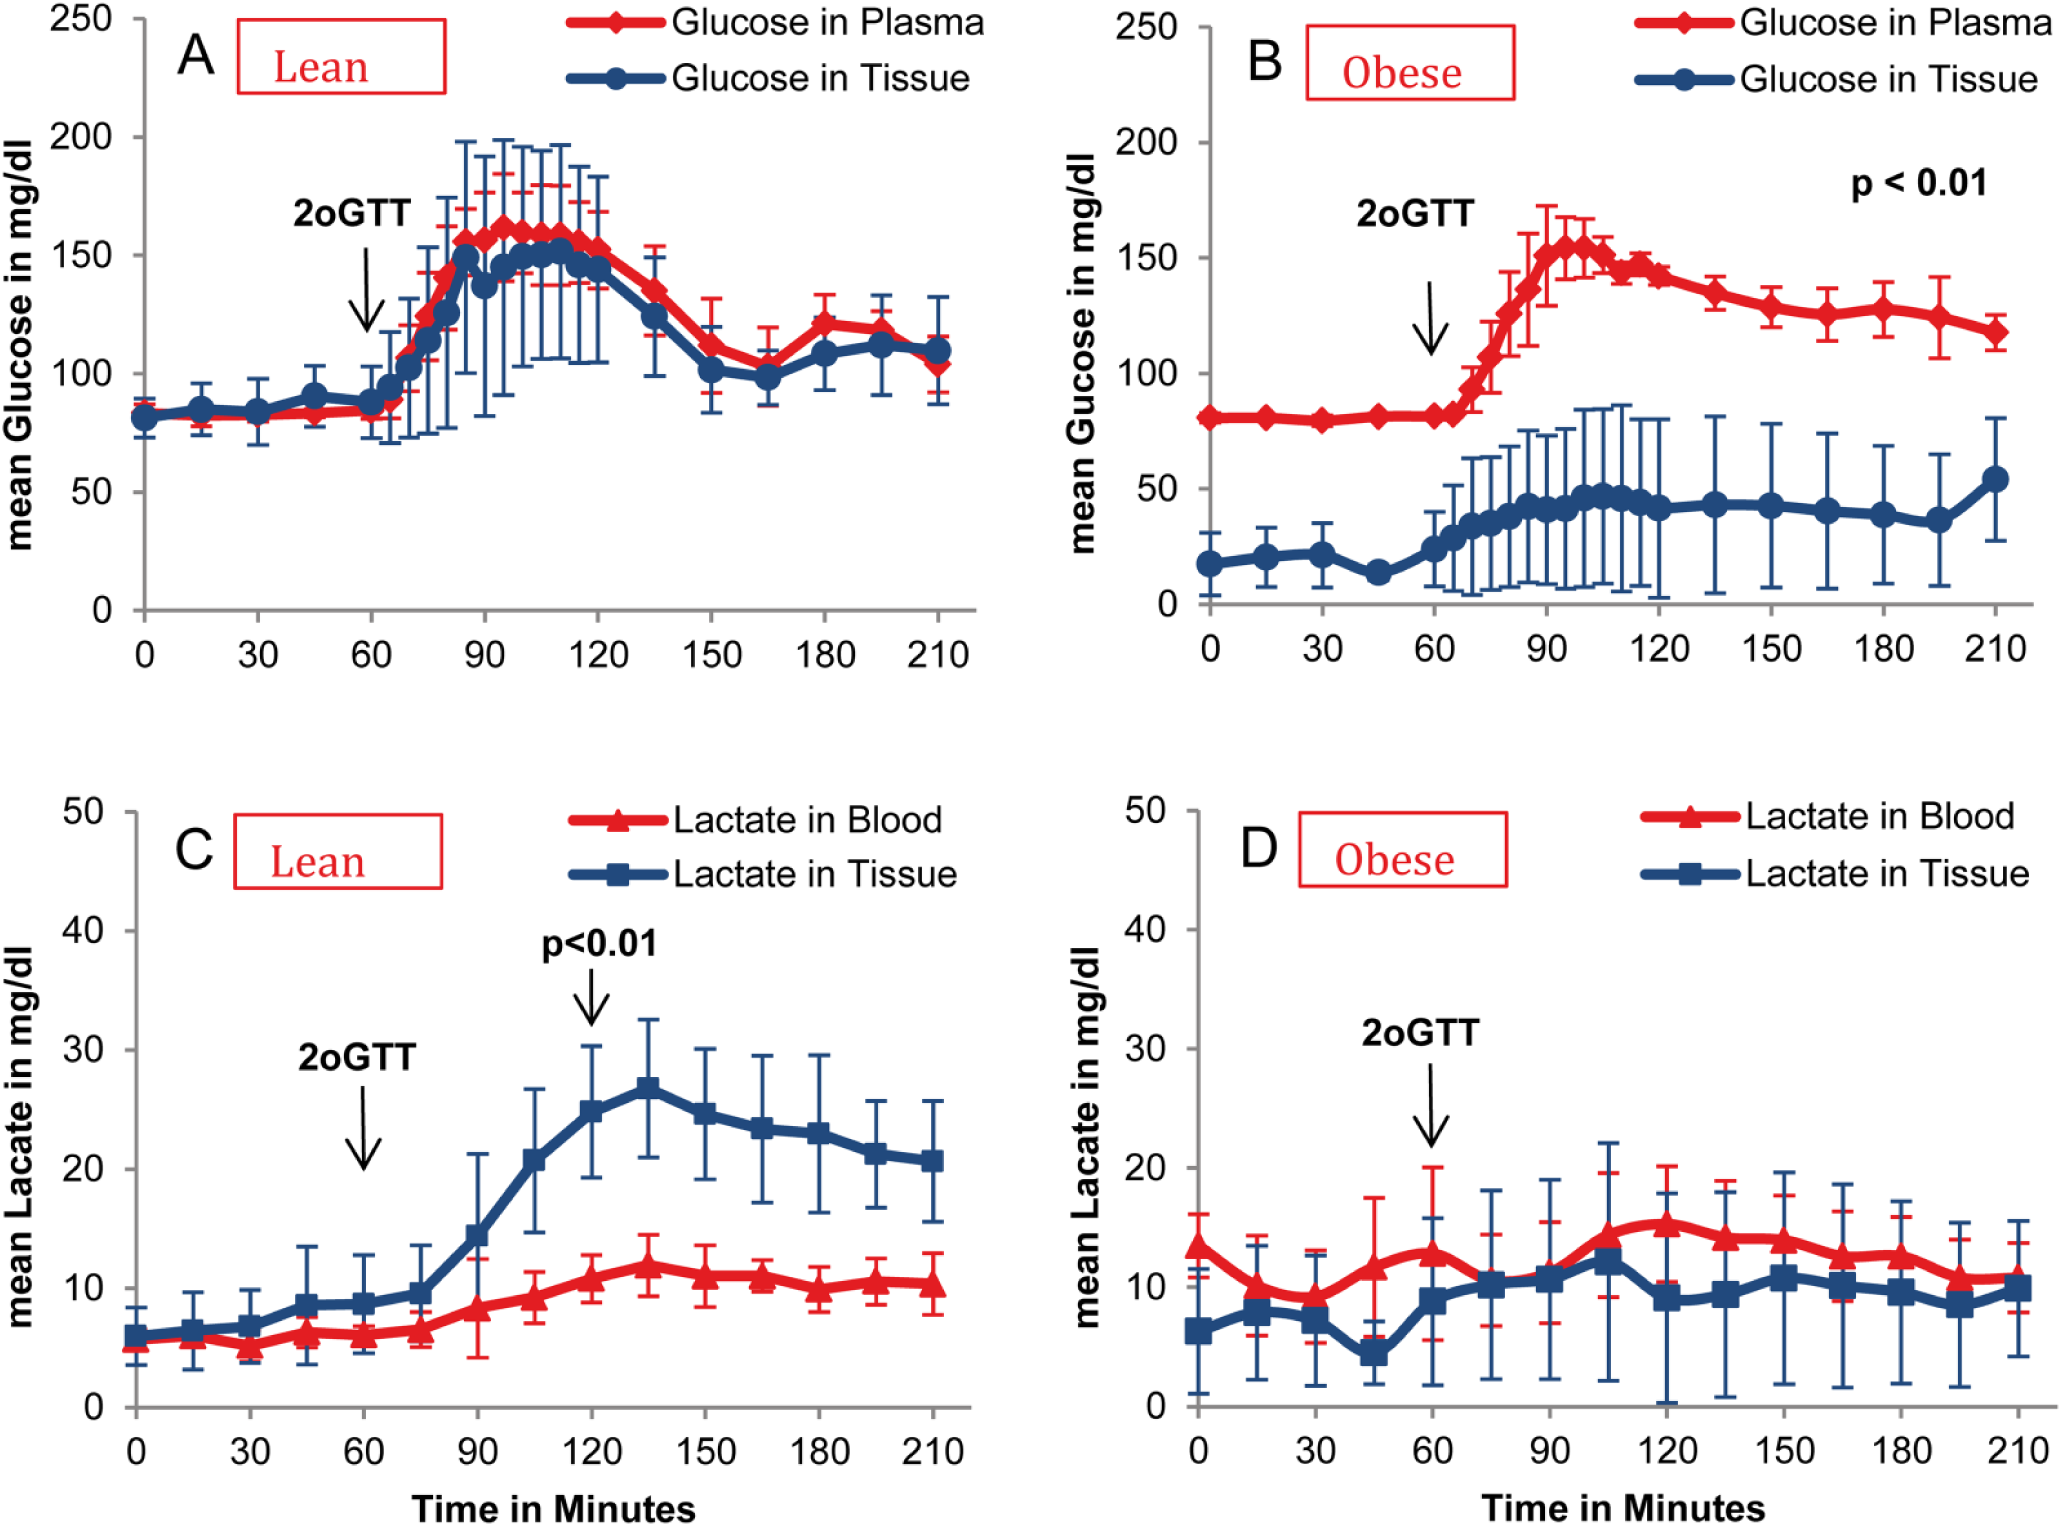
Comparison of plasma glucose with abdominally measured tissue glucose (A and B) and blood lactate with abdominally measured tissue lactate (C and D); average and standard deviation (n = 4). Significance test performed at 60, 120, and 180 minutes. No significant difference of plasma and tissue glucose in slim volunteers (A), but significant difference in obese ones at all tested times (B) (P < .01). No significant difference between tissue and blood lactate levels at baseline but significant difference 1 hour after 2oGTT and 2 hours after 2oGTT (C) (P < .05). For obese volunteers, no significant difference over the whole time (D).
Moreover, a delayed clearance of plasma glucose can be seen in obese subjects. The shapes of the curves are comparable in all volunteers, but the “relative in vivo recovery” of glucose is different depending on their BMI. To compare the kinetics of plasma glucose with sensor results, the ratio of plasma/tissue glucose was determined. The calculated mean correction factor was 1.1 ± 0.25 in lean volunteers. By contrast, obese volunteers showed a mean correction factor of 5.8 ± 3.6. There was a statistically significant difference between both groups (P < .001).
During the whole measurement (2oGTT) the lactate level in blood was not significantly increased for lean and obese subjects. A significant increase of abdominally measured lactate compared to the blood level after glucose ingestion could be observed only in lean subjects (P < .05), suggesting a lactate production in the tissue of lean subjects (see Figure 2C). Obese subjects showed no significant increase of lactate in blood and in ISF (see Figure 2D). Regarding the abdominally measured glucose and lactate level compared to plasma values a significant negative correlation was found between the mean “in vivo recovery” and the BMI of the corresponding probands (P < .05); see Figure 3A for glucose and the similarly calculated “tissue/blood ratio in percentage” for lactate, Figure 3B.
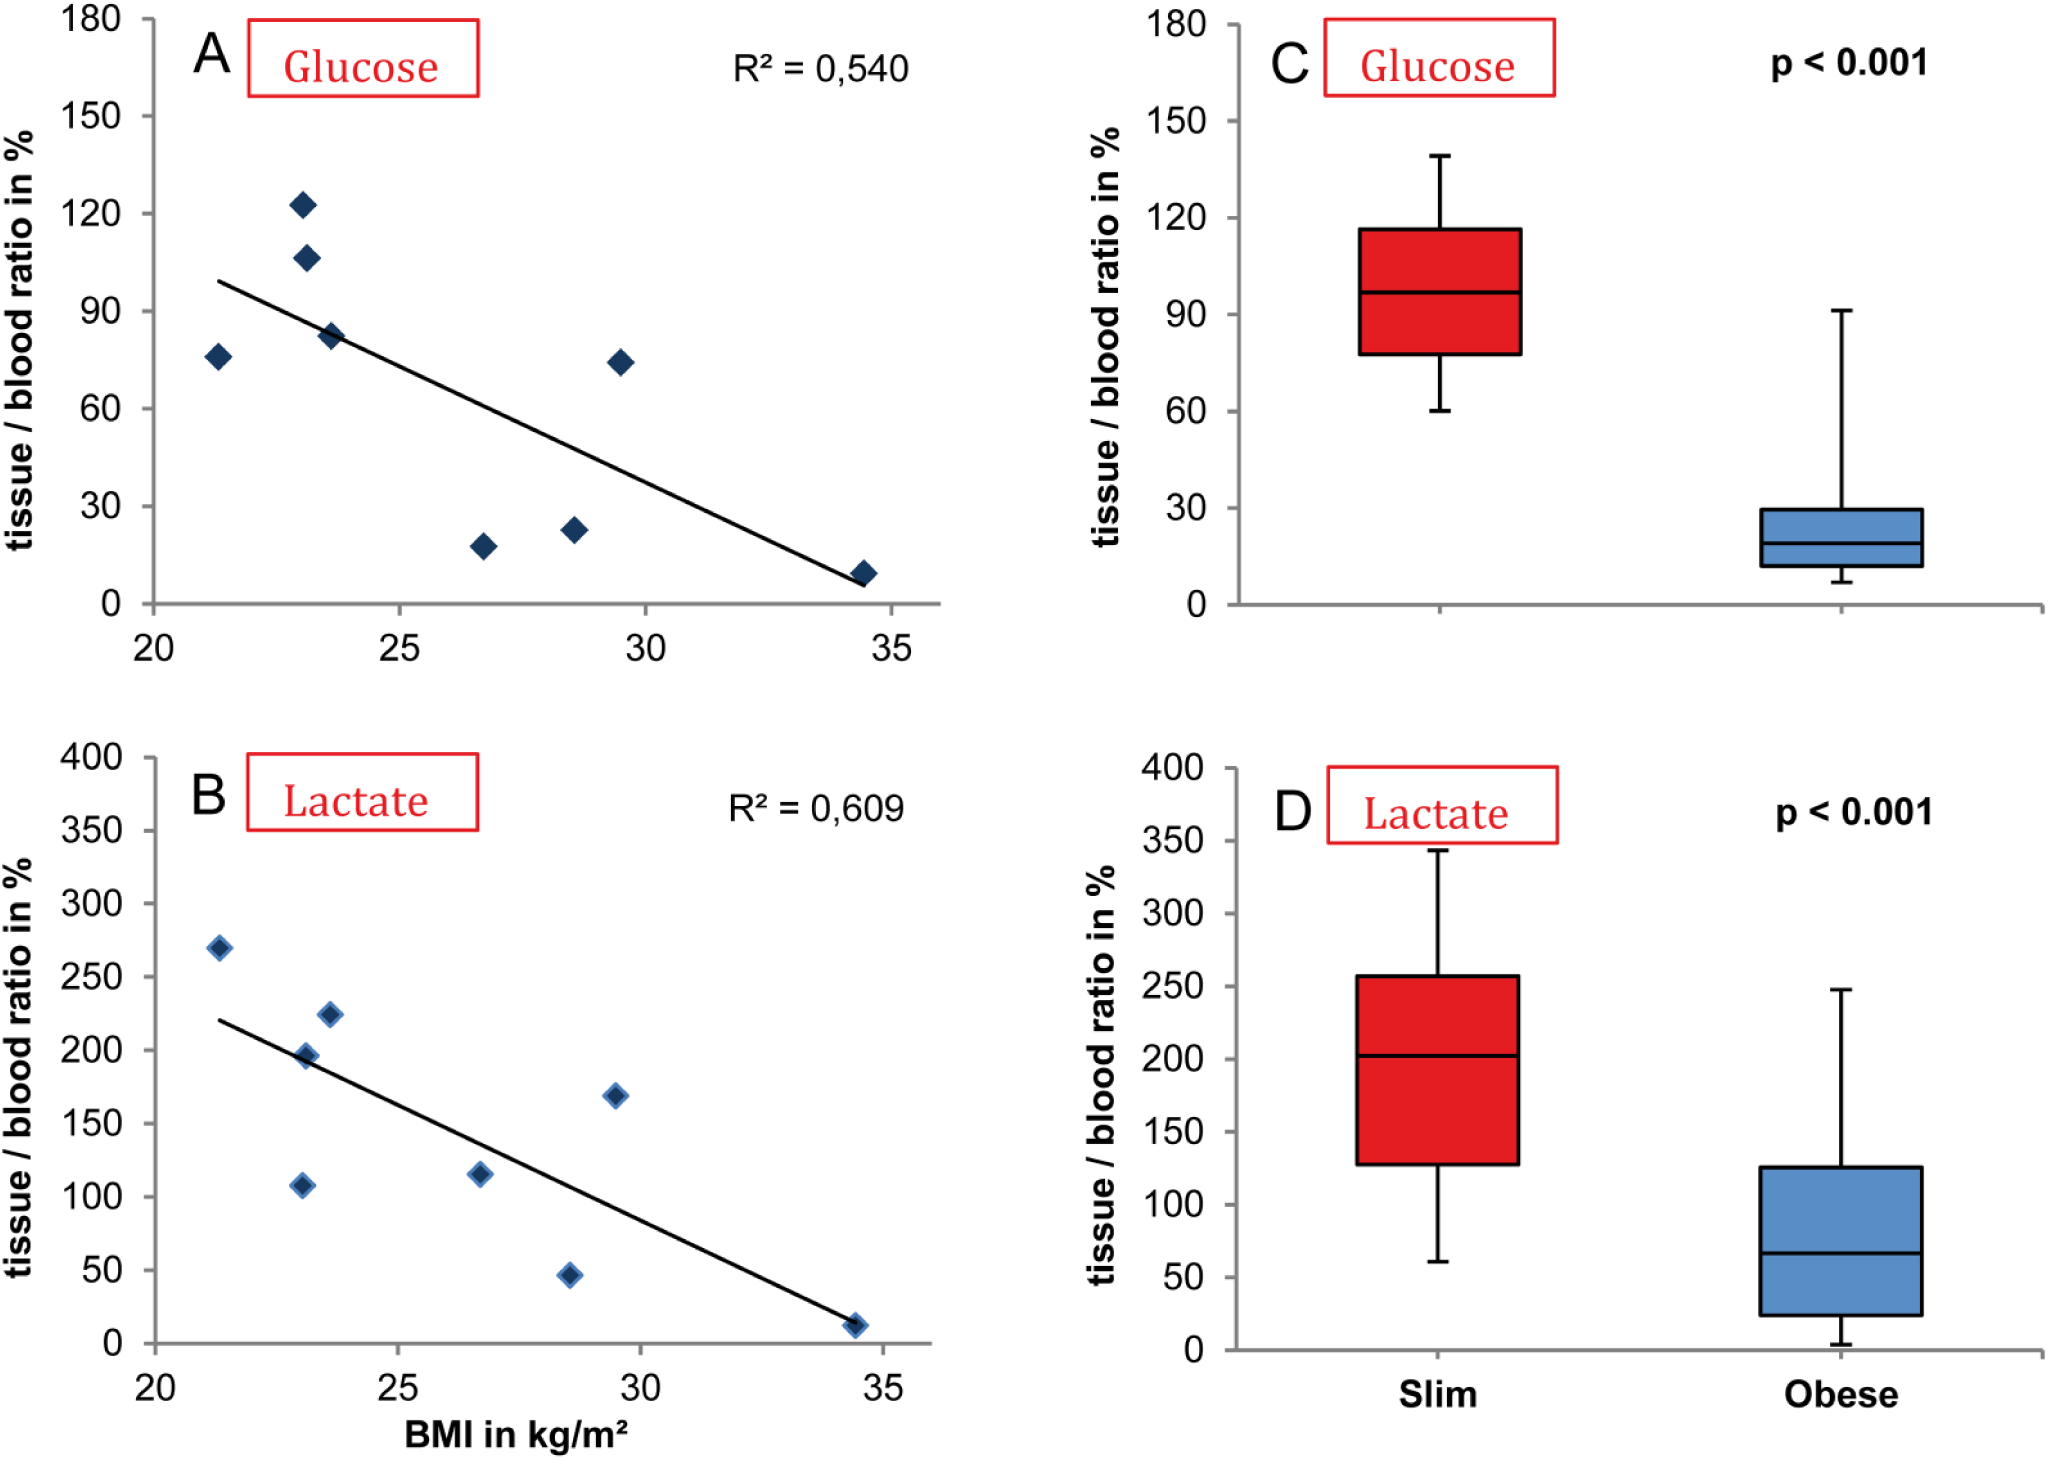
Correlation of abdominal in vivo recovery in percentage of glucose (A) and the analogous calculated tissue/blood ratio in percentage of lactate (B) of 8 volunteers with their BMI: average of the calculated tissue/blood ratio (blood values, sampled every 15 minutes during the 2oGTT). The median and standard deviation of glucose recovery (n = 51, P < .001) are shown in (C), and the analogous calculated tissue/blood ratio in percentage of lactate (n = 48, P < .001) is shown in (D).
The median of the “in vivo recovery” of glucose was 97% in slim probands and 19% in obese probands (see Figure 3C). For lactate, the similarly calculated median was 202% in slim and 67% in obese probands (see Figure 3D). There was a significant difference between slim and obese volunteers for glucose as well as for lactate (P < .001).
In analogy to the measurement of glucose and lactate at abdominal site measurements were also performed at antebrachial site. However, we frequently got partial or complete obstructions of the microdialysis catheter at the antebrachial site leading to decreased flow of the perfused solution. One subject with a BMI 34.4 kg/m2 showed no problems with regard to the flow rate of the perfusate. Interestingly, this subject showed a decreased in vivo recovery of glucose not only at abdominal but also at antebrachial site. There was a significant difference between plasma glucose and abdominally as well as antebrachially measured glucose levels (P < .001; see Figure 4A). The second subject with a BMI of 28.6 kg/m2 showed only few problems with the flow rate at the beginning of the measurement. The antebrachially measured glucose levels of this subject are similar to plasma glucose but abdominally measured glucose levels are significantly decreased (P < .001; see Figure 4B).
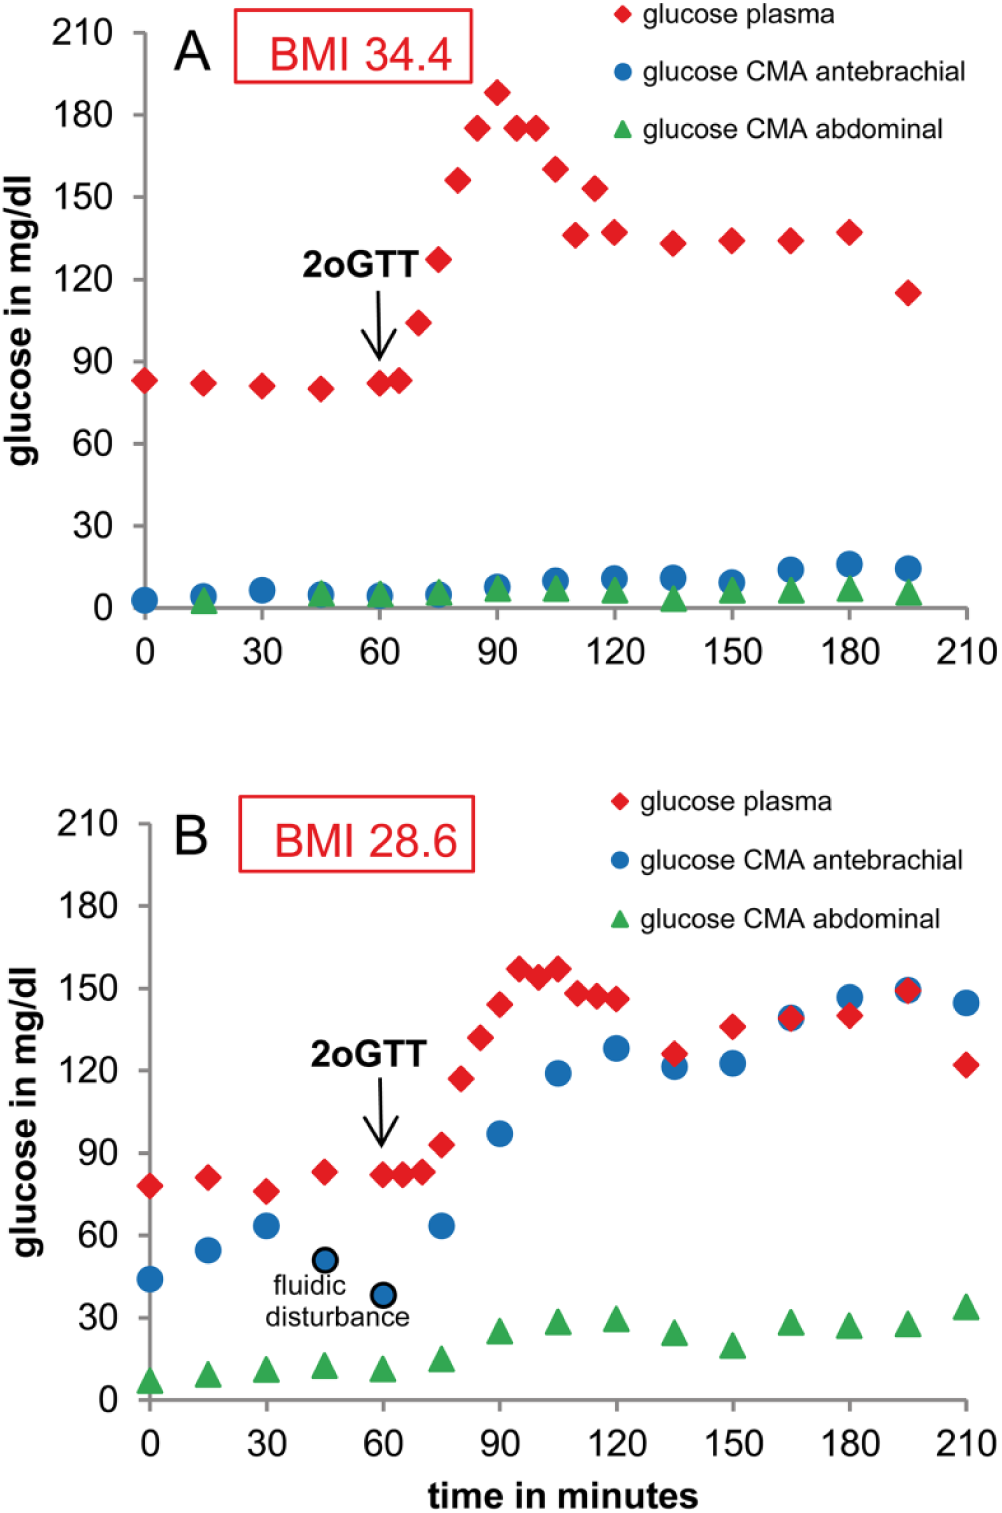
Comparison of plasma glucose with CMA-results of abdominally and antebrachially measured tissue glucose (sampled every 15 minutes during the 2oGTT). (A) BMI 34.4 kg/m2. Significant difference of antebrachially and abdominally measured glucose levels and plasma glucose (P < .001). (B) BMI 28.6 kg/m2. Antebrachially measured glucose levels are similar to plasma glucose levels but significant difference between plasma glucose and abdominally measured glucose levels (P < .001).
Discussion
As the most important result we found a moderate negative correlation between the glucose levels in the abdominally measured ISF with the BMI of the examined subjects. Moreover, a significant positive correlation of the physiological delay with the BMI was found. The relative recovery of glucose was nearly 100% in lean persons but in obese volunteers we found an almost 6-fold lower content of glucose in ISF compared to plasma. The low content of glucose in the abdominally measured ISF of obese compared to nonobese subjects could be explained by the hypothesis of an increased glucose uptake of adipose cells. Moreover, a reduced blood circulation in the adipose tissue leads to an interstitium/blood glucose equilibrium with lowered glucose levels in the ISF. This latter hypothesis of reduced blood circulation in adipose tissue is supported by our observation of delayed clearance of plasma glucose after loading in obese subjects. Therefore, we suggest that a continuous glucose measurement in adipose tissue should always include a calibration with the respective blood values.
Obese subjects may develop type 2 diabetes more frequently compared to lean subjects. Initially, obese patients normalize their glucose levels by increasing their insulin synthesis. Thus, an increased uptake of glucose by adipocytes due to increased insulin values can frequently be seen in obese subjects.21,22 But later on, the patients lose their ability to produce sufficiently high amounts of insulin. Therefore, the uptake of glucose by the adipose tissue worsens and the fasting glucose values in ISF increase. This might explain the different findings in former publications related to the glucose levels in the subcutaneous ISF.23,24 Thus, Hagström et al reported that in obese patients the maximum relative glucose level in abdominal fat was almost twice as high as in blood (P < .005), and the total glucose level (area under curve, AUC) was 50% higher than the blood glucose AUC (P < .005). 25 In our study, even the patient with the highest BMI of 34.4 kg/m2 had no signs of diabetes. He showed no kind of insulin resistance since the 2 hour blood glucose level remained below 120 mg/dl after a double glucose tolerance testing. Therefore, an adequate insulin secretion has to be assumed as well as a sufficient uptake by the adipose tissue leading to low ISF glucose levels. With respect to the physiological delay of glucose appearance in adipose tissue, in former studies, ethanol was used as flow marker to investigate blood flow circulation in different tissues. 26 Adams et al found that blood flow in the subcutaneous adipose tissue depends on the skin-fold thickness. 27 In further studies it could be shown that the responsiveness of adipose tissue blood flow (ATBF) to fasting and also to nutrients is reduced in obesity and associated with insulin resistance. 28
To get more insight into the local hypodermic metabolism we performed a simultaneous measurement of glucose and lactate. There was a significant increase of lactate in the ISF in slim subjects during 2oGTT due to in situ production of lactate. This could be caused by the rapid increase of glucose after glucose ingestion. If there is not enough oxygen for the aerobic metabolism of glucose in subcutaneous tissue, lactate will be produced. In obese subjects a significant lactate increase could not be observed. This also could be explained by the reduced blood flow of adipose tissue leading to retarded glucose supply which could be metabolized by the surrounding cells under aerobic conditions. Jansson et al also found that plasma and interstitial lactate levels increased significantly after an oral glucose load in lean and obese subjects but apparent lactate release increased significantly only in the lean group. Moreover, in lean subjects there was an increase of tissue blood flow after the oGTT, whereas the blood flow response to glucose was blunted in the obese subjects. Also the postabsorptive ATBF was significantly lower in the obese subjects in abdominal but not in the femoral region. 29
It might be suggested that the low number of investigated subjects could be a limitation of the study. However, the low number of examined subjects led to significant results. Therefore, inclusion of further subjects would not increase the power of the study. Nevertheless, our results give no information regarding sex and age differences, ethnic specialties or the degree of BMI leading to low glucose levels in the brachial adipose tissue.
In summary, the presented results show a markedly reduced abdominal glucose level in subjects with a high BMI. Noteworthy in one subject with a BMI of 34.4 kg/m2 not only abdominally but also the antebrachially measured glucose values were markedly reduced, both being measured in fatty tissue. Therefore, in patients with high BMI an external calibration of continuously measured glucose levels in ISF with blood levels seems to be required. Especially regarding the monitoring systems currently on the market which do not require calibration by the end-user, 30 the measurement of glucose values in fatty tissue could be problematic in patients with a BMI over 34 kg/m2 because these patients frequently have adipose tissue not only at abdominal but also at antebrachial site. Therefore a lower tissue glucose level can be expected.
Conclusions
The significant correlation between the sensor results and the results of the CMA reference analyzer verify the reliability of the BioMEMS connected with a microdialysis catheter. The higher the BMI of the examined volunteers, the lower is the relative recovery of glucose and lactate in the abdominally measured ISF and the higher is the physiological delay. Especially one subject with a very high BMI showed significantly reduced glucose levels not only in the abdominal but also in the antebrachial region. Therefore, an external calibration of glucose and lactate levels in ISF with blood levels seems to be necessary especially by measuring glucose in fatty tissue of markedly obese subjects.
Footnotes
Acknowledgements
The authors thank the volunteers who participated in the study. The authors also would like to thank Gerhard Jobst for his guidance and support, Markus Müller as well as Miguel Martinéz for assistance at different transactions, and Clement, HW, for scientific support and supply of measuring instruments.
Abbreviations
ATBF, adipose tissue blood flow; AUC, area under curve; BMI, body mass index; CGMS, continuous glucose monitoring system; ISF, interstitial fluid; oGTT, oral glucose tolerance test; PCB, printed circuit board; 2oGTT, double oral glucose tolerance test.
Declaration of Conflicting Interests
The author(s) declared no potential conflicts of interest with respect to the research, authorship, and/or publication of this article.
Funding
The author(s) disclosed receipt of the following financial support for the research, authorship, and/or publication of this article: The study was funded by the University of Freiburg and the Eli Lilly Company. It was originated as a common project of the Laboratory for Sensors, IMTEK - Department of Microsystems Engineering, University of Freiburg and the Department of Pediatrics and Adolescence Medicine, University Hospital Freiburg.