
Abstract
This work represents a preliminary proof-of-concept design and verification of a 3D-printed glucose biosensor. The proof of concept presented is the first example of glucose dehydrogenase sensor fabricated by a 3D-printer while maintaining similar features to current lab-industry standards. The sensor was verified to detect physiological glucose concentrations between 0 and 400 mg/dL with a linear coefficient as high as .97. This study showed that it was possible to use 3D-printed technology to create a biosensor sensitive to glucose detection. As availability and functionality of 3D-printers expands, this technology has the potential to be an option for diabetes management. This preliminary study shows that the 3D-printed sensor platform holds promise for sensitive glucose detection.
According to the World Health Organization (WHO), there are 422 million individuals with diabetes worldwide and 29.1 million in the United States alone.1-3 Globally, there are 1.5 million diabetes-related deaths each year, with untreated and undiagnosed diabetes mellitus growing at an alarming rate.4,5 The prevalence of diabetes is expected to continue growing and is projected to be the seventh leading cause of death by 2030.5,6 To prevent diabetes related complications, blood glucose levels must be tested and corrected several times a day.7-10
The standard practice for testing blood glucose levels involves using a self-monitoring blood glucose (SMBG) device. SMBG devices are the most widely used monitoring technology for individuals with diabetes.11,12 These screen-printed devices are relatively easy to use and provide fast results. Although screen printing is widely considered state-of-the-art, 3D-printing technology shows promise as an alternative.
3D-printing is an additive manufacturing process that involves layering heated material. 13 A computer-aided design (CAD) file of the object is transferred to the printer software and can be printed rapidly and with various printer filament materials.14,15 The recent development of conductive filaments has allowed for the possibility for 3D-printing technology to be used in the creation of electronics such as a glucose meter. One such filament, graphene, is a conductive material with unique properties as it is the thinnest, lightest, and strongest material available for 3D-printing thus far. This study involved the development of a 3D-printed, grapheme-based diabetes biosensor.
The WHO has several requirements for the development of new biosensors, including being affordable, sensitive, and specific. Our 3D-printed graphene biosensor was created to detect glucose within the physiological range, 0-400 mg/dl. 16 To verify this proof-of-concept 3D-printed sensor, amperometric current over time (Amp i-t) testing was performed. This technology holds considerable promise in becoming an alternative to SMBG strips for individuals with diabetes.
Material and Methods
Chemicals and Reagents
All chemical reagents used in experiments were purchased through Sigma-Aldrich (St Louis, MO) unless stated otherwise; 10 mM phosphate buffer saline (PBS) tabs were purchased from Calbiochem (Gibbstown, NJ). The enzyme used in these experiments, glucose dehydrogenase flavin adenine dinucleotide (GDH-FAD), was kindly donated from Amano Enzyme LLC (Japan). The GDH-FAD used had an activity of 209 U/mg. PBS with a pH of 7.4, was used to prepare all glucose solutions, redox mediator solution, and enzyme solution.
Glucose and Enzyme Solution
A 100 mM redox mediator solution was created using potassium ferricyanide and PBS. To create the enzyme solution, the redox mediator solution and GDH-FAD enzyme were mixed together in a one-to-one ratio, 1 mg of the GDH-FAD enzyme was mixed with 1 mL of the redox mediator solution. Purified glucose solutions of 0, 25, 50, 100, 200, and 400 mg/dL were prepared using PBS and allowed to fully dissolve for 24 hours before use.
Sensor Development and Design
The 3D-printed sensor, printed using a MakerBot printer, was designed to have similar dimensions and features to a commercially available screen-printed sensor called a Zensor (Taiwan). The CAD model is shown in Figure 1A. The conductive graphene polylactic acid filament was purchased through BlackMagic3D (Calverton, NY) due to being the most conductive filament available with a reported conductivity of 0.6 ohm per cm. The 3D-printed sensors were printed onto a mylar substrate, shown in Figure 1B. In addition, the MakerBot printer settings were set with a travel speed of 30 mm/s, extruder temperature of 220°C, and retraction distance of 1.5 mm. All current output measurements were performed at room temperature using a CHI 1230A electrochemical analyzer (CHI, Austin, TX); reaction shown in Figure 1C. To achieve the most viable system response the 3D-printed material with the mylar substrate was soaked in an enzyme solution, determined to be 420 minutes by slope and R2 correlation, shown in Figure 2A with a comparison shown in Figure 2B.
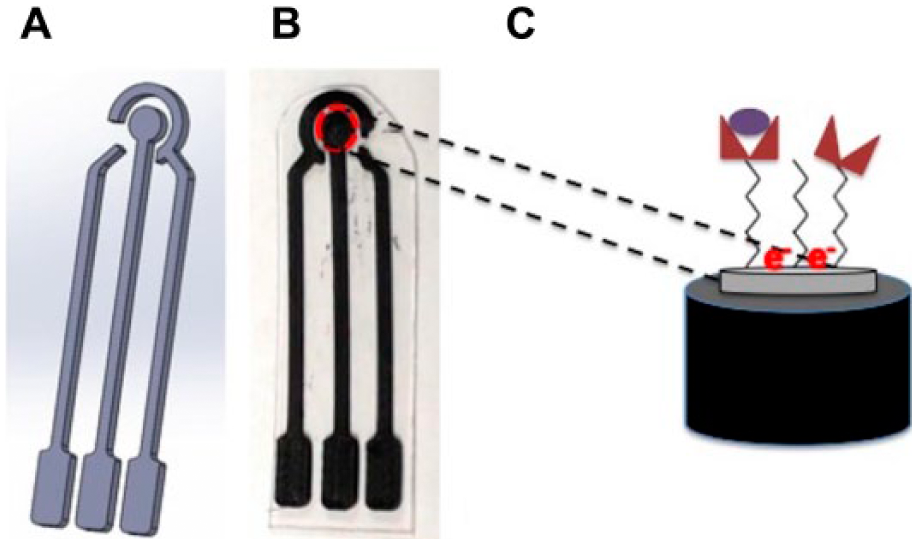
Schematic. (A) CAD model of the 3D-printed sensor with dimensions 11.07 × 37.72 × 0.95 mm. (B) Sensor printed with conductive graphene filament onto a mylar substrate that is dipped fully into an enzyme solution. (C) The reaction of the glucose and glucose dehydrogenase reacting generating electrons that are converted to a current output.
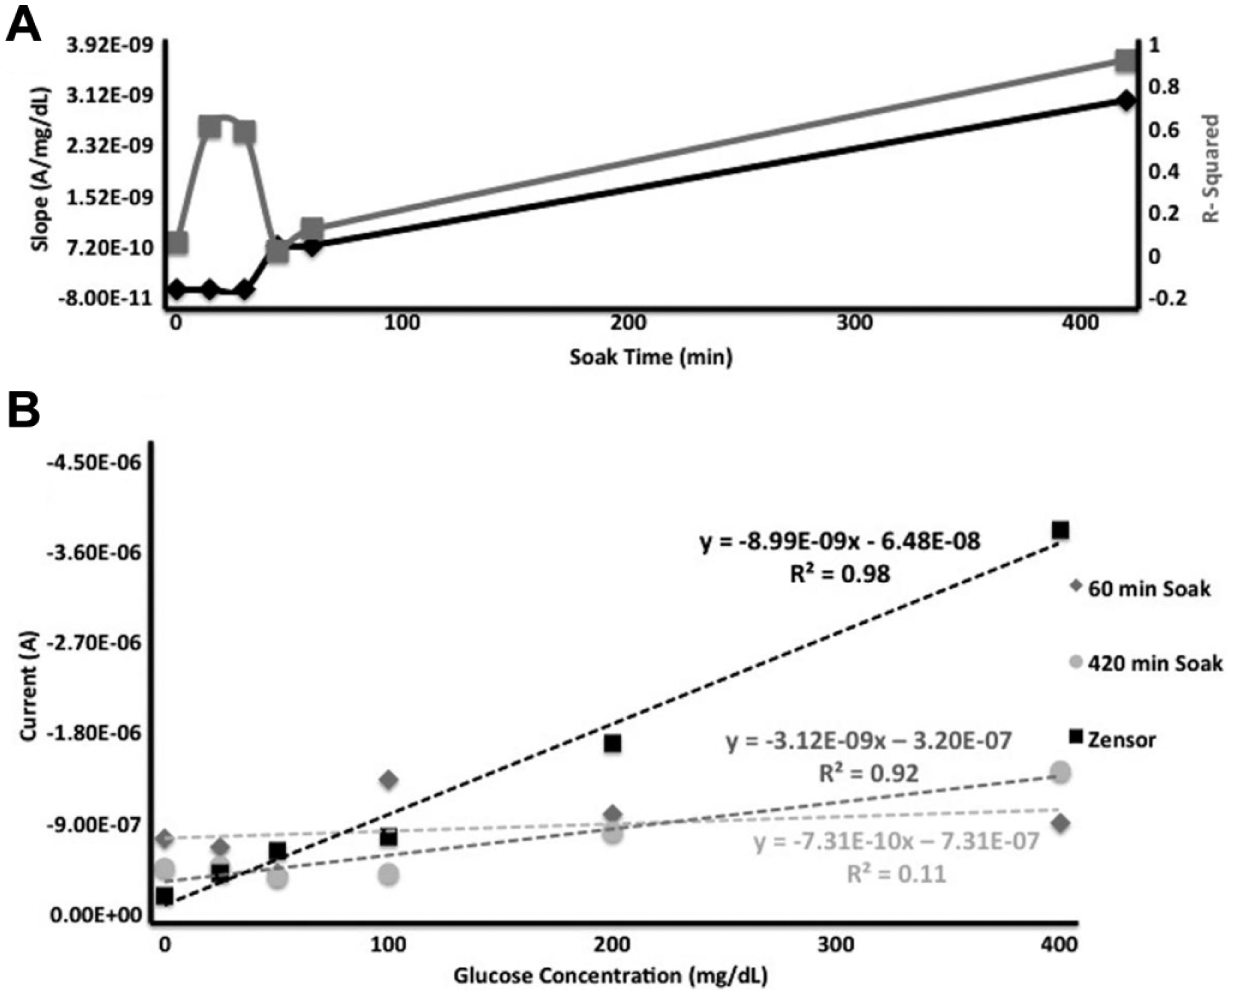
(A) The effect that soak times of 0, 15, 30, 45, 60, and 420 minutes have on the slope and linear correlation values. (B) Overlay plot of the current with the optimal soak times. The current output for glucose solutions of various concentrations for each individual soak time were overlaid with a Zensor to show that 420 minutes gave the best comparable result when compared to a Zensor. A soak time below 60 minutes produced a flat line when graphed alongside the scale. In addition, the magnitude of the slope increased with increasing soak time.
Sensor Calibration
Glucose levels of 0, 25, 50, 100, 200, and 400 mg/dL were detected using the electrochemical analyzer. Using PBS as a standard, cyclic voltammetry (CV) was conducted to determine the range of potentials suitable for amperometric current-over-time (Amp i-t) assay. Standard glucose concentrations were tested with the various potentials in Amp i-t to find the strongest upper limit of detection (ULD). The ULD was calculated by 3.3*standard-deviation-blank/slope. After finding the best ULD. A bias potential of 0.35 V was chosen, shown in Figure 3A and Figure 3B, that had the best signal-to-noise ratio (SNR). Using this voltage, the glucose solutions were tested using Amp i-t. An analysis of the slope and correlation determined the electrical current at t = 42.3 seconds, shown in Figure 4A and Figure 4B, is the best representation of the signal produced by the sample. Current output values at 42.3 seconds for glucose solutions with concentrations of 0, 25, 50, 100, 200, and 400 mg/dL were used in the construction of the calibration curve.
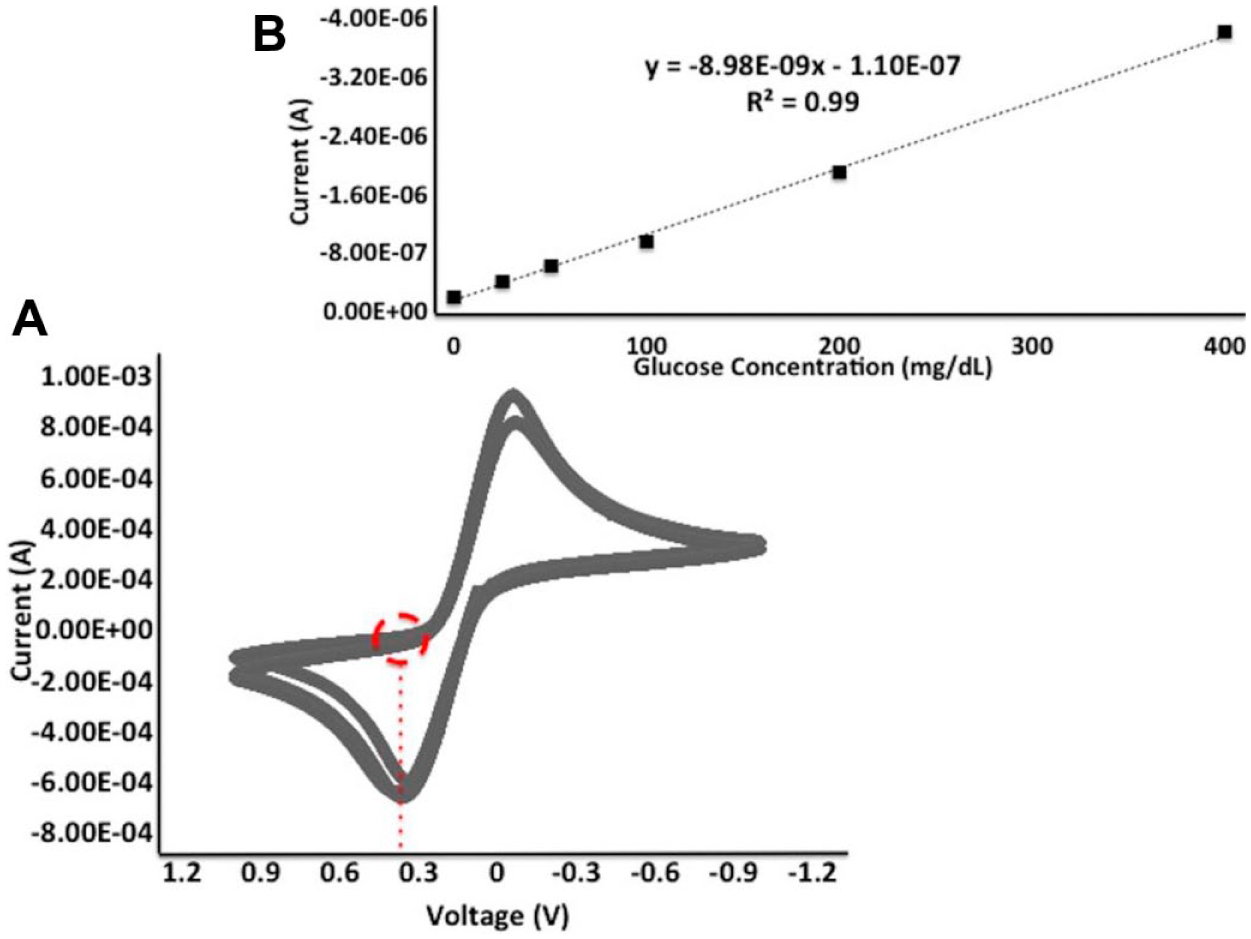
(A) CV using a Zensor with the redox mediator solution. The red circle shows the most optimal current responses observed in Amp-it at 0.35V. (B) Zensor calibration curve with current response output (amps) versus the various glucose solutions (mg/dL). The correlation in the data is quantified as .99, with a slope of −8.98E-9X, and an intercept −1.10E-7. Tests at each concentration were conducted with three replicates. The error bars represent standard deviation and the maximum relative standard deviation was determined to be 7%.
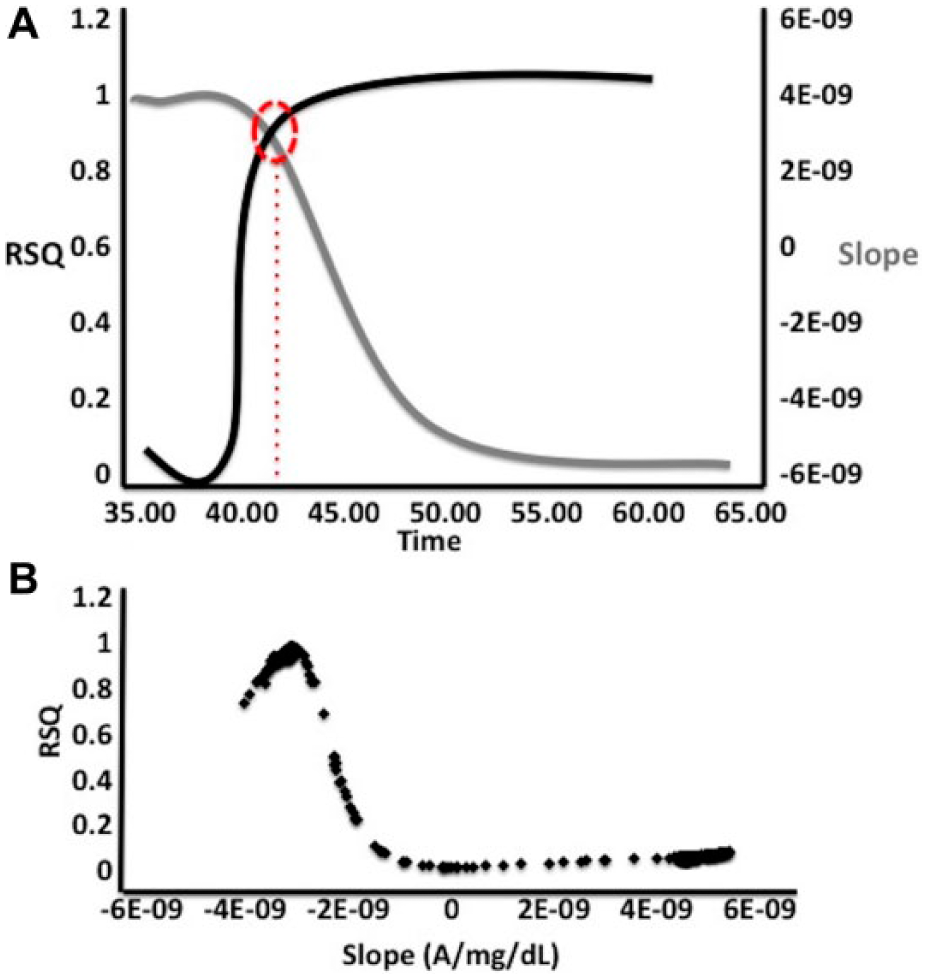
(A) Representation of the highest slope and R2 at the most optimal time point. (B) Peak representation of the R2 versus the slope.
Calibration Curve from Characterization of Purified Samples
To ensure that the system has the best response all sensors were soaked in the enzyme solution of redox mediator and GDH-FAD at 277.15K. Before testing, the sensors were rinsed and brought to room temperature before being placed into a testing vial. In the testing vial, 810 uL of the enzyme solution was thoroughly mixed with 90 uL of the glucose solutions. In addition, the y-axis and x-axis for all graphs presented are on a linear scale.
Quality Control
Electrodes were printed and prepared in batches of 9 using the methods described above. Each electrode was analyzed using Amp i-t at 0.35 volts. Once tested, all the sensors were placed into batches of similar baseline response readings.
Results
Using the methodology described above, the soaked 3D-printed sensors were tested using the Amp i-t technique with the glucose solutions. The current outputs were measured in their respected batches. Figures 3 and 4 show optimization of the system. Figure 3A shows the red circle indicating the expected current response when 0.35V is applied. The calibration curve for the Zensor is seen in Figure 3B, and is achieved with 3 replicates for each of the glucose solution concentrations.
Figure 4 shows how the optimal current output time of 42.3 seconds was determined, while Figure 5 shows three current output times correlated with the various glucose solutions. Figure 5C, at 42.3 seconds, has a correlation of .97 and slope of −3.14E-9x with x representing the concentration of glucose and the intercept being −3.45E-7. The slope in this case is represented as negative due to the nature of the detection mechanism; however, the graph represents an increase in current with an increase in glucose concentration. In addition, the time point of 13 seconds, Figure 5B, shows a slope of −3.20E-9x with x representing the concentration of glucose, an intercept of −4.16E-7, and a correlation value of .93. Figures 5D to 5F show plots of normative residual data alongside the run order (glucose concentration). Figure 5D, time of 3 seconds, does not show randomization and would not be indicative of a good model. However, Figures 5E (current output time of 13 seconds) and 5F (current output time of 42.3 seconds) do not show visible pattern and implies that the linear model fits the data.
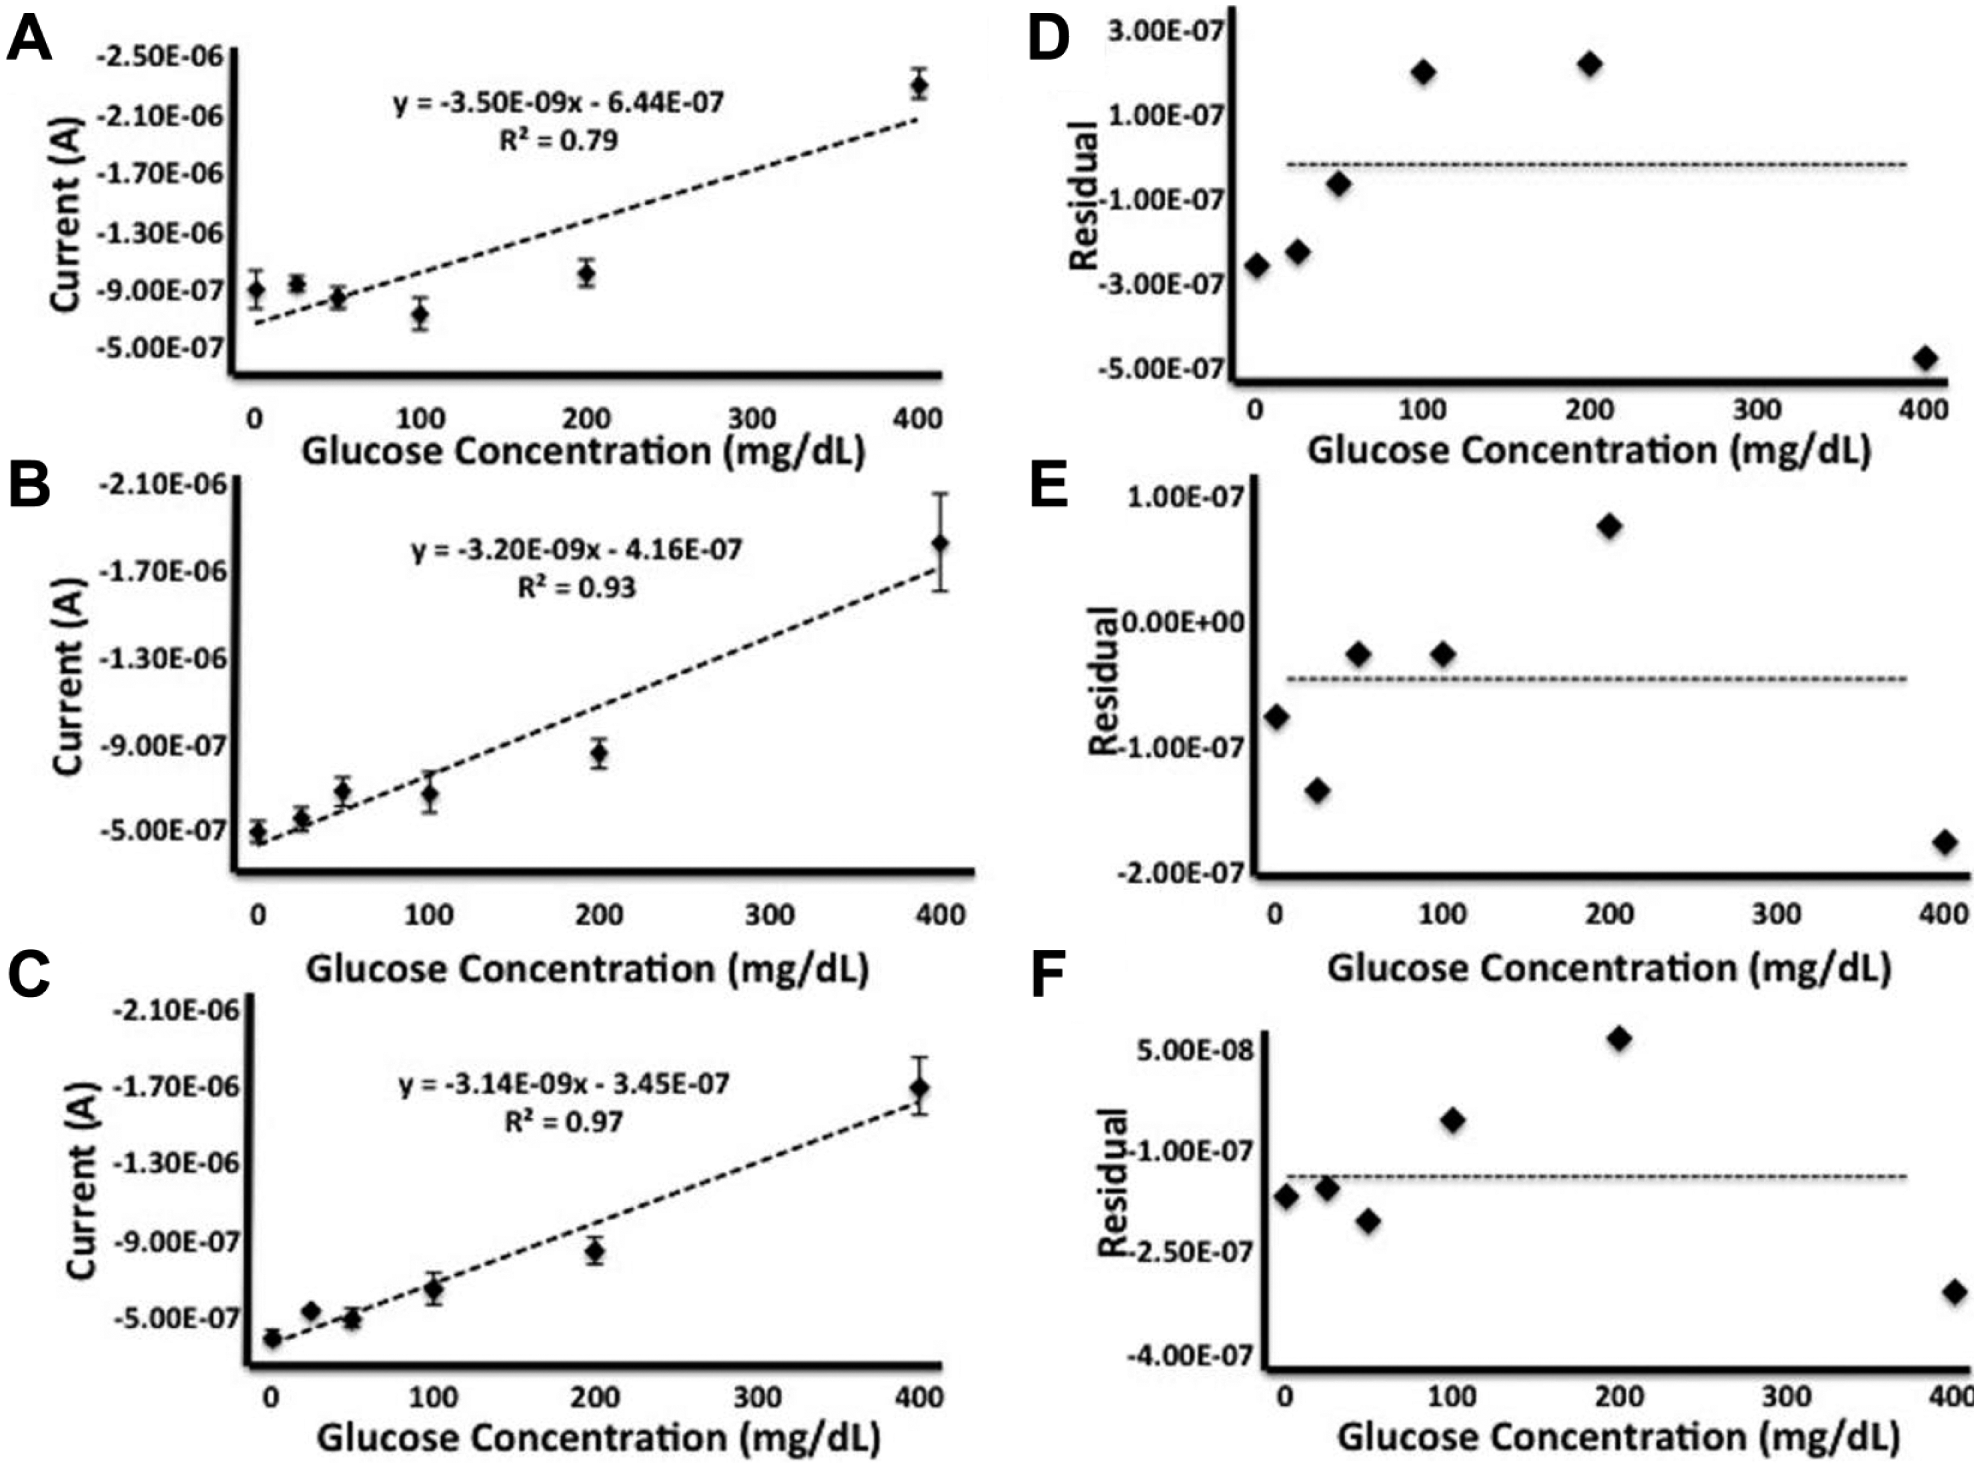
(A) Representation of the 3D-printed strip sensor calibration curve with glucose solutions based off current readings at 3 seconds (N = 4). (B) Representation of the 3D-printed strip sensor calibration curve with glucose solutions based off current readings at 13 seconds (N = 4). (C) Representation of the 3D-printed strip sensor calibration curve with glucose solutions based off current readings at the optimal time of 42.3 seconds (N = 4). Error bars shown for all figures are standard error. (D) Normal probability plot of residuals versus the glucose concentrations at time of 3 seconds. (E) Normal probability plot of residuals versus the glucose concentrations at time of 13 seconds. (F) Normal probability plot of residuals versus the glucose concentrations at time of 42.3 seconds. We can see in the residual plots after 10 seconds there is no obvious pattern when plotting the residual vs the run order, which is evident of a good model.
Figure 6 shows the similarity between the Zensor and the 3D-printed sensor. The R2 value of .97 is comparable to the Zensor correlation value of .99. Based off the standard residual plot, Figure 6B, the linear fit data are indicative of a good model. In addition, the slope values are no more than 3 times different. Two-tailed test analyses show only statistical significance between current readings in the 200 and 400 mg/dL readings; however, this shouldn’t be an issue as the sensor on its own has a strong response and correlation. Furthermore, the ULD was calculated to be 648.3 mg/dL.
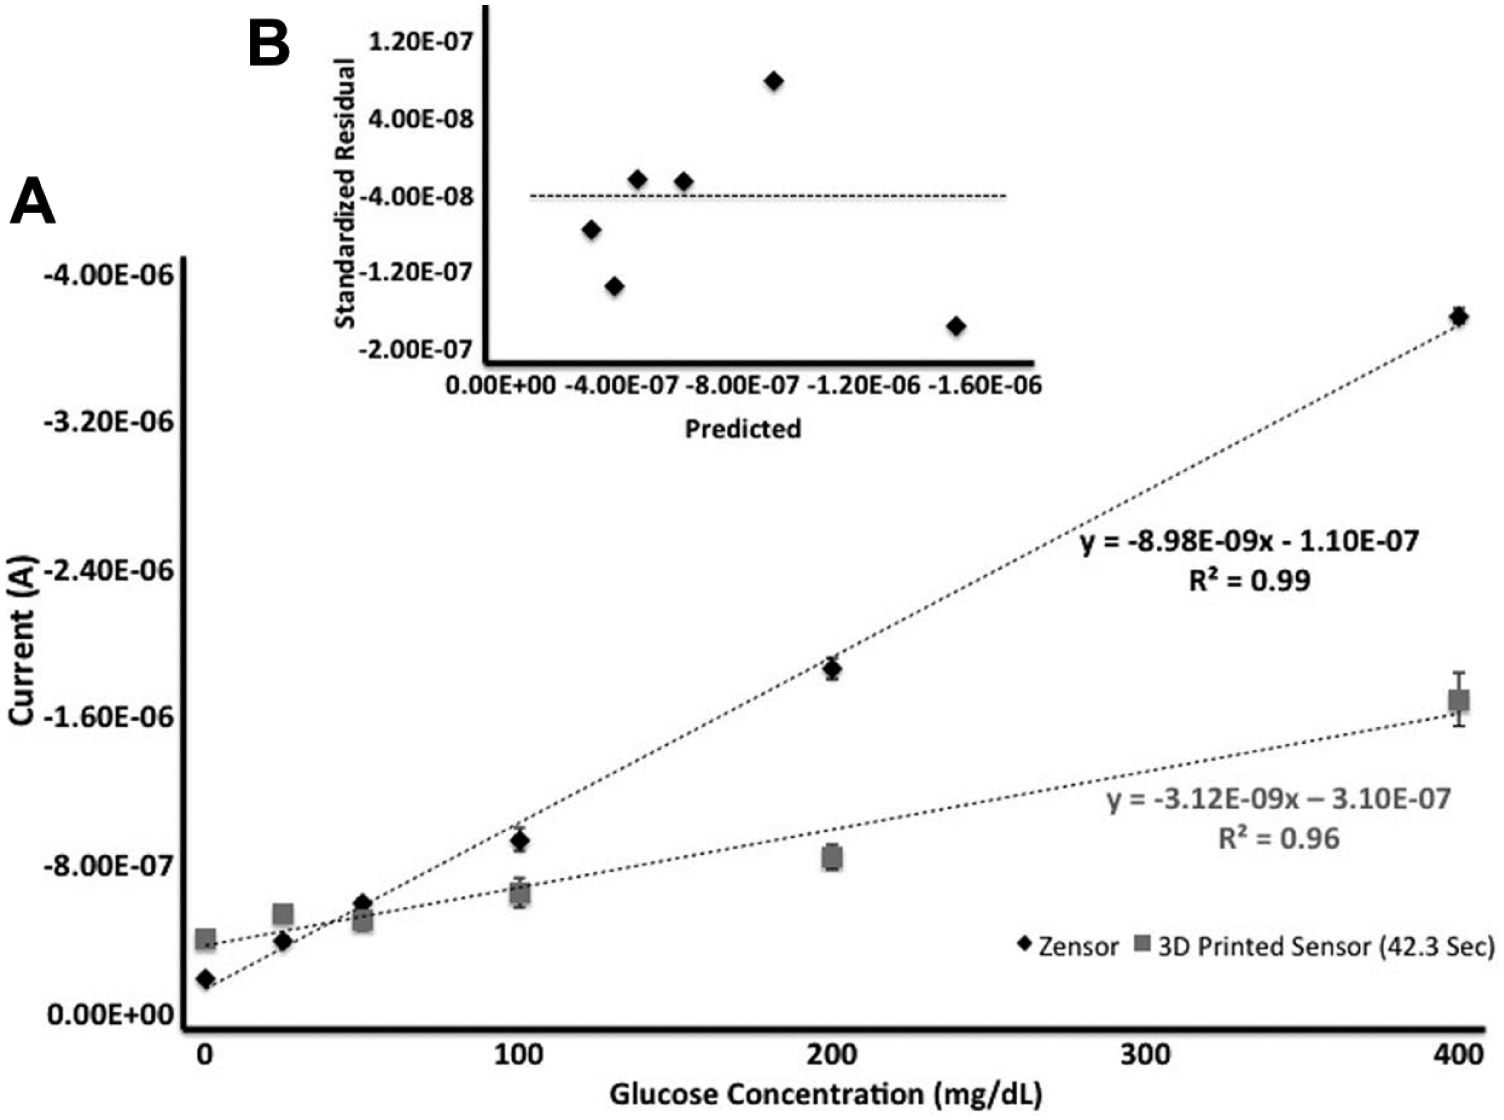
(A) Representation of the 3D-printed biosensor calibration curve with the glucose solutions based off current readings at 42.3 seconds (N = 4) alongside the Zensor calibration curve. (B) Normal probability plot of residuals versus the predicted current value for glucose concentrations at time of 42.3 seconds; there is no obvious pattern, which is evident of a model that fits the data.
Discussion and Conclusion
This research represents the first 3D-printed biosensor for individuals with diabetes. Figure 6 shows that this sensor was not only specific to glucose, but also was sensitive to glucose concentrations within the physiological range. 16 It was determined that the 3D-printed sensor could accurately detect glucose solutions between 0 mg/dL and 400 mg/dL. The linear fit on the data was determined to be appropriate based off the random dispersion of the residual plots in Figure 5. The differences in the slope between the screen-printed Zensor and the 3D-printed sensor are subtle. However, it should be noted that statistical differences were found only in the upper two glucose concentrations of 200 mg/dL and 400 mg/dL; however due to the strong .97 correlation and slope being the same magnitude as the Zensor, the data fit the model well.
Furthermore, it should be noted that due to using GDH-FAD, enhanced detection was possible. GDH-FAD is 25 times more enzymatic than glucose oxidase, which allows for faster and more accurate glucose detection. 17 This could be the reason why the slope and R2 value at 13 seconds, shown in Figure 4, had equally as strong of a response as the optimal current output time of 42.3 seconds. Accurate detection of glucose at 13 seconds (Figure 5B) is important as commercially available sensors produce an accurate glucose reading almost instantaneously. The residual plot, Figure 5E, further confirmed the accuracy of the linear fit model.
In addition, it should be noted that issues with low signal occurred due to differences in the density of the printed leads of the biosensor. To correct for this, the sensors were soaked in the enzyme solution containing GDH-FAD and redox mediator solution. Soaking the electrodes optimized the sensor by allowing the enzyme solution to fill in the pores of the printed sensor, which allowed for easier movement of electrons through the working sensor and increased the current output. Figure 2 shows the optimal soak time when compared to a Zensor. Due to the subtle inconsistencies in the 3D-printed sensor, the use of GDH-FAD provides a unique advantage over glucose oxidase enzyme.
The purpose of this study was to achieve physiological detection using a technique previously not utilized for manufacturing of biosensors. The 3D-printed sensor was compared to the lab/industry standard screen-printed sensor and was able to detect glucose levels with comparable results. This proof-of-concept study demonstrates the potential of the 3D-printed biosensor platform as an option for glycemic management. While efforts would still be needed to further optimize the 3D-printed sensor, this new manufacturing process has the potential to become an option for not only glycemic management but also additional biomarkers.
Footnotes
Acknowledgements
The authors would like to acknowledge support of this work to the La Belle Biosensor Lab and the Biomedical Engineering School of Biological and Health System Engineering. In addition, support from Chi Lin and Garrett Repp should be recognized.
Abbreviations
Amp i-t, amperometric-current-over-time; CAD, computer-aided design; CV, cyclic voltammetry; GDH-FAD, glucose dehydrogenase flavin adenine dinucleotide; PBS, phosphate-buffered saline; SMBG, self-monitoring blood glucose; ULD, upper limit of detection; WHO, World Health Organization.
Declaration of Conflicting Interests
The author(s) declared no potential conflicts of interest with respect to the research, authorship, and/or publication of this article.
Funding
The author(s) received no financial support for the research, authorship, and/or publication of this article.