
Abstract
Background:
Currently, glycemic management for individuals with diabetes mellitus involves monitoring glucose only, which is insufficient as glucose metabolism involves other biomarkers such as insulin. Monitoring additional biomarkers alongside glucose has been proposed to improve glycemic control. In this work, the development of a rapid and label-free insulin biosensor with high sensitivity and accuracy is presented. The insulin sensor prototype also serves as a prior study for a multimarker sensing platform technology that can further improve glycemic control in the future.
Methods:
Electrochemical impedance spectroscopy was used to identify an optimal frequency specific to insulin detection on a gold disk electrode with insulin antibody immobilized, which was accomplished by conjugating the primary amines of insulin antibody to the carboxylic bond of the self-assembling monolayer on the gold surface. After blocking with ethanolamine, the insulin physiological concentration gradient was tested. The imaginary impedance was correlated to insulin concentration and the results were compared with standard equivalent circuit analysis and correlation of charge transfer resistance to target concentration.
Results:
The optimal frequency of insulin is 810.5 Hz, which is characterized by having the highest sensitivity and sufficient specificity. The lower limit of detection was 2.26
Conclusion:
An insulin biosensor prototype capable of detecting insulin in physiological range without complex data normalization was developed. This prototype will be the ground works of a multimarker platform sensor technology for future all-in-one glycemic management sensors.
Keywords
Diabetes Mellitus (DM) encompasses a series of chronic metabolic diseases characterized by inadequate glucose metabolism. 1 It is quickly becoming a worldwide epidemic, involving nearly 30 million people in the United States, and costing nearly $250 billion. 2 According to the American Diabetes Association, by the year 2034 the number of diagnosed and undiagnosed people with diabetes will increase from 23.7 million to 44.1 million. 3 With such an increase in prevalence, there has also been a large need for next generation technology to help manage the disease with better portability and increased sensitivity. 4 Currently, diabetes management involves monitoring glucose levels daily, either discretely or continuously, and glycated hemoglobin (HbA1c) levels periodically.5,6 Overall, detection and monitoring of glucose levels is achieved through detection of a single marker: glucose. Recently, there have been strides to develop multimarker assays due to many studies showing monitoring of multiple biomarkers associated with a complex disease can enhance the accuracy of disease diagnosis, prognosis, management, and treatment.7-10 Figure 1 shows key biomarkers involved in glucose management 5 and measuring of these biomarkers can give a better understanding of a patient’s state of health. In addition, enhanced biomarker detection would extend to the development of multimarker simultaneous detection on a single point-of-care (POC) device.
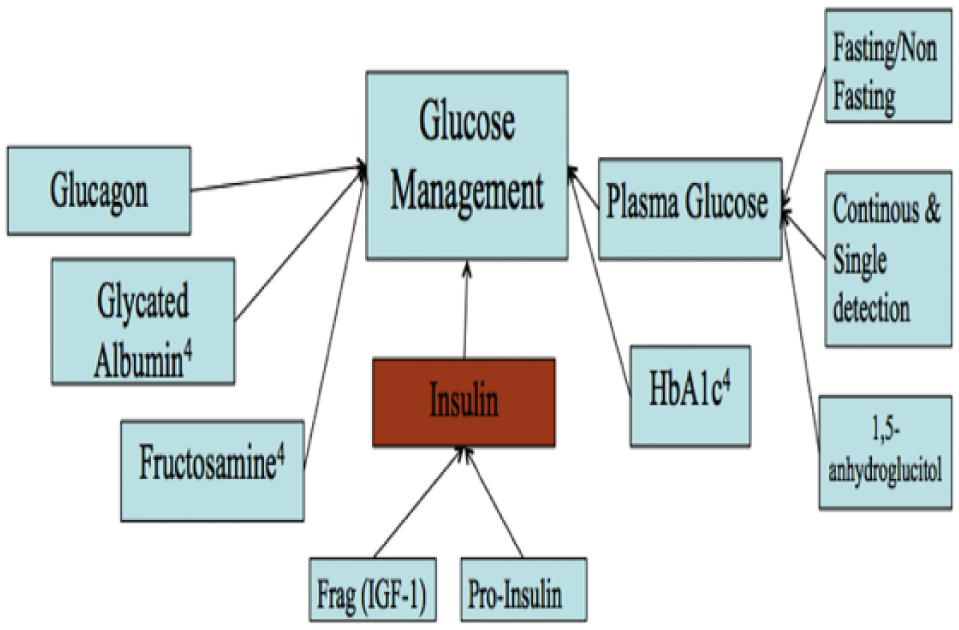
Representation of selective markers that influence glucose management.
Among the many biomarkers in Figure 1, insulin is a biomarker that directly affects glucose levels in achieving glucose homeostasis.11-13 The current SOTA for insulin detection are enzyme-linked immunosorbent assay (ELISA) and High Performance Liquid Chromatography (HPLC). While these techniques are specific and sensitive, they require specialized laboratory technicians and time consuming procedures.14,15 There is a need for a simple, label free, and rapid insulin sensor suitable for a POC setting in addition to a glucose sensor. In this paper we report the groundwork of a rapid and label-free insulin sensor using EIS.
The momentum on developing electrochemical insulin sensors has been rising in the past few years.16-19 Our group recently showed that, using the imaginary impedance of EIS, a biomarker will have an optimal binding frequency (OBF) at which the change in imaginary impedance best correlates to the change in target concentrations. 20 Furthermore, it would also be possible to measure two biomarkers, for example insulin and glucose, simultaneously by simply monitoring their impedance response at their respective OBFs, as suggested by our recent work in detecting low and high density lipoproteins simultaneously on a single sensor. 20 We have already characterized glucose previously using EIS and have shown its feasibility in glucose detection. 15 In addition to developing an insulin sensor prototype, this work aims to lay the ground work for a dual marker sensor capable of detecting glucose and insulin simultaneously as suggested previously, 20 which would improve glycemic control via controlling glucose and insulin levels concurrently. Once the initial response of insulin is characterized the dual-marker sensor prototype can be developed. Additional biomarkers can be later explored to eventually build a multimarker sensing platform monitoring all the major biomarkers of DM, providing the most accurate information for medical intervention and glycemic control.
Material and Methods
Reagents and Chemicals
All chemical reagents were purchased from Sigma (St Louis, MO, USA) unless stated otherwise. The 10 mM phosphate buffer saline (PBS) tablets were purchased from Calbiochem (Gibbstown, NJ, USA), potassium hexacyanoferrate (III) from EMD Chemicals (Billerica, MA, USA), and sulfo-derivative of N-hydroxysuccinimide sodium salt (NHS) from Toronto Research Chemicals (Toronto, Ontario, Canada). The redox probe reagent used was 100 mM potassium ferricyanide dissolved in pH 7.4 PBS.
Sensor Fabrication and Testing
The sensor consists of 3 electrodes: working gold disk electrodes (GDEs), reference silver/silver chloride electrodes, and counter platinum electrodes acquired from CH Instruments (Austin, TX, USA). All EIS measurements were performed at room temperature using a CHI660C Electrochemical Analyzer from CH Instrument at the electrode’s formal potential from 1 Hz to 100 kHz. A Buehler felt pad with 0.05 μg grit aluminum oxide particles was used to polish the GDEs with 10 figure-eight motions, followed by a 20-minute sonication in deionized water. After electrode polishing, cyclic voltammetry (CV) from −1.0 V to 1.0 V was used to obtain the formal potential and bare electrode EIS was performed to evaluate sensor cleanliness.
Once the sensors were cleaned, the SAM was created by incubating 1 mM of 16-mercaptohexadecanoic acid (MHDA) for one hour at room temperature. The sensors were then rinsed and stored dry overnight to ensure proper deposition of SAM, as SAMs takes hours to reach their final thickness and contact angles.21,22 The carboxylate groups of the 16-MHDA were activated by incubating the sensor in 10 mM 1-ethyl-3-(3-dimethylaminopropyl) carbodiimide (EDC) and 80 mM sulfo-NHS for one hour at room temperature. After rinsing with DI, 100 μL of 156 µM of insulin antibody prepared in pH 7.4 PBS was incubated onto the electrode surface for one hour. After rinsing with PBS the sensors were blocked with 1% ethanolamine for 30 minutes to block any remaining active sites, completing the sensor fabrication process. The schematic of sensor preparation can be found in Figure 2. The finished sensors were stored at 277.15 K until testing. All sensors were brought to room temperature before running each test. Insulin antigen gradients were prepared through serial dilution with PBS. Each sample contained 200 mM potassium ferricyanide and equal volume of insulin antigen to form 100 µL total solution volume. Final insulin samples were made according to the physiological concentration range from 0
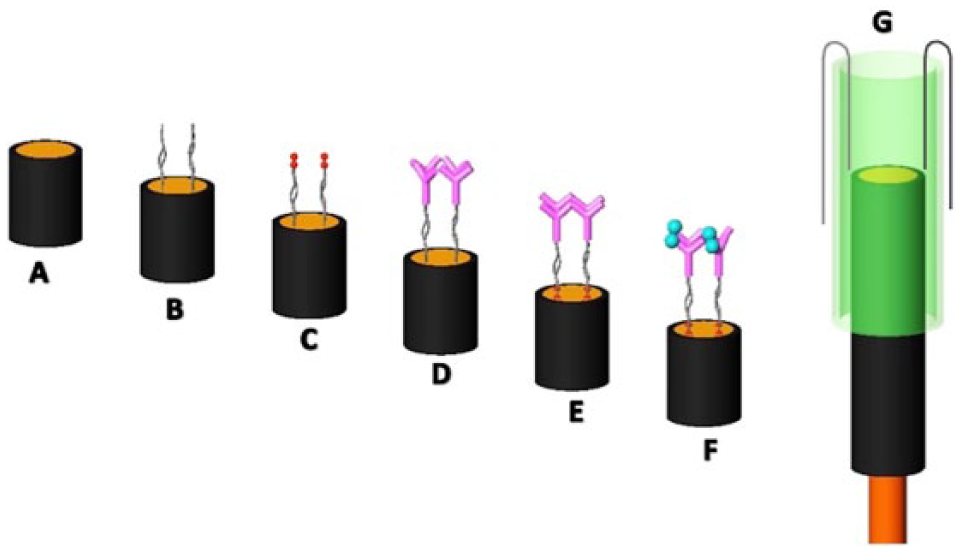
Scheme. This illustration shows sensor fabrication process and detection mechanism. (A) Bare GDE. (B) 1 mM 16-MHDA self-assembled linker. (C) EDC/NHS coupling. (D) immobilization of 156 MHDA self-assembled µM insulin antibody. (E) 1% ethanolamine blocking. (F) Binding of insulin antigen to antibody. (G) Electrochemical cell consists of a 1000 µL pipet tip with counter and reference electrodes.
Quality Control
Electrodes were prepared in batches of eighteen and all electrodes were analyzed using EIS. After measuring the post-MHDA impedance, the quality control (QC) was executed by selecting only the electrodes with similar peak frequencies and impedance magnitudes that are within 6% to 10% relative standard deviation (%RSD) or also called the coefficent of variance. Only the QC passing sensors would then proceed with immobilization.
Determination of OBF and Circuit Modeling
Once EIS was performed, the imaginary impedance values were correlated to target concentrations to calculate slope and R-square values (RSQ) across the frequency sweep. The OBF is the frequency at which the slope peaks with RSQ values above 0.85. All circuit modeling was performed using ZsimpWin software.
Results
Using the methods described above, the impedance responses from 7 electrodes were used to determine the OBF of insulin, which was found to be 810.5 Hz as shown in Figure 3. This relationship was evident in all 7 electrodes as the peak frequency shifts consistently when comparing all the post-MHDA results (Figure 3A).
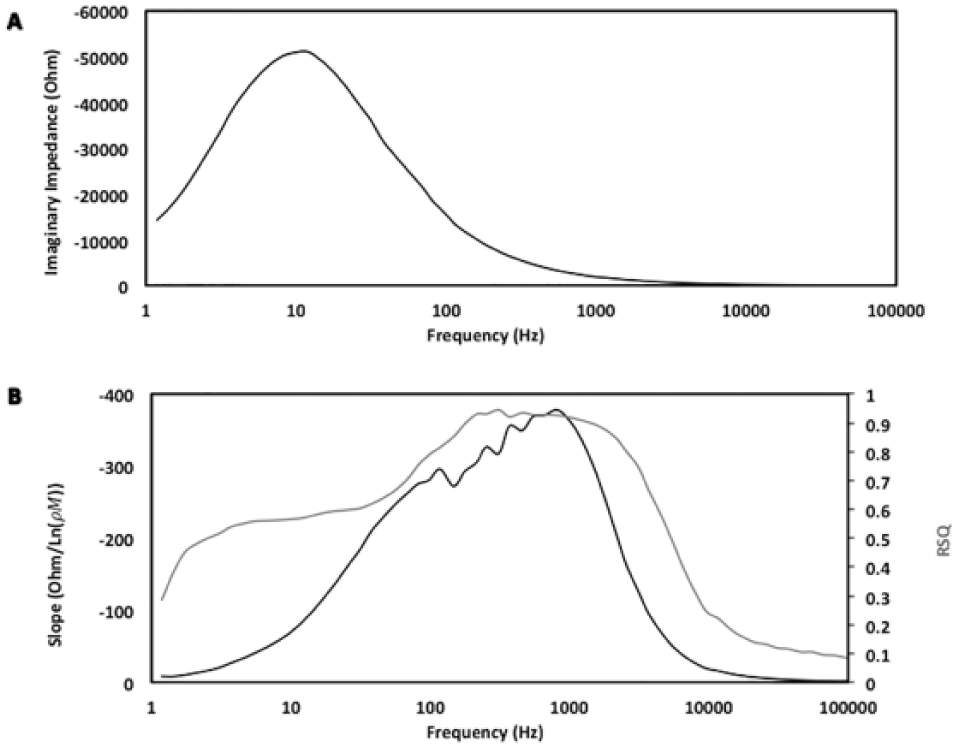
(A) This figure shows an example of the QC mentioned above while highlighting the average peak location and magnitude of the desired electrodes within the test data. (B) This figure shows the logarithmic fit (slope) and RSQ values by fitting the imaginary impedance against target insulin concentrations across the frequency sweep. 810.5 Hz was found to be the OBF at which both slope and RSQ peaked.
Figure 4 shows the relationship between the imaginary impedance and the target insulin concentration range (0
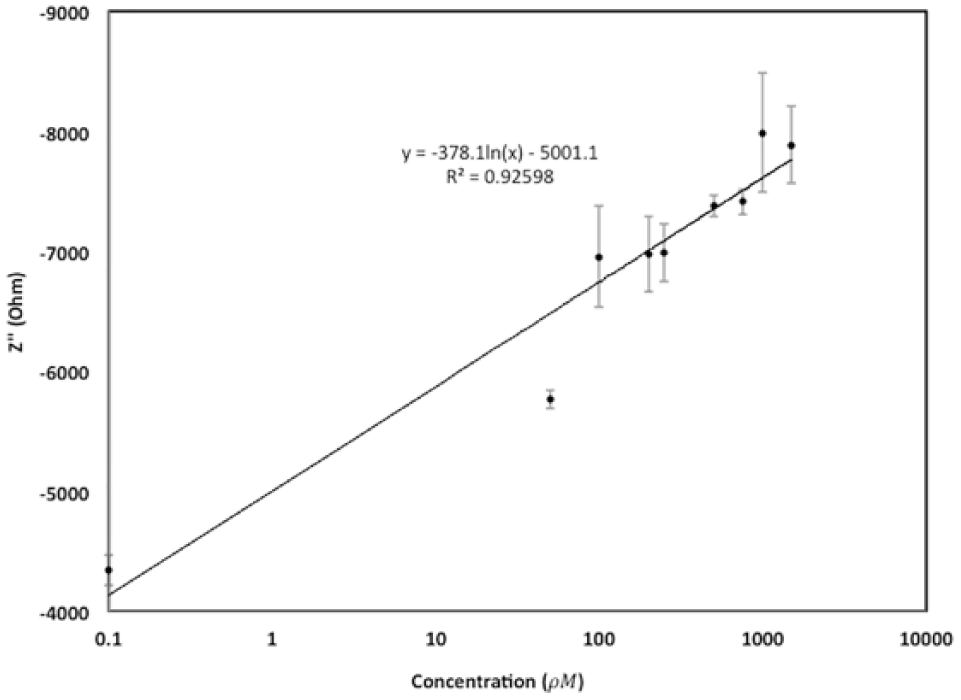
This is a representation of a calibration curve of 0, 50, 100, 200, 250, 500, 750, 1000, 1500
Using ZsimpWin, the ideal circuit model that best describes the electrochemical system of insulin sensor can be obtained (Figure 5). The solution resistance and the electron transfer resistance were both modeled as resistors and were labeled as Rsol and Ret, respectively. The pseudo-capacitor is modeled as Q and represents the piece of the system that can be correlated to the molecular recognition element being used. 20
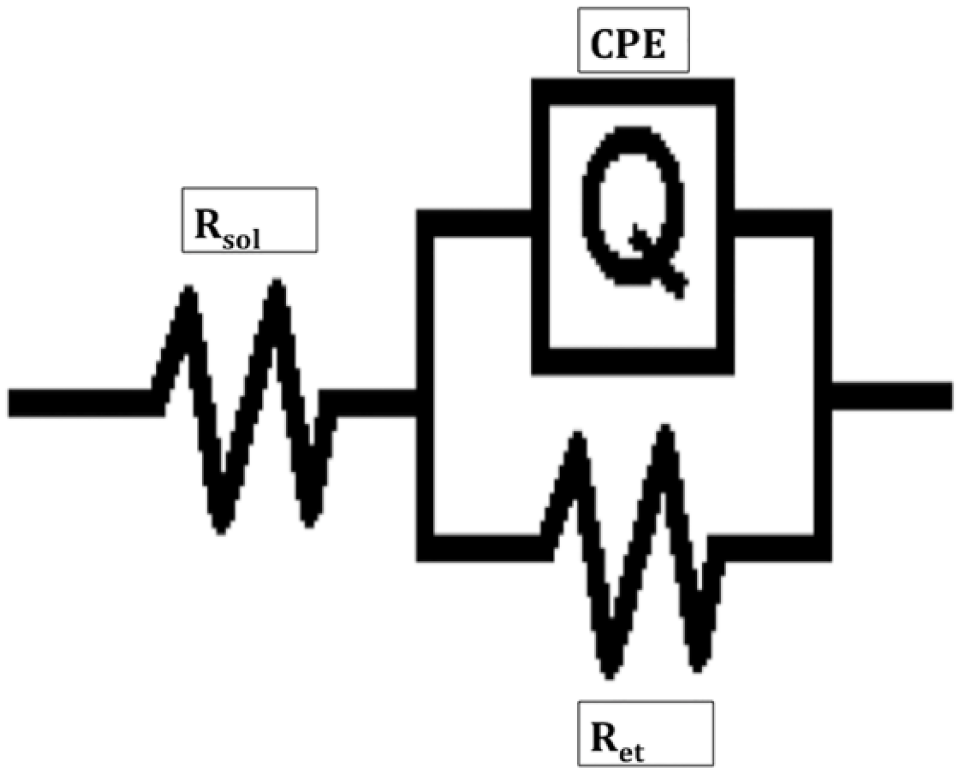
The image above is the circuit used to model the electrochemical cell. Rsol is the resistance due to solution, Ret is the electron transfer resistance. Q is used to represent the constant phase element (CPE) or the imperfect capacitor of the system.
Figure 6 shows the correlation between charge transfer resistance and target insulin concentrations derived from equivalent circuit modeling, a standard method of analyzing EIS data. 24
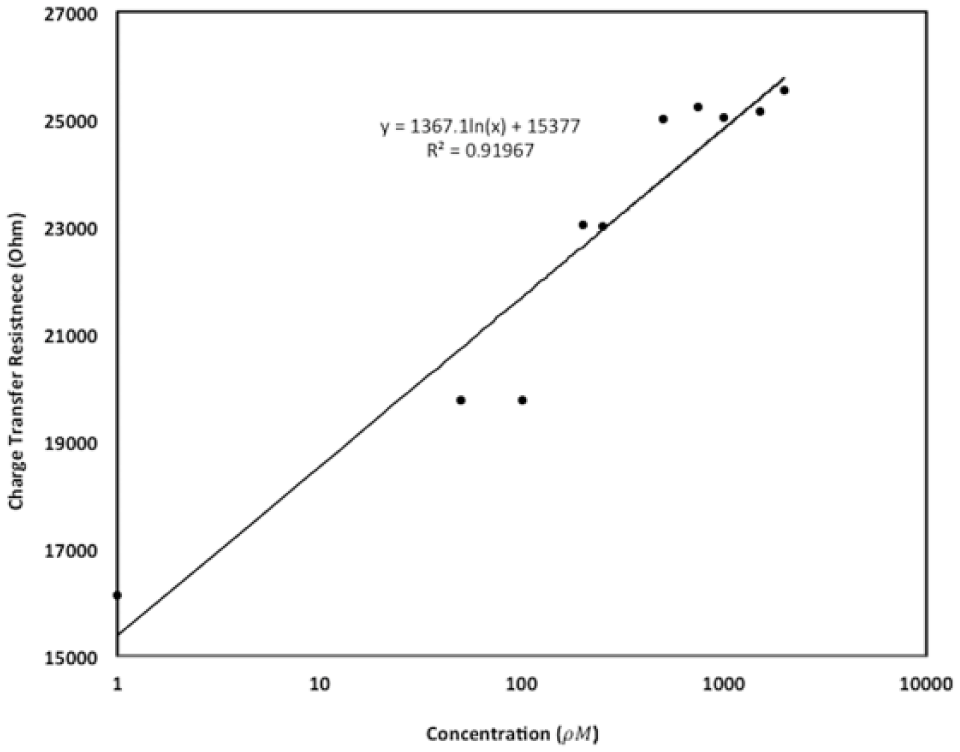
Calibration curve relating the calculated charge transfer resistance against the change in concentration of insulin in
Discussion
Electrochemical Impedance Results
Comparing the results between Figures 3A and 3B, it is evident that the shift in peak frequency is due to the binding of insulin antibody. The shifts are reproducible as the QC was executed rigorously. Since the slope peaks at 810.5 Hz with RSQ value of 0.93, 810.5 Hz is determined to be the OBF of insulin. However, it is important to note that there is often a trade-off between the sensitivity (slope) and specificity (RSQ) when considering the optimal frequency of EIS.
15
Figure 4 shows the calibration curve for purified insulin at 810.5 Hz. For insulin, a logarithmic fit with slope of −378.1 Ohm/Ln(
The lower limit of detection (LLD) and dynamic range are important parameters in determining the efficiency of the system. The LLD and dynamic range were calculated based off the standard deviation and slope of the system. The LLD was found to be 2.64
The Food and Drug Administration requires all glucose meters to be within 20% variance from standards. 27 Currently, the replicated results show that across all sample concentrations the %RSDs ranges from 5% to 26%, suggesting there are still room for improvements. Although batch analysis has helped eliminate some of the variance between GDEs, polishing and reusing GDEs is a significant source of variance as surface roughness of gold can affect SAM formation, 28 affecting the capacitance of imperfect parallel plate capacitor (IPPC) explained in later section. Transition to screen printed sensors will reduce the variance of surface roughness under consistent manufacturing procedures and rigorous QC.
We have shown that the EIS method of using imaginary impedance can very well detect insulin in the physiological range. Future studies will look into replicating the trials with much smaller concentration interval sizes such as 1 pM, which is equivalent to a gold standard ELISA to distinguish between even the smallest changes in concentration. Interference and clinical samples will also be tested to evaluate robustness and optimize further toward a POC device. This will lay a solid foundation for the multimarker platform sensor to truly enhance a person’s glycemic control. Last, unlike other publications on insulin detection there was no modification to the insulin solution via pH and extensive pre-post data modification.17,18
Circuit Analysis
Generally, EIS is analyzed with equivalent circuit modeling. Typically, the best-fit circuit for a semicircle looking Nyquist plot is the Randles circuit, which models the electrochemical interactions as a resistance-capacitor circuit in parallel. The electron transfer resistance can be used to derive a calibration curve linking back to input concentration.25,29 However, recently some researchers have demonstrated the use of a modified Randles circuit that implements a constant phase element (CPE) to model the capacitance.20,23,30 CPE is commonly referred to as either a leaky or imperfect parallel plate capacitor (IPPC). The bottom plate is the surface of electrode and the top plate is the top of the SAM with MREs immobilized owing to SAM’s insulating property.
31
The MREs different shape, orientation and size alter the smoothness of SAM in various ways, constituting the IPPC. As binding occurs, the target-MRE complex further alters the capacitance of the IPPC, affecting the electron transferring properties and impedance signals, which is evident in Figure 6. This model gives a better description of the actual system when compared to the ideal Randles. Since imaginary impedance correlates to capacitance,
24
we used imaginary impedance to correlate target concentration to reflect the impedance signal generated from changes in CPE, which we believe to have less noise than using the complex impedance approach and omits the trouble of circuit modeling. Owing to this nature, it’s no surprise that the LLD in imaginary impedance (2.64
Conclusion
An insulin biosensor prototype that has the potential to serve as a POC device alongside with glucose has been developed. Detection of insulin and other markers affecting diabetes patients will greatly enhance the ability of individuals with diabetes to better control their own blood glucose levels. With a reproducible LLD of 2.26
Future work includes transitioning to a disposable strip that is capable of insulin detection in clinical samples. Currently, we are starting to make screen printed electrodes (SPEs) using a MPM Accuflex Speedline screen printer in house. Depending on the dimension of the sensor, machine overhead and the amount of sensors fabricated, the current cost of a sensor can be as low as $1 per sensor with order size of 45 000 sensors. We hope to translate the insulin sensor prototype onto the SPEs manufactured in house to enhance QC and obtain a more practical insulin sensor prototype that can be translated to industrial mass manufacturing. In addition, once the insulin sensor has been truly optimized, the next step would be the design of dual-marker detection sensor using the imaginary impedance of EIS to detect glucose and insulin simultaneously at their respective OBFs. This would be ground breaking and would potentially provide next generation glycemic control to many people with diabetes.
Footnotes
Acknowledgements
We appreciate the help from the Mayo Clinic, Fulton School of Engineering, and the School of Biological Health and System Engineering.
Abbreviations
DM, diabetes mellitus; EDC, 1-ethyl-3-(3-dimethylaminopropyl) carbodiimide; EIS, electrochemical impedance spectroscopy; GDE, gold disk electrode; LLD, lower limit of detection; MHDA, mercaptohexadecanoic acid; NHS, N-hydroxysuccinimide; OBF, optimal binding frequency; PBS, phosphate buffer saline; POC, point-of-care; QC, quality control; RSD, relative standard deviation; RSQ, R-square values; SAM, self-assembling monolayer; SOTA, state of the art; SPSs, screen printed electrodes.
Declaration of Conflicting Interests
The author(s) declared no potential conflicts of interest with respect to the research, authorship, and/or publication of this article.
Funding
The author(s) disclosed receipt of the following financial support for the research, authorship, and/or publication of this article: The work was funded by Mayo Hospital grant ARI-209490