
Abstract
Background:
Multiple markers are used to assess glycemic control in patients with diabetes mellitus (DM). New technology that permits simultaneous detection of multiple biomarkers combined with those used at the point of care indicative of glycemic control, including glycemic variability determined from 1,5-anhydroglucitol measurement, could provide better management and further insight into the disease.
Methods:
This platform was based on previous research involving glucose detection and uses electrochemical impedance spectroscopy to detect a range of 1,5-anhydroglucitol concentrations at an optimal binding frequency. The enzyme pyranose oxidase was fixed to gold electrodes while a sine wave of sweeping frequencies was induced in purified solutions and in variable presence of whole blood.
Results:
The optimal binding frequency for the detection of 1,5-anhydroglucitol was found to be 3.71 kHz. The impedance response compared to the concentration of target present was found to have a logarithmic slope of 7.04 with an R-squared value of 0.96. This response includes 2 experimental sets, a single test of a low concentration range and a high concentration range with 5 replicates. The relative standard deviation of the high range varied from 28% to 27% from lowest to highest concentrations. Best detection in complex solutions was found in lower blood concentrations of 0.5% and 1%, but maintained relatively high accuracy in concentrations 5% and 10%.
Conclusions:
The sensor platform was successfully evaluated at a high dynamic range of 1,5-AG in purified solutions. In the presence of whole blood, lowest percentages yielded the best results indicating that filtering interferents may be necessary in final device architecture.
Keywords
Tight control of glucose in diabetes mellitus (DM) is crucial in the prevention of microvascular complications. 1 The 2 most common biomarkers employed to assess glycemic control are self-monitoring of blood glucose (SMBG) and hemoglobin A1c (HbA1c). However, if the patient fails to do SMBG or does not bring results to their practitioner, decisions cannot be made about therapy. In addition, HbA1c only represents an assessment of chronic hyperglycemia and does not reflect the extent of glycemic variability or postprandial hyperglycemia. 2 Thus, HbA1c and SMBG determinations may not provide sufficient information to create a glycemic profile for a patient with DM. Consequently, researchers and clinicians have been in search of alternative biomarkers as adjuncts to monitoring and treatment of hyperglycemia. 1
One potential alternative biomarker, 1,5-anhydroglucitol (1,5-AG), is typically obtained from the diet. 2 It is regulated by urinary excretion and 99.9% is reabsorbed by the kidneys, and circulating 1,5-AG concentrations are inversely related to blood glucose levels. 3 As glucose levels increase and reach the renal threshold of glucosuria, 1,5-AG levels decrease as excess 1,5-AG is excreted in the urine. Therefore, its reabsorption is competitively inhibited by glucose and poor glycemic control is associated with low serum 1,5-AG levels. 3 The utility of 1,5-AG may reside in its ability to better reflect the level of glycemic variability or severity of postprandial hyperglycemia. 4 Due to its dependence on the threshold of renal tubular reabsorption of glucose measurement of 1,5-AG is likely most applicable to patients whose diabetes is moderately controlled (HbA1c ≤8.0%).
GlycoMark is the only available clinical method to detect 1,5-AG through the colorimetric measurement of H2O2 from the oxidation of 1,5-AG by the enzyme pyranose oxidase (POx). 3 An alternative methodology for detection of 1,5-AG may be electrochemical impedance spectroscopy (EIS). 5 In EIS, an alternating signal is placed on a bias potential that scans frequencies from Hz to MHz as the impedance response at each frequency is measured. The promise of EIS rests on the principle that each unique reaction between a target and its molecular recognition element has optimal binding of its target at a frequency specific to that reaction. By attaching recognition elements for different biomarkers to a sensor surface, each target could be detected simultaneously by simply monitoring their optimal binding frequency. With modulation of these different frequencies, signals from each reaction on a single platform can be differentiated from one another and correlated with clinically relevant values. EIS technology could be adapted to allow point-of-care (POC) testing of 1,5-AG, thus making its measurement of greater utility to the clinician.
We have already demonstrated the feasibility of EIS in detecting glucose. 6 The further evaluation of EIS for 1,5-AG detection could lead to development of a novel device for measurement. Toward the final goal of developing a POC device for 1,5-AG measurement, the first steps of evaluation of using EIS to detect 1,5-AG are presented here.
Methods
Materials
Common reagents were purchased from either Sigma, Sigma-Aldrich (St. Louis, MO, USA) or Calbiochem (Gibbstown, NJ, USA), and pH electrode storage solution from Thermo Electron Corporation (Beverly, MA, USA). White New Zealand rabbit blood was obtained from Bioreclamation LLC (New York, NY, USA). All electrodes, including gold disk working electrodes, Ag/AgCl reference electrodes, and platinum counter electrodes were purchased from CH Instruments (Austin, TX, USA).
Purified Solution Testing
All electrodes were polished and treated using previously established techniques. Preliminary testing involved the same steps of immobilization as that of glucose testing. 6 As such, electrodes were prepared with an incubation of 1 mM 16-mercaptohexadecanoic acid (16 MDHA) for 1 hour. The electrodes were then incubated with N-hydroxysulfosuccinimide (NHS) and 1-Ethyl-3-[3-dimethylaminopropyl]carbodiimide hydrochloride (EDC) for an additional hour which served as the intermediate to prime the 16-MHDA for enzyme attachment. For this detection reaction, POx and 1,5-AG were used. When POx is in the presence of its cofactor, flavin adenine dinucleotide (FAD), and O2, it oxidizes 1,5-AG creating H2O2, its byproduct: 1,5-anaydro-D-Fructose, and a current that can be measured electrochemically. All solutions were made by suspending the powered form of each chemical in PBS.
The first immobilization was set up by incubating 100 uL of 0.8 mg/mL POx on 6 different electrodes for 1 hour after the priming step, followed by a blocking step of 1% ethanolamine to prevent nonspecific binding. 6 The EIS data collection was broken up into 2 immobilization sets. The first consisted of 9 different concentrations of 1,5-AG to be tested on each electrodes in increasing order of 0, 10, 20, 50, 100, 180, 200, 227, and 300 mg/dL. This tested the variability of the sensor over a broad range and is much greater than the average physiological level, providing information about the dynamic capabilities of the sensor setup and detection mechanism. A second immobilization on a single electrode was completed to test the sensor setup within a close physiological range. This consisted of concentrations 25 times less than the first immobilization so that the concentrations tested were 0, 0.4, 0.8, 3, 4, 7.20, 8, 9.08, and 12 mg/dL. All data collection was completed at specific steps using a CHI660C Impedance Analyzer. 6
During each EIS recording, 12.5 uL of 4 times each target solution was used so that the final concentrations listed above could be created. The solution was mixed with equal volume of 1.5 mg/mL FAD and 25 uL of 100 mM ferricyanide. Once sufficient EIS data were collected, the optimal binding frequency of the reaction was determined by comparing slope and R-squared values.
Complex Solution Testing
To verify that the sensor functions in the presence of blood, as this is what the final device will be measuring, New Zealand white rabbit whole blood was used. Percentages of whole blood ranging from 0.5%, 1%, 5%, 10%, 25%, and 50% blood by volume were used, with 1 concentration of blood per electrode concentration gradient. Therefore, each electrode had its gradient spiked with a different percentage of blood by volume. Concentrations of 1,5-AG, FAD, and ferricyanide were adjusted so that they diluted to the same concentrations as the purified testing when 50 uL of twice the blood concentration was added. Each test consisted of 12.5 uL of 200 mM ferricyanide, 6.25 uL of specific target concentration, 6.25 uL of FAD, and 25 uL of the specified blood concentration. For 50% blood, 100% blood stock was directly mixed with the testing solutions. All other concentrations were diluted to reflect the final concentration. Once the data were collected, the optimal binding frequency determined in purified solutions was monitored and the slope and R-squared values for each electrode were compared.
Results
Purified Solutions Testing
With the data collected from the first 6 electrodes, the optimal binding frequency was determined to be 3.71 kHz. Stable activity at this frequency was consistent in all electrodes within both concentration ranges explored. The relationship between measured impedance and tested concentration of 1,5-AG was compared at each frequency in the sweep. An example of determining the optimal binding frequency can be seen for a single electrode in Figure 1. Figure 1A shows high R-squared values for both the high and low concentration ranges with values of 0.81 and 0.94 respectively, and Figure 1B shows the slopes for both ranges when viewed at the optimal binding frequency.
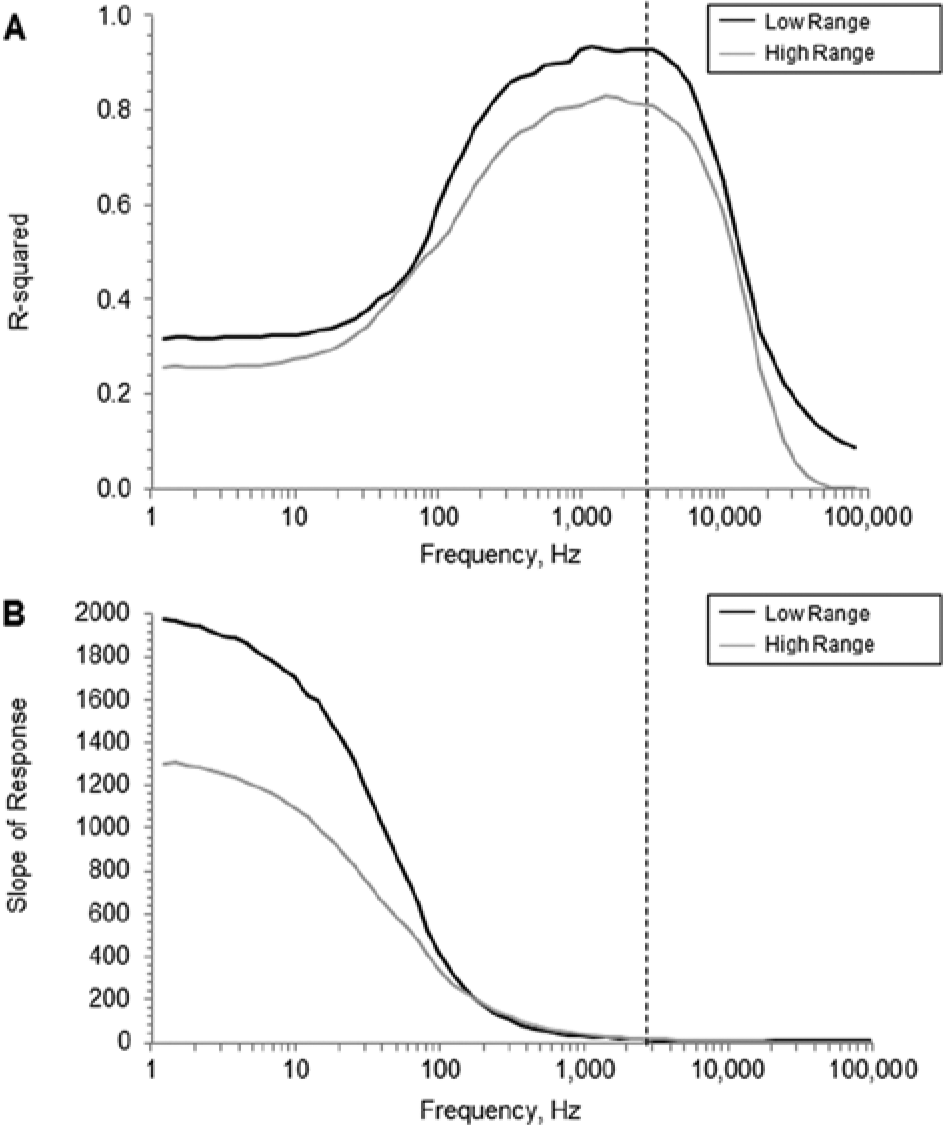
Optimal Binding Frequency. The optimal binding frequency for 1,5-AG can be seen predominately in A as the dashed line. It is at the edge of the plateau before the accuracy beings to decline at higher frequencies. The stable maximum falls roughly at 3.71 kHz for both high and low ranges. The R-squared and slope of the low range on a single sensor, in black, corresponds to values of 0.94 and 6.44 and of the high range on a single sensor, in gray of 0.81 and 9.74, respectively.
The response for the 6 electrodes tested at the high concentration range was compared to that of the response at the low concentration range. Figure 2 shows the relationship between the impedance response at the optimal frequency, 3.71 kHz, and the concentrations used in the gradient. Here, the slope of the averaged response is 7.04 ohm/(log(mg/dL of 1,5-AG)) and the associated R-squared value is 0.96. The relative standard deviation in range B from low to high concentrations was found to be 28.09%, 27.83%, 27.89%, 27.04%, 26.44%, 26.56%, 26.07%, and 27.20%. In range A, the lowest concentration of 0.8 mg/dL corresponds to an approximate mean postmeal maximum glucose of 190 mg/dL. 4 In range B, the lower limit of detection (LLD) of the 6 electrode average was calculated to be 27.29 mg/dL.
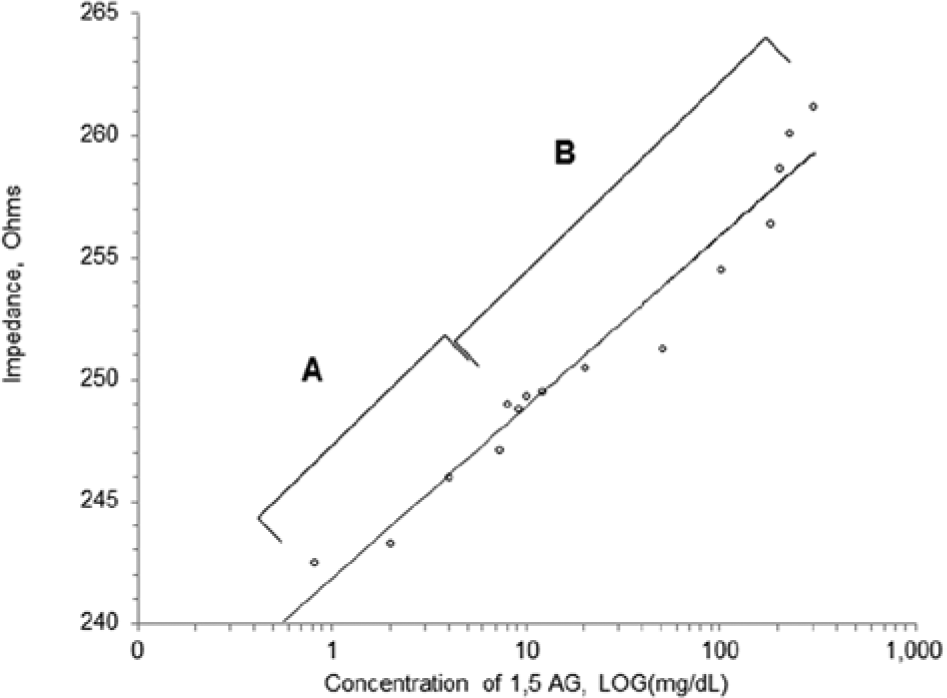
Dynamic range. This is the averaged relationship between the measured impedance response and its corresponding concentration of 1,5-AG. Range A represents the response of a single electrode with a range of 0.8 to 12 mg/dL. Range B represents the response of 6 total electrodes with a range of 10 to 300 mg/dL. The averaged slope for both range A and range B as represented by the line, is 7.04 with an R-squared value of 0.96. For fitting purposes, the 2 lowest concentrations in range A and blank concentration in range B have been removed.
Last, the response in complex solution was compared at 3.71 kHz for each percentage, including purified results representing 0% blood. Figure 3 represents the decline of R-squared values as the percentage of blood present increases.
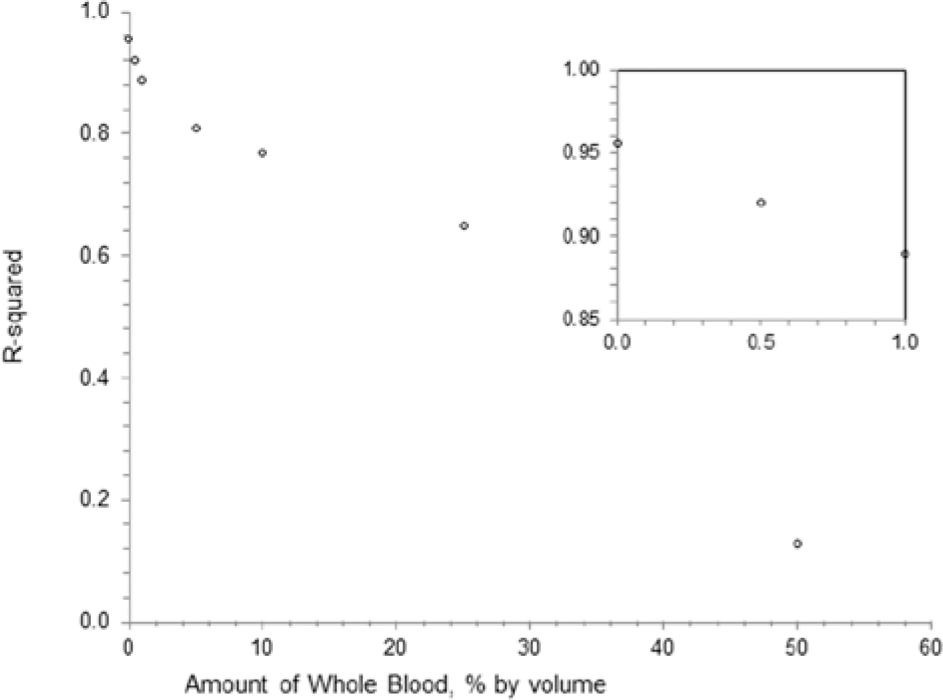
Detection in complex solution. This represents the R-squared of each concentration of whole blood tested including the averaged purified data, representing 0% blood, as well as 0.5%, 1%, 5%, 10%, 25%, and 50% whole blood. The inset represents the lowest 3 percentages, 0%, 0.5%, and 1% whole blood with corresponding R-squared values of 0.96, 0.92, and 0.89. 0% whole blood represents an averaged response of 6 electrodes and all other data points reflect data from a single electrode.
Discussion
The optimal binding frequency for 1,5-AG (3.71 kHz) was reoccurring in all electrodes tested within the high range. The high and low ranges were very similar in pattern for both R-squared and slope of response as frequency increased. In Figure 1A, the lower range had a higher accuracy for a broader range of frequencies, including the optimal frequency, indicating that the sensor may be more successful at detecting lower concentrations of 1,5-AG and that there may be a more specific frequency applicable to the lower concentration range. In addition, the lower frequencies magnified the response of the low frequency range. In Figure 1B, although the R-squared is very low at a value of 0.3, the low range has a much higher slope; this is also seen at the optimal frequency and indicates that the sensor is much more sensitive to a lower range of 1,5-AG.
Although the slope of the low range was slightly higher than that of the high range, when combined in a single graph they correlate very similarly with high accuracy; the combined R-squared value is 0.96. In range A of Figure 2, the first 2 concentrations, 0 and 0.4 mg/dL, yielded impedance levels near that of the first data point 0.8 mg/dL, this could indicate the actual LLD of the sensing mechanism used. To determine the exact LLD, more experiments in low ranges would be necessary as the standard deviation is used to calculate LLD. However, since the lowest point in Figure 2 correlates to a glucose concentration of 190 mg/dL, and the corresponding glucose value decreases as 1,5-AG increases, this apparatus would be useful in normal to hypoglycemic ranges. A slight linear effect was observed on the data when the blank was included for range B, yet the linear slope was very close to zero. As a result, the blank data point was removed. The blank data point is usually adjusted, but the value to which is set is an arbitrary value to best fit the data set. For this adjustment to be accurate, more testing in the lowest ranges of 1,5-AG would be needed, with smaller step sizes.
Overall, the combined slope is relatively high as it reflects the change in impedance compared to the change of the log (mg/dL) and magnifies the log effect. The R-squared value is very high with a value of 0.96. Although this was completed on 6 electrodes total for range B, with the response averaged, the relative standard deviation (RSD) is slightly higher than desired with values ranging from 26% to 28%, with 28% RSD at the lowest concentration. These preliminary values reflect raw data with no lot assessment or mass manufacturing techniques. The higher RSD could be due to both slight experimental changes between concentrations and electrode sets as well as to setup inconsistencies. The response can vary based on what is present on the surface of the electrode and in solution. This means the concentration of the enzyme, or packing density, on the surface of the electrode can have an effect. Residual 1,5-AG present in the testing well and near the electrode surface, due to poor rinsing, can also have an effect. The sensor setup presented here does not necessarily reflect the final device architecture. Future experiments have much room for optimization with respect to the manufacturing and development of the sensor platform.
The results in Figure 3 demonstrate better detection in the lower concentrations of blood than the other concentrations. These lower concentrations include 0% blood by volume, followed by 0.5% and 1%. Concentrations 5% and 10% have relatively high R-squared values of 0.81 and 0.77, respectively. This behavior is not surprising, as the presence of whole blood in previous experiments lowered target detection. 6 Such interferents causing nonspecific binding or lack of detection may be avoided with the use of promising mesoporous carbon with embedded enzymes and adjustable pore size. This has already been demonstrated with use of glucose oxidase for amperometric glucose detection. 7 As the research for 1,5-AG detection is preliminary, replicates of detection in complex solutions may yield better accuracy in higher concentrations of blood, requiring only dilution in the final device architecture rather than the use of embedded molecular recognition elements or nonspecific binding protective coatings. 8
As it can be seen in Figure 1, the optimal binding frequency for a particular sensor may not be a single frequency, but rather a range of frequencies with an optimal plateau. Only a more narrow range can be found by evaluating more sensors and determining the average. Manufacturing processes may be able to eliminate the range of the plateau and variation between sensors. In the event that there is still an optimal range that is wide enough so that multiple biomarker ranges overlap, the signals will need to be adjusted. One way to separate the signals is with use of metallic nanoparticles as demonstrated with interleukin biomarkers. Nanoparticles varying in size and material can be attached to the molecular recognition elements individually prior to their incubation of the immobilization process. 9
Even with data collected on various biomarkers, 9 a device utilizing this EIS platform will only become a part of a competitive market when all standards and practices established by the Food and Drug Administration are met. Although limited information is available on each biomarker individually, using standards in place for glucose, such as for the SMBG, the device can be more quickly approved. This specifically includes that the RSD for the device of the target, glucose, is no greater than 20%. 10
In previous glucose detection using EIS, the RSD was much lower than that found with 1,5-AG (12% compared to 28% at the lowest concentration). Even though glucose and 1,5-AG both required enzymes in their detection, the glucose oxidase used was a type X that included its cofactor, FAD, directly in the enzyme molecule. In the case of 1,5-AG, FAD was added in solution at the time of experimentation. The amount added was in excess of pyranose oxidase so that an abundant amount was available no matter the amount of enzyme immobilized. Although this amount varied by sensor due to the 16-MHDA linker, incubation time physically limited the maximum amount of enzyme immobilized. As a result, the excess FAD present in solution may have an effect on the ability of sensor to detect 1,5-AG, and may have had caused the higher impedance at the blank concentration points, as omitted from Figure 2. As replicates were completed where appropriate, the actual LLD and RSD of physiological ranges would be determined from additional testing and not directly from the higher range of 1,5-AG. Nevertheless, the preliminary results are promising, as without replication in the low range of 1,5-AG, and 5 replicates in the high range, an accurate model of the relationship between impedance and broad 1,5-AG concentration was found.
All biomarkers currently used for glycemic monitoring and clinical evaluation have limitations. For example, glucose detection is affected by a low hematocrit, certain drugs, 11 stroke, myocardial infarction, 12 thyroid, adrenal, and pituitary gland dysfunction, neurological conditions, and severe trauma. 13 HbA1c detection is affected by conditions including anemia, hemoglobinopathy, and blood transfusions. 2 HbA1c has also been found to have only a small correlation with glycemic variability when compared to glucose and 1,5-AG. 3 As with glucose and HbA1c biomarkers, 1,5-AG also has its limitations. Concentrations of 1,5-AG are affected by pregnancy, extreme hypertriglyceridemia, chronic liver disease or alcoholism, renal impairment, gastrectomy, and cystic fibrosis. 2 The physiological range of 1,5-AG that corresponds to glucose levels vary by the individual and particularly by gender. 14 External factors may also impact the use of 1,5-AG as a glycemic indicator. With growing interest in sodium-glucose linked transporter-2 (SGLT-2) as a new therapy, 1,5-AG levels may not accurately represent glucose control in those patients undergoing SGLT-2 treatment.
As each biomarker has certain limitations and reflect glucose control on a different time scale, it would be advantageous to measure each biomarker in a combined sensor. The practitioner would be given multiple parameters from POC on which to base clinical decisions regarding hyperglycemia treatment. EIS is a technology that would lend itself to develop this multimarker glycemic assessment platform (MMGAP). To incorporate these findings into an MMGAP, other biomarkers of interest must be evaluated. Such biomarkers already mentioned include HbA1c and glucose, but others of interest include insulin and beta-hydroxybutyrate, all of which would provide distinct insight into the metabolic state of the patient with diabetes. 15 For each unique system, the reaction between the specified target and its associated molecular recognition element would need its binding frequency verified in purified solutions as demonstrated in Figure 1 for 1,5-AG. This would require the simultaneous immobilization of different recognition elements specific to the biomarkers to an individual sensor surface. The variation of recognition element ratios would be necessary so that detection resolution would not be lost. Only after the unique frequencies are determined can testing in complex solutions, such as blood, begin.
Conclusions
The evidence presented here indicates that 1,5-AG can be detected at both low and high physiological levels using EIS methods. Purified solution testing demonstrated a dynamic range of the sensor and platform detection capabilities, but requires additional testing to establish a more accurate LLD. Although the RSD was only 6% above the desired level, this reflects the higher range of 1,5-AG only. Nevertheless, accuracy between electrodes can optimized with manufacturing processes that are more reproducible which replace steps which are completed by hand. These experiments show proof of concept that in very low levels of blood 1,5-AG can be detected over a high concentration range, and that 1,5-AG is still detectable in ranges of blood between 5% and 10% blood by volume. Potential interferences including combined drug therapies as well as interaction effects between 1,5-AG and additional relevant biomarkers before final device development.
Footnotes
Abbreviations
DM, diabetes mellitus; EDC, 1-Ethyl-3-[3-dimethylaminopropyl] carbodiimide hydrochloride; EIS, electrochemical impedance spectroscopy; FAD, flavin adenine dinucleotide; HbA1c, glycated hemoglobin; LLD, lower limit of detection; MMGAP, multimarker glycemic assessment platform; NHS, N-hydroxysulfosuccinimide; PBS, 10 mM phosphate buffer and 2 mM KCL; POC, point-of-care; POx, pyranose oxidase; PPG, postprandial glucose; RSD, relative standard deviation; SGLT-2, sodium glucose linked transporter-2; 1,5-AG, 1,5-anhydroglucitol; 16-MHDA, 16-mercaptohexadecanoic acid.
Declaration of Conflicting Interests
The author(s) declared the following potential conflicts of interest with respect to the research, authorship, and/or publication of this article: A patent disclosure has been filed on this work with Arizona Technology Enterprises (AzTE).
Funding
The author(s) disclosed receipt of the following financial support for the research, authorship, and/or publication of this article: Funding was received through the Fulton Undergraduate Research Initiative and Innovation Challenge program, but also through support from Arizona State University’s School of Biological Health Systems Engineering.