
Abstract
Background:
A novel software application, Blip, was created to combine and display diabetes data from multiple devices in a uniform, user-friendly manner. The objective of this study was to test the usability of this application by adults and caregivers of children with type 1 diabetes (T1D).
Methods:
Patients (n = 35) and caregivers of children with T1D (n = 30) using an insulin pump for >1 year ± CGM were given access to the software for 3 months. Diabetes management practices and the use of diabetes data were assessed at baseline and at study end, and feedback was gathered in a concluding questionnaire.
Results:
At baseline, 97% of participants agreed it was important for patients to know how to interpret glucose data. Most felt that clinicians and patients should share the tasks of reviewing data, finding patterns, and making changes to their insulin plans. However, despite valuing shared responsibility, at baseline, 43% of participants never downloaded pump data, and only 9% did so at least once per month. At study end, 72% downloaded data at least once during the 3-month study, and 38% downloaded at least once per month. Regarding the software application, participants liked the central repository of data and the user interface. Suggestions included providing tools for understanding and interpreting glucose patterns, an easier uploading process, and access with mobile devices.
Conclusions:
Collaboration between developers and researchers prompted iterative, rapid development of data visualization software and improvements in the uploading process and user interface, which facilitates clinical integration and future clinical studies.
Keywords
Intensive insulin therapy is known to improve glycemic control and prevent long-term complications in people with type 1 diabetes (T1D).1,2 This requires monitoring blood glucose levels several times each day, determining the carbohydrate content of each meal, and considering level of physical activity and overall well-being to self-adjust insulin doses. To achieve this, people with T1D use multiple devices, including glucose meters, continuous glucose monitoring (CGM) systems, insulin pumps, and food and activity-related software or mobile applications. In addition to using these devices for real-time decisions, people with T1D and their health care providers can periodically review their diabetes data (ie, blood glucose levels, food information, amount and type of insulin doses) to identify patterns to help adjust their insulin regimens (basal insulin, insulin to carbohydrate ratios, and insulin sensitivity factors).3,4 This retrospective review of glucose patterns in the context of meals and activity, with subsequent revision of insulin regimens, may be done by the patient on their own or with assistance from their health care provider. These practices are essential for optimizing insulin regimens and maintaining blood glucose within optimal target ranges in all patients with T1D but are particularly important in children and adolescents whose insulin needs change frequently. 5 The importance of retrospective review of diabetes data was emphasized in a recent consensus statement from the American Association of Clinical Endocrinologists (AACE) and American College of Endocrinology (ACE), which strongly recommended that patients view and use their own diabetes data. 6
Despite expert recommendations, few people with T1D download and review device data regularly on their own.7,8 In the T1D Exchange Clinic Registry, only 27% of CGM users downloaded data from their devices monthly. 7 Similarly, we have reported that at our center, 69% of adults with T1D and 44% of caregivers of children with T1D never downloaded data from their devices, and only 12% and 27%, respectively, routinely reviewed their device data. 8 People with T1D may forgo downloading and reviewing data because the process of downloading is challenging. Patients cited difficulties or lack of familiarity with the data downloading process, incompatibility of device software with home computers, and dissatisfaction with existing software user interfaces as obstacles to retrospective data review. 8 In addition, many people with T1D use multiple devices from different manufacturers, which require custom cables and proprietary software for uploading data.9,10 The AACE/ACE consensus guidelines recommended that insulin pump and CGM data should be downloadable on the same platform, and all data should be displayed in the context of meals, exercise, illness, and insulin boluses. 6 Efforts have been made to standardize the display, improve interoperability of diabetes devices,11,12 and combine information from various vendors.13-17 Despite these efforts, there is still no software application that easily uploads and completely integrates data from all brands of glucose meters, insulin pumps, and CGM devices; few efforts are directing visualization and accessibility toward patients.
The Tidepool platform is a cloud-based software platform that was built to address the lack of data interoperability amongst diabetes devices. 18 It collects data from multiple device vendors and allows third-party software applications (“apps”) to be built on the platform and use the data in a device-agnostic manner. The principal premise of the nonprofit, open-source project is to simplify the process of data acquisition from multiple devices and make data more accessible and actionable. To achieve this, a novel internet-based application for data visualization and interpretation (Blip) was created. 18 Here, we describe a pilot study of the usability and feasibility of the software application in clinical practice. We assessed the influence of having access to the software on the frequency of device uploading and data review by patients at home. Our primary objective was to use participant feedback to refine the software application for implementation in clinical practice and in larger scale research studies.
Methods
Software Application
The development of the data visualization software application and data platform has been previously described. 18 Briefly, the software is a web-based application that was developed through a collaborative effort between diabetes clinicians, researchers, and software developers (Tidepool Project, San Francisco, CA). The application combines the user’s data from multiple diabetes devices (eg, glucose meters, insulin pumps, and CGM) into a single visual display (Figure 1). Users can download and launch a separate app (Blip Notes) on their mobile devices, to enter contextual comments on food, exercise, or other life events, which are time-stamped and posted in real-time in the web application in the context of the device data. Thus, data from insulin pumps (blood glucose data, insulin bolus events, basal insulin infusion rates, and insulin pump settings), CGM, and self-reported activity (meal information, exercise, illness, menstruation, vacations, etc) can be viewed in a single user interface. User-driven changes in insulin dosing (bolus overrides, extended boluses, temporary basal rate adjustments, etc) are clearly displayed.
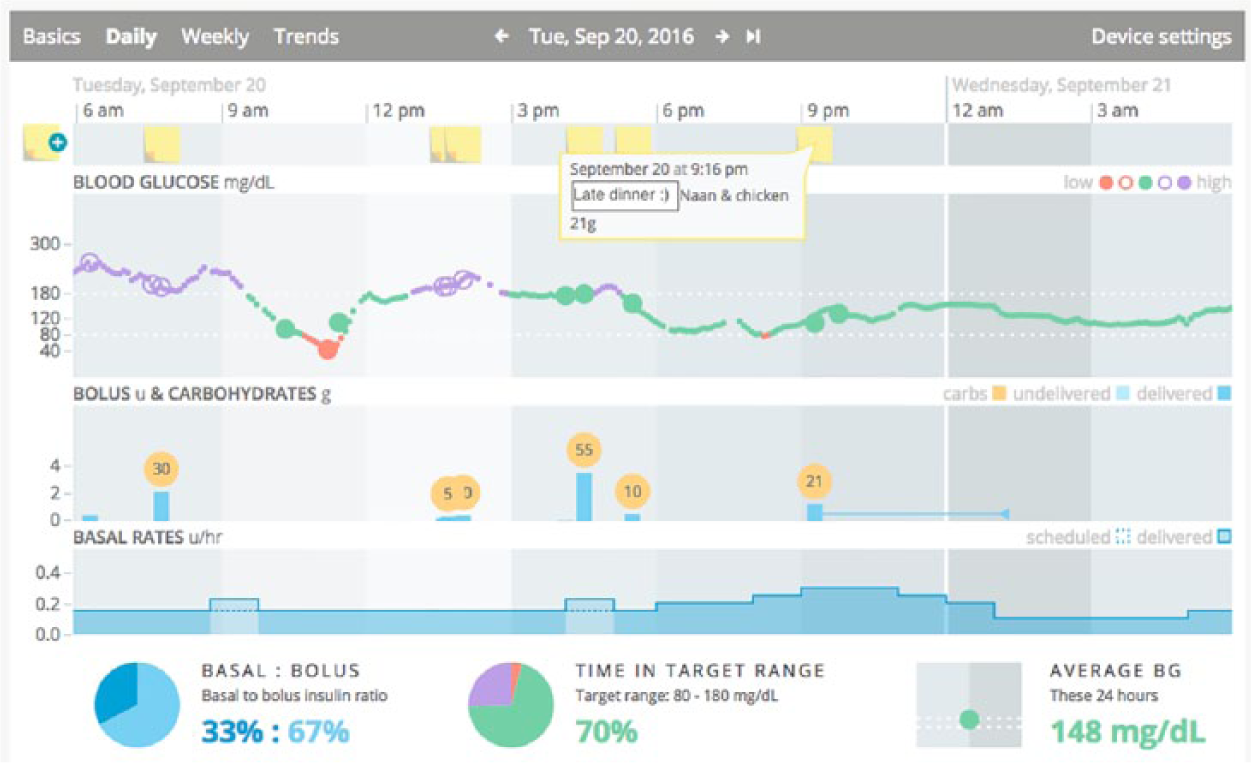
Screenshot of the novel software application for diabetes data visualization. Users can view their glucose meter, insulin pump, and CGM data together with contextual notes added from a second mobile app (Blip Notes). In this Daily view, 24 hours of data are displayed, and the user can scroll to earlier or later times by navigating using the arrows at the top of the screen. User-generated contextual notes from the mobile app appear as yellow “sticky notes” in the top panel, and details can be viewed or edited by clicking on the note. In the “Blood Glucose” panel, CGM data are shown as a series of small dots, and glucose meter data are represented by larger dots. High blood glucose values (>180 mg/dl) are in purple, values between 80 and 180 mg/dl are in green, and low values (<80 mg/dl) are in red. In the “Bolus & Carbohydrates” panel, insulin boluses delivered by the insulin pump are shown as blue columns, with extended boluses represented by an additional horizontal blue line. Carbohydrate amounts (in grams) entered into the pump are shown in the yellow circles. Details about each bolus can be viewed by moving the cursor and hovering over the bolus column. In the “Basal Rates” panel, basal insulin rates delivered by the pump are shown as solid lines, with dashed lines indicating programmed rates if a temporary basal rate was used at that time. At the bottom of the screen, statistics for the displayed 24 hours are shown for percentages of basal and bolus insulin given, time in target range, and average blood glucose (BG) values. Additional screenshots may be viewed at http://tidepool.org/documents/.
To use the application, a user creates a secure account through the web interface. At the time of the study, users could upload data from insulin pumps or CGM devices as per the device software. Cables and hardware for downloading were provided to participants. Using the application website, data from the device manufacturers’ software were uploaded into the novel data visualization application, where they could be viewed alongside contextual data.
Participants
All participants received care in our pediatric or adult diabetes centers and included caregivers of children with T1D, and adolescents (≥13 years) and adults with T1D using insulin pumps. Recruitment was done by consecutive sampling at routine clinic visits, and enrollment occurred between June 2014 and August 2015. A diagnosis of T1D was ascertained from the electronic health record (EHR). All participants had T1D for ≥1 year to minimize any variability in management that could occur in the period shortly after diagnosis. Participants were recruited in five age subgroups: 2-<6 years, 6-<13 years, 13-<18 years, 18-<26 years, and ≥26 years. Adolescents in the 13-<18 group and their caregivers were given the option of having the adolescent patient use the software application independently or having the caregiver use the application on behalf of the patient. All participants used insulin pumps supported by the data platform at the time of the study, which included the MiniMed Paradigm Revel or 530G system (Medtronic MiniMed, Inc, Northridge, CA) or the OmniPod (Insulet Corporation, Billerica, MA). Use of CGM (Medtronic Enlite or Dexcom G4 Platinum; Dexcom, Inc, San Diego, CA) was possible, but not required. Participants were required to have a computer and internet access at home, and could use either a Mac (Apple, Cupertino, CA) or Windows (Microsoft, Redmond, WA) operating system. Participants with known diagnoses of major mental or developmental disorders were excluded, and English language proficiency was required.
Procedures
After providing informed consent, participants completed a baseline questionnaire on demographics, diabetes management, and opinions on diabetes data. Clinical information was collected from the EHR. Study staff showed each participant an introductory video and conducted a short training session on how to upload data and use the software. Participants were encouraged to upload data from pumps and CGM devices; glucose meters were not included in this study. Staff helped participants create accounts and log in to the application for the first time. After this initial study visit, participants were asked to manage their diabetes as they normally would and were instructed to use the software as often as they liked. Staff contacted each participant by email or telephone two weeks after enrollment to make sure that the participant was able to log in to the application and to answer logistic questions. Technical support staff at the nonprofit technology company was also available by email or telephone. After having access to the software for at least three months, when participants returned for a routine clinic visit, a follow-up study visit was conducted. At this time, they completed a follow-up satisfaction questionnaire.
The protocol and procedures were approved by the Institutional Review Board at the University of California San Francisco.
Measurements
At baseline, participants provided demographic data (age, gender, ethnicity), clinical data (years since diabetes diagnosis, use of CGM), and socioeconomic data (insurance, level of education, parental level of education). At both baseline and follow-up, they answered questions about diabetes management (frequency of contact with diabetes providers, methods of communication, frequency of changes to the insulin regimen) and the use of diabetes data (frequency of data download). At the conclusion of the study, participant feedback was obtained from the follow-up questionnaire.
Results
Participant Characteristics
A total of 65 insulin pump users participated in the study; 35 were adolescents or adults with T1D, and 30 were caregivers of children with T1D. The study population was 65% male, 16% were ethnic minorities, and 92% had private insurance. Overall, 47 participants (72%) were CGM users (Table 1). The majority (60%) of those who reported using CGM in the past year used it for >21 days in the past 30 days, while 6% used it for 15-21 days, 11% used it for 8-14 days, 11% used it for 4-7 days, and 13% reported not using it at all in the past 30 days.
Patient Characteristics.
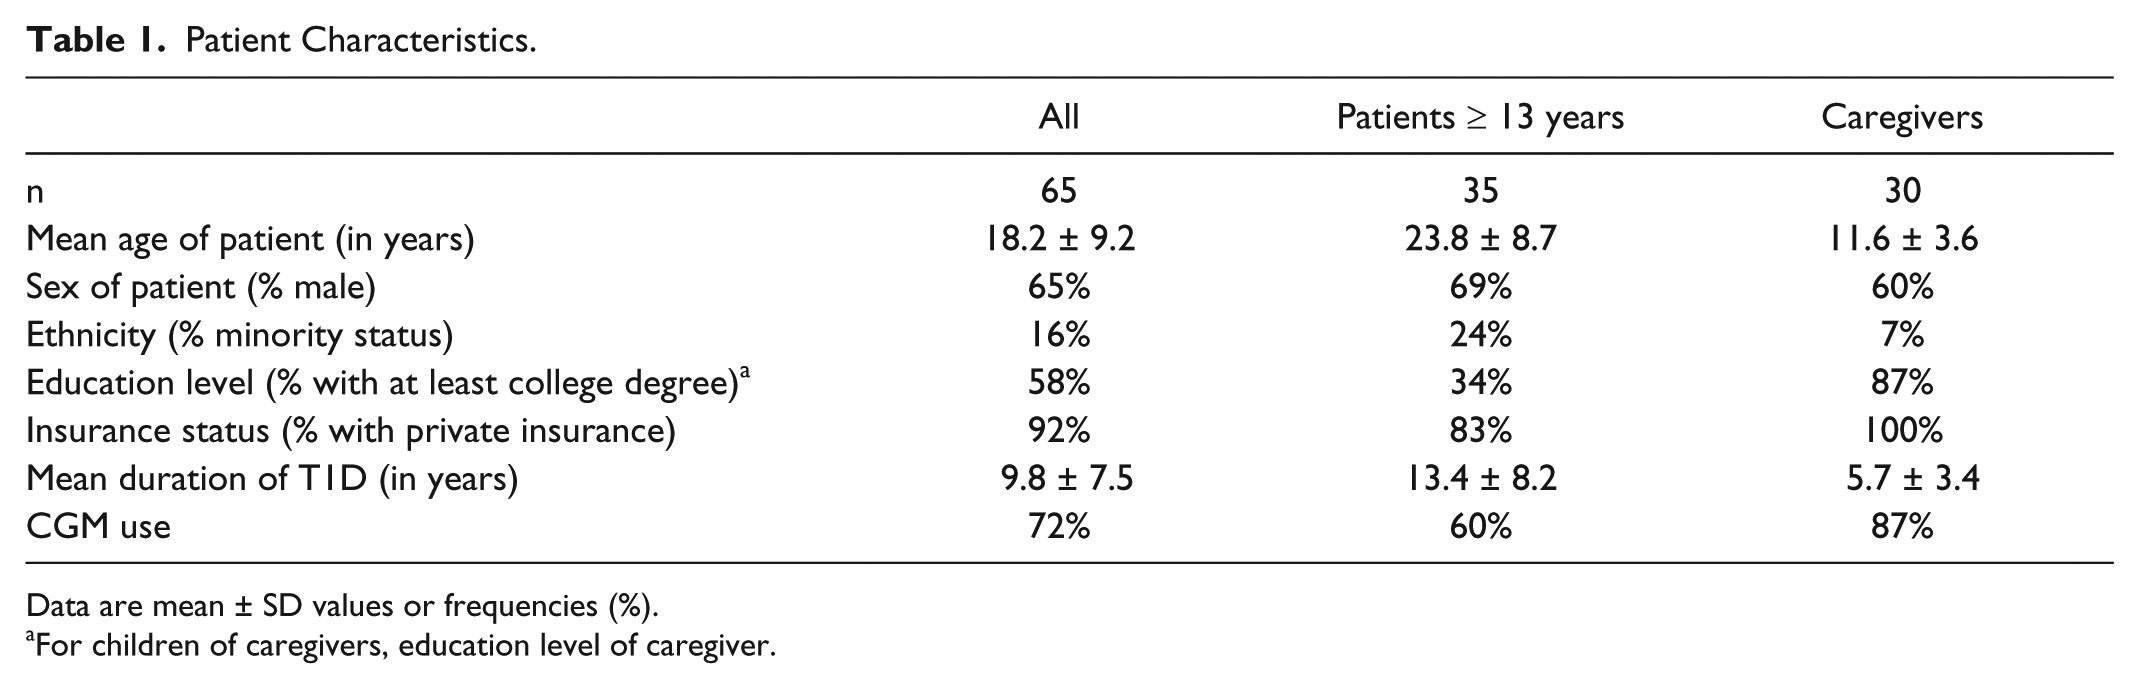
Data are mean ± SD values or frequencies (%).
For children of caregivers, education level of caregiver.
Diabetes Data Management Practices
At baseline, participants were asked about their practices and opinions on diabetes management and using device data. In terms of preferred mode of communication with the health care provider, 66% of participants preferred email, 15% preferred the phone, 12% preferred using the EHR patient portal (MyChart, Epic Systems, Verona, WI), and 3% preferred communication by text message (an additional two participants marked “Other” or did not provide an answer). A small proportion of participants never contacted their providers outside of clinic visits (15%), and more contacted their providers a few times a year (35%) or once every few months (37%); only 11% were in contact with their providers at least monthly.
Nearly all participants felt that it was important for people with diabetes to know how to review and interpret their glucose data, specifically their downloaded insulin pump and CGM data (97% of all participants). Most also agreed that reviewing diabetes data could help them make adjustments in basal insulin doses (95%), insulin to carbohydrate ratios and insulin sensitivity factors (92%), and avoid hypoglycemic episodes (97%). When asked who should have primary responsibility for certain diabetes tasks, the majority felt that the patient (or caregiver of the child) and the clinician should share the responsibility for looking at pump and CGM data, looking for meaningful patterns, and making changes to the insulin plan (Figure 2).
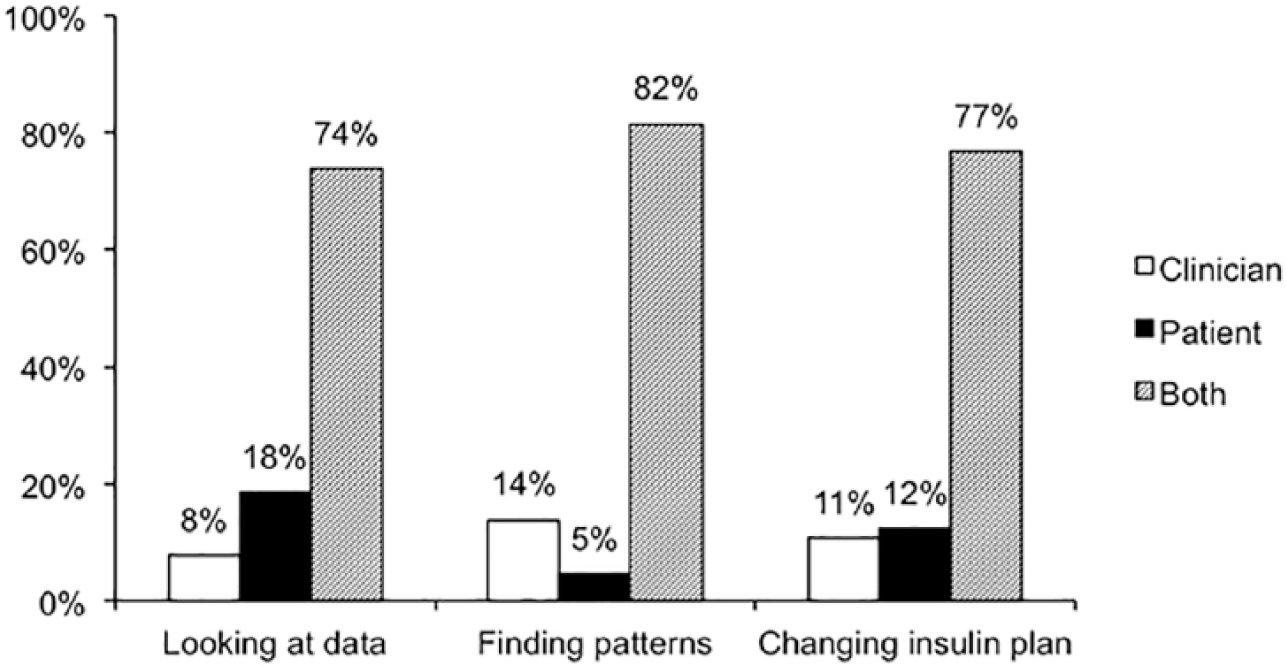
Participant opinion of diabetes management responsibilities. Shown are the percentages of participants who, at baseline, indicated that each of these diabetes management tasks was a responsibility of the clinician (white columns), the patient (black columns), or both the clinician and patient (gray columns).
Despite the fact that a majority felt that it was important to review data and that clinicians and patients should share responsibility, 43% reported having never downloaded their own pump data prior to this study, and 26% downloaded once or twice a year, for a total of 69% who downloaded every 6 months or less (Figure 3A); 45% reported never downloading their CGM data. Regarding changes to pump settings, 11% never changed their own settings, 26% did this once or twice a year, and only 11% did this at least monthly (Figure 3B). Few participants downloaded their pump or CGM data every month (9% and 15%, respectively), and although 52% reported making changes to their pump settings once every 2-3 months, only 22% and 17% downloaded pump and CGM data with that frequency.
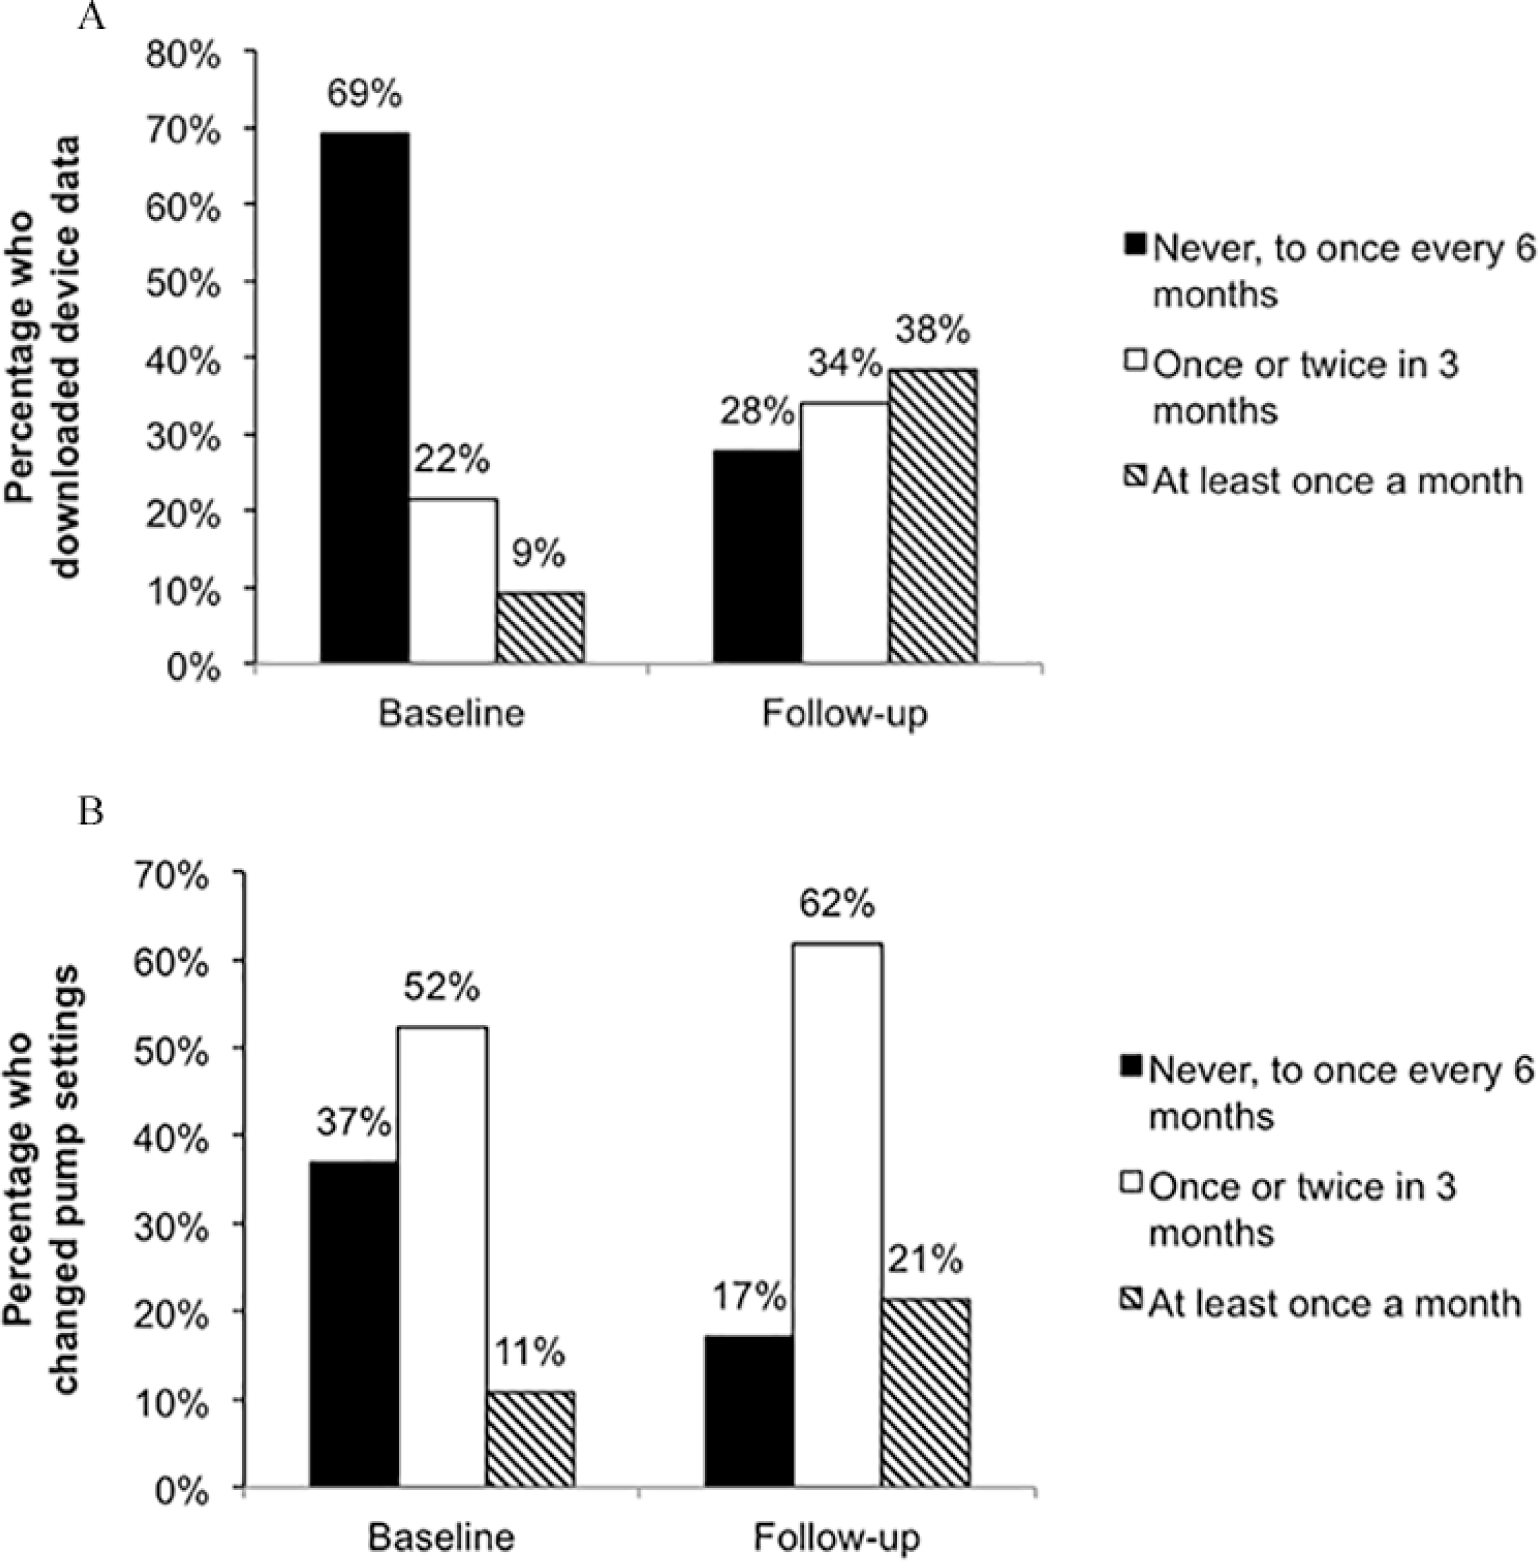
(A) Self-report of the frequency of device download activity at baseline (over the year prior to study start) and at study follow-up (over the 3-month pilot study). At baseline, download activity of pumps is shown; CGM data download activity (not shown) was comparable to that of pump data. (B) Self-report of the frequency of changing insulin pump settings at baseline and study follow-up.
Post-use Assessment and Feedback
After having access to the software for at least 3 months, participants were again asked about diabetes data management. Opinions regarding responsibility for diabetes tasks between the patient and clinician were not significantly different than those at baseline (data not shown). The proportion of participants who never downloaded their device data was 28%, while 38% downloaded monthly (Figure 3A). All participants using Blip had sufficient carbohydrate and insulin bolus data to allow for clinical decision making, and the majority of participants made changes to their pump settings at least once or twice during the study (Figure 3B).
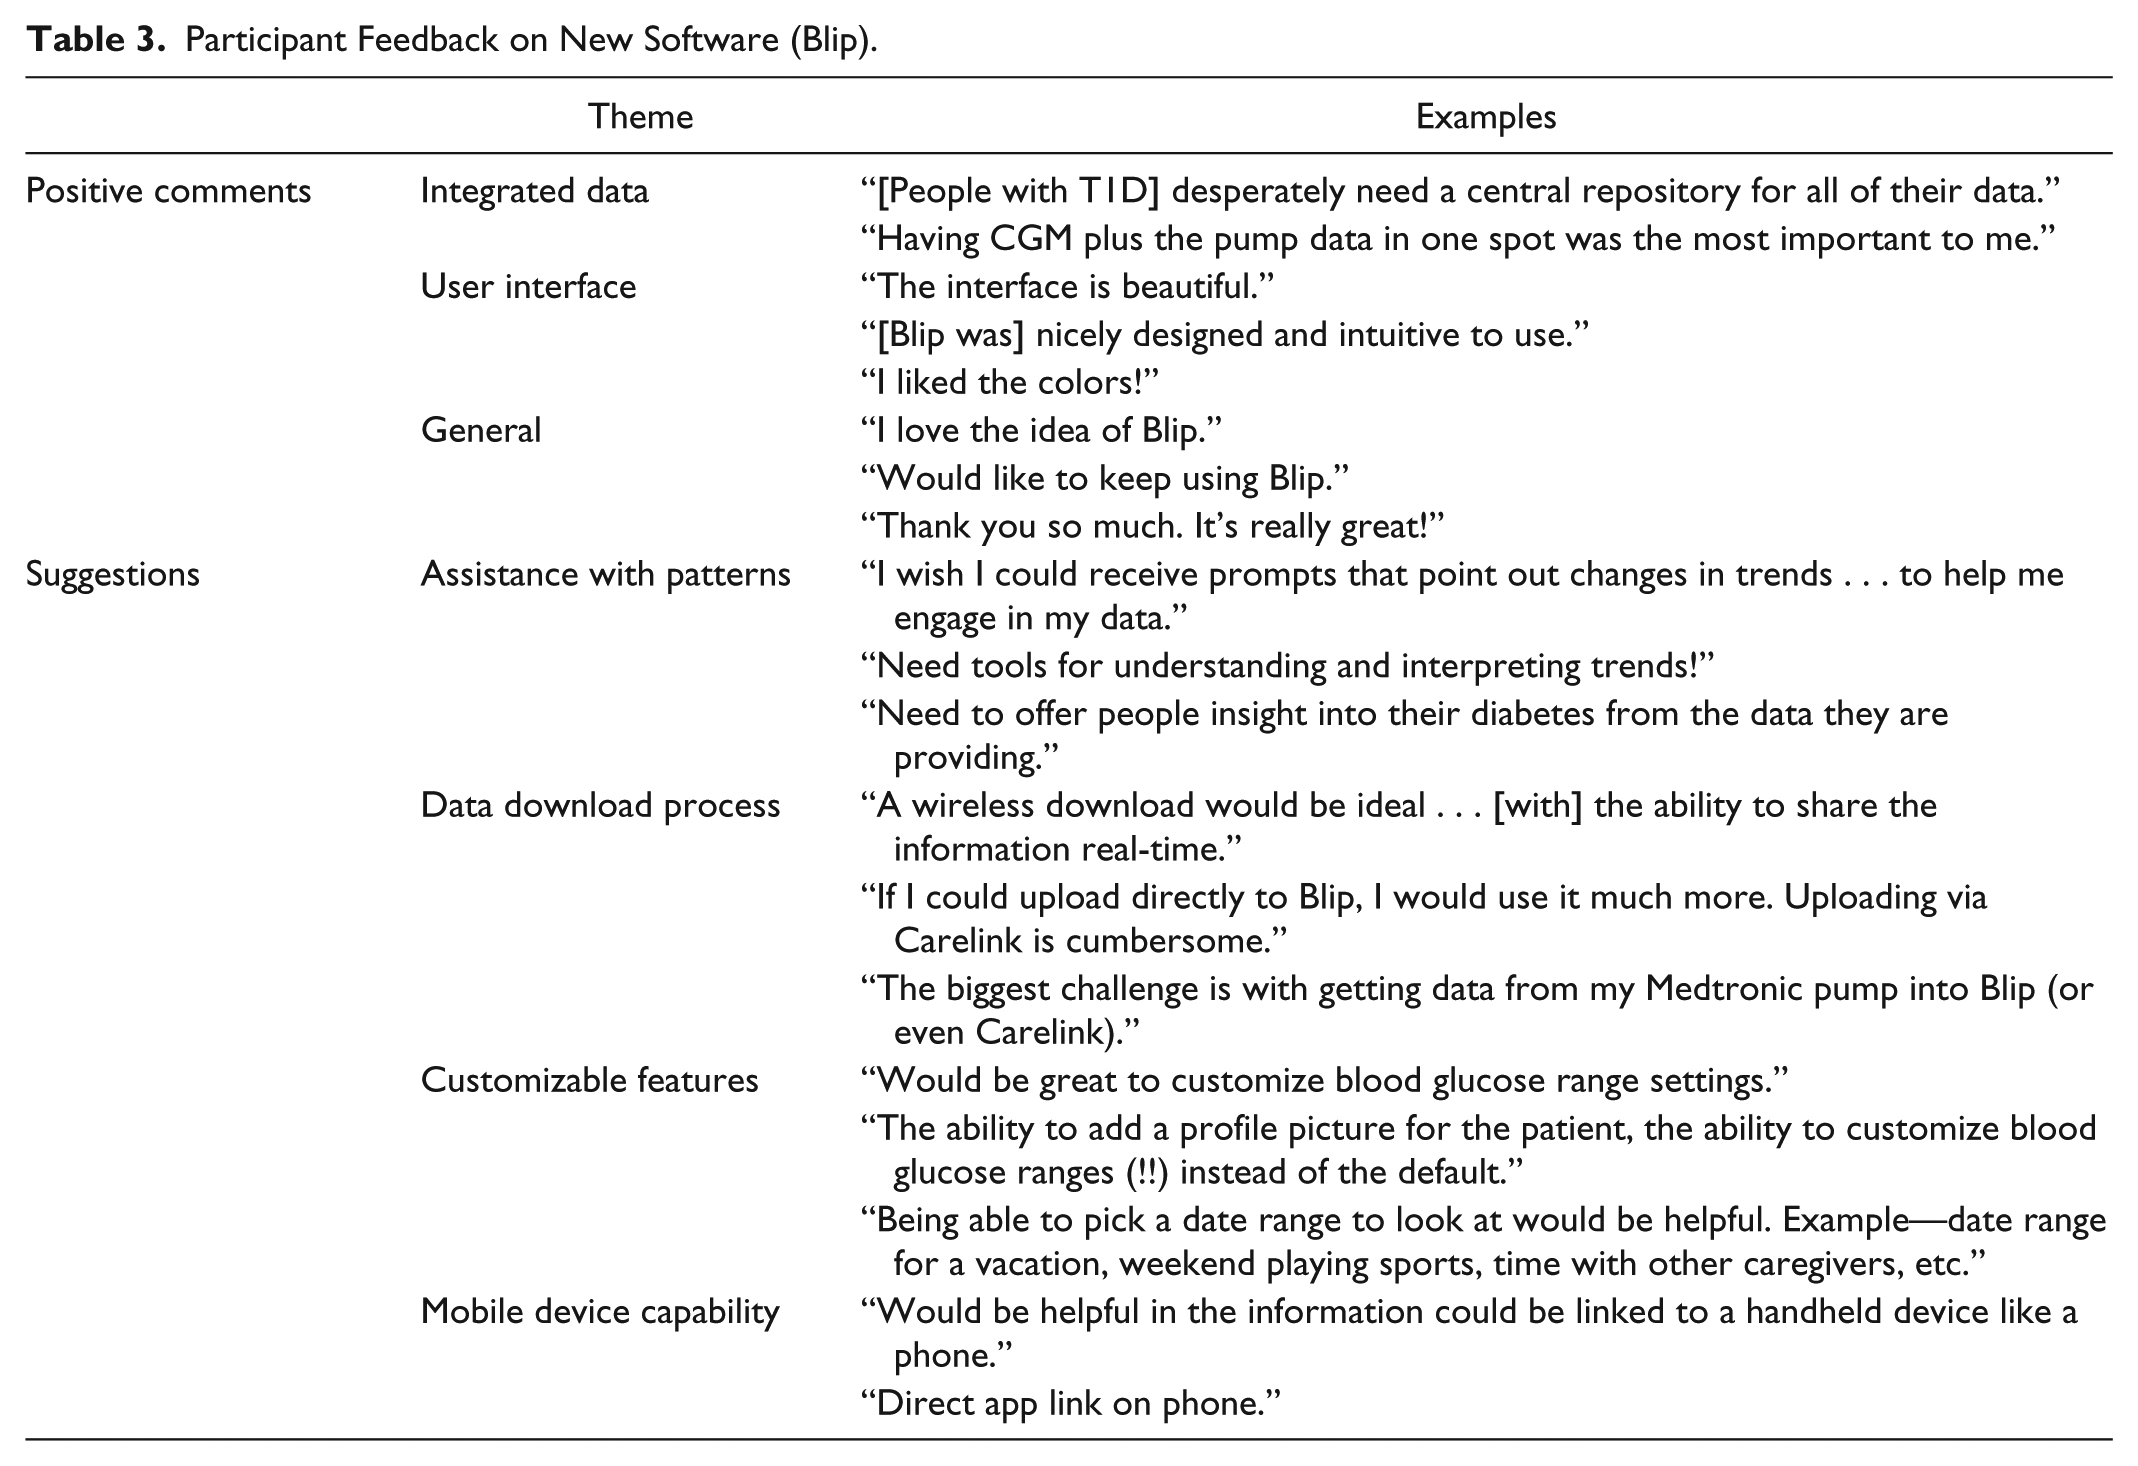
Regarding specific functionality of the software, the majority of participants found logging in easy (64%), but the uploading process, finding patterns, and understanding patterns in glucose data were more challenging (Table 2). This was reflected in the feedback that the participants provided. Positive comments included praise for the user interface and having all of the diabetes data in one place (Table 3). Suggestions included an easier data uploading process, assistance with identifying glucose trends and patterns, and use with mobile devices (Table 3).
Ease of Tasks in the Data Visualization Application.
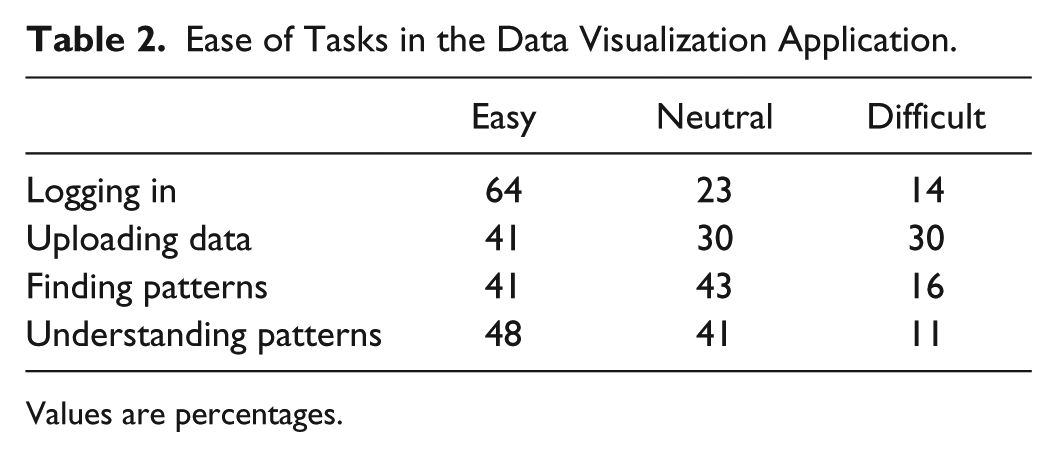
Values are percentages.
Participant Feedback on New Software (Blip).
Discussion
Review of diabetes data is essential for people with T1D to adjust insulin regimens and strategically manage situations that influence glucose levels. Device manufacturers provide proprietary software solutions for downloading and displaying data or contract with independent software service providers. Despite this, many people living with T1D encounter obstacles to using and reviewing their data, including the inability to view data from multiple devices in a single display. This is also true for many diabetes providers who find the process of downloading and reviewing device data time-consuming and resource-intensive. 6 Companies such as Glooko (Mountain View, CA), Diasend (Gothenburg, Sweden), and mySugr (Vienna, Austria) have extended software compatibility with multiple devices, though challenges remain with regard to displaying all device data together and functionality with all device brands. Our goal was to create a single, easy to understand display that incorporates data from multiple types of diabetes devices made by different manufacturers, into one uniform visual display. Unlike Glooko and Diasend, which have recently merged, 19 and mySugr, Tidepool has chosen to pursue efforts as a nonprofit entity, making all of its intellectual property freely available. The main objective of this study was to gather feedback on this novel software application and on using diabetes data.
At baseline, despite the fact that the large majority of participants felt that both they and their health care providers should be reviewing and using diabetes data, many reported never doing this on their own. In addition, though about half reported that they made changes to their insulin pump settings every few months, not all of these participants downloaded the device data, suggesting that many are making changes without actually reviewing their pump or CGM data. The participants in our study included a large percentage of CGM users, the majority of whom used it at least 21 days a month, suggesting this cohort was motivated to use new technology. The discrepancy between the desire to use the data and actual practice, in this technology-avid population, raises the possibility that the broader general population of people with T1D may be even less motivated to review their data or have greater difficulties doing so.
Regarding the software application itself, participants were enthusiastic about viewing insulin pump and CGM data in one place and liked the usability and appearance of the interface. The ability for patients and their providers to view once disparate data in one place may have important clinical implications. For example, easier data acquisition and an integrated interface may facilitate improved provider efficiency, lead to more frequent changes to insulin regimens, and influence diabetes management decisions, which could lead to better clinical outcomes. These potential effects on outcomes can be explored in future studies.
A caveat to interpreting these findings is that this pilot study used an early beta version of the software. Despite the use of an early software prototype, there was change in participant behavior, in terms of increased frequency of uploading and reviewing device data. In the time since this study was completed, a number of improvements have been made to the software, download process, and user experience, which were based on participant feedback. Participants suggested that the process of uploading data remained an obstacle while using the new software. As a result of this feedback, a new application (Uploader) was created to facilitate the uploading process. 20 This second app eliminates the need to first upload data to the manufacturers’ recommended software (eg, Dexcom Studio or Diasend) and expands the brands of devices that are compatible with the new data visualization software. The rapid development of the additional uploading app illustrates how participant feedback can quickly help prioritize software feature development, which is a strength of collaborative work between academia, industry, and patients. At the same time, the iterative and agile pace of software development presents a unique challenge of using traditional research methods, since the technology can rapidly change, making recent clinical trial results seemingly irrelevant very quickly, but with the good reason that an improved version of the technology is almost immediately available, addressing prior problems and concerns.
Participants in this study reported difficulty knowing how to find actionable patterns in their data, and many expressed the desire for tools that would help them identify trends. This highlights the need for health care providers to increase patient engagement through focused education on data analysis and pattern recognition, in addition to continuing to innovate visualization tools and algorithms to identify trends in the rich collection of glucose meter, pump, and CGM data. 21 Future interventions should explore ways to help people with diabetes recognize patterns in their data and use them to make effective changes in their diabetes management.
Limitations of this study include reliance on self-report of frequency of device uploads and the short duration of software use. As a pilot feasibility study, we did not compare participant experience using our software to other programs. We also did not collect data on health care provider use. Future studies will use software-driven data to validate user reports and report downloading and usage metrics by participants and providers. These studies will also explore the effects of more extended software use in longer term, randomized controlled trials.
Our collaborative effort between researchers, technologists, and end users was successful in gathering qualitative feedback to design and improve a novel diabetes data visualization software program. Our results have directly resulted in rapid evolution of the technology and set the stage for further development of the application, larger clinical trials, and integration of new data visualization software into clinical care.
Footnotes
Acknowledgements
We acknowledge the Tidepool employees and members of the public who have contributed to the open-source Tidepool platform. We gratefully acknowledge the staff, patients, and families at the Madison Clinic for Pediatric Diabetes and the Justine Kathryn Schreyer Diabetes Care Center who contributed to this effort.
Abbreviations
AACE, American Association of Clinical Endocrinologists; ACE, American College of Endocrinology; BG, blood glucose; CGM, continuous glucose monitoring; EHR, electronic health record; T1D, type 1 diabetes.
Declaration of Conflicting Interests
The author(s) declared the following potential conflicts of interest with respect to the research, authorship, and/or publication of this article: JCW, ABN, and SA are volunteers on the medical advisory board of Tidepool. HL and BA are full-time employees of Tidepool. HL owns publicly traded shares in Dexcom, Inc. BA owns publicly traded shares in Dexcom, Inc and Tandem Diabetes Care, Inc. SA is on the scientific advisory board of Tandem Diabetes Care, Inc, owns publicly traded shares in Dexcom, Inc and Tandem Diabetes Care, Inc, and serves as a consultant for Insulet Corporation.
Funding
The author(s) disclosed receipt of the following financial support for the research, authorship, and/or publication of this article: JCW is supported by NIH K23DK107894.