
Abstract
Background:
Model predictive control (MPC) performance depends on the accuracy of the prediction model implemented by the controller. Complex physiology and modeling limitations often prevent the ability to provide long and accurate glucose predictions, which results in the need to account for prediction errors.
Method:
Optimal insulin dosage by Zone-MPC is calculated by solving an optimization problem in which a scalar index is minimized by penalizing relative input deviations and glucose predictions out of the reference zone. The controller’s tuning parameters are the penalties on the input variable (insulin). Positive and negative relative inputs are penalized differently. A dynamic adaptation of the tuning parameters based on the accuracy of the model in recent history is implemented in this article and compared in silico to aggressive and conservative tunings of the same controller structure.
Results:
Similar average glucose and time in the safe glucose range (70-180 mg/dL) are achieved for the adaptive design and traditional controller configurations. However, percentage time under 70 mg/dL is significantly reduced, both for announced meals using bolus compensation and unannounced meals with a meal detection algorithm triggered bolus. No differences in the average insulin delivered were observed between the adaptive design and the conservative or aggressive tuning for the bolus strategy, and the adaptive controller delivered less insulin in the other scenario considered.
Conclusions:
The adaptive strategy provides safe and effective glucose management as well as significant reduction of hypoglycemia events. No abnormal insulin delivery profiles were observed upon the application of the adaptive strategy.
The artificial pancreas (AP) is a device that aims to automate diabetes treatment (close the loop) by continuously adjusting insulin delivery based on glucose fluctuations. 1 Numerous advances on the AP have been done in recent years, especially for treatment of type 1 diabetes mellitus, with several research teams completing closed-loop experiments in controlled environments,2-4 and more recently in an ambulatory setting and at home.5-8
The core of any AP is a control algorithm that calculates the appropriate insulin dosing to maintain glucose concentration at a safe healthy level at all times. The most common controllers used in the AP are algorithms based on model predictive control (MPC),9,10 proportional-integral-derivative approach, 11 and fuzzy-logic design. 12 The author’s group has been evaluating an MPC algorithm that is personalized to the patients clinical information 13 and an MPC with a reference defined as a glucose zone.14-16
MPC controllers use prediction models to estimate future glucose trajectories. However, mathematical model predictions introduce uncertainty, and model individualization remains unsatisfactory for data-based models17-19 or physiology-based models. To improve patient safety, this uncertainty can be quantified,20-23 and a confidence interval can be estimated around the current glucose value so that the control actions are adapted 24 to act within the boundaries of confidence.
In the work presented in this article, the model prediction accuracy is quantified by a rigorous analysis of the prediction residuals. The integration of the information from the prediction residuals into the control algorithm may lead to a new family of adaptive control algorithms. These algorithms would act aggressively to eliminate both hyper- and hypoglycemia in case of a good confidence in glucose predictions and be very conservative in case of poor past predictions. As such a safer and more effective glucose control will be derived.
Methods
Matlab R2013b (Mathworks, Natick, MA) was used for the in silico simulations and analysis. p-values for statistical comparison where calculated using nonparametric permutations methods. 25 The data sets were generated using the Universities of Virginia/Padova metabolic simulator,26-28 which has been accepted by the FDA in lieu of animal trials. The simulator implements 10 virtual subjects that represent the interpatient variability equivalent to the general diabetic population. A key part of the simulator is a continuous glucose monitor (CGM) model. 29 The CGM error is different for each execution of the software, introducing differences between simulations. The variability introduced by the random number generator for each simulation impedes a clear comparison of the 10 patients under different treatments. To minimize this effect, every subject is simulated 100 times under every scenario to sum a total of 1000 data sets. By doing this, the noise introduced by the CGM model is averaged over the different simulations of each subject, while still maintaining the variability that the CGM model introduces on the experiments.
The simulations consist of 24 hours of CGM data with 3 meals of increasing carbohydrates load (50 g, 75 g, and 100 g). Every simulation was preceded by 2 hours of open-loop monitoring as a warm up period. Two different meal compensation strategies were considered: (1) meal bolus compensation using the patient’s insulin-to-carbohydrate ratio and (2) unannounced meals to the controller, but detecting a meal occurrence by means of a meal detection algorithm (glucose rate increase detector, GRID 30 ). GRID triggers an alarm when certain conditions of glucose concentration and glucose trend are met, and an insulin compensation dose is administered, equivalent to a prandial bolus strategy. The compensation bolus is the equivalent to a 75 g carbohydrate (CHO) meal correction, based on the patient’s insulin-to-carbohydrate ratio. The controller also incorporates routines for patient safety including an algorithm that avoids delivering extra insulin according to recent insulin delivery history, and a security interlock in case of missing CGM samples.
zMPC Controller
The Zone MPC controller (zMPC) was developed originally by Grosman et al 14 using a constant glucose reference band. This control scheme was later expanded using a control oriented prediction strategy proposed by van Heusden et al. 31 The cost function for the MPC problem is given by:
where
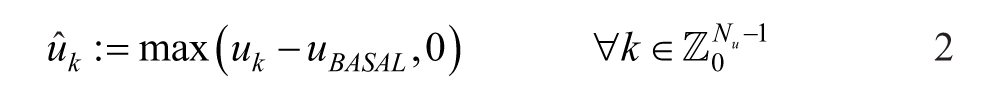
An aggressive controller is prone to deliver more insulin. It would act fast to counter hyperglycemic excursions, and it would be slow to suspend insulin infusion in presence of hypoglycemia. An aggressive configuration for the zMPC is selected for the rest of the article as
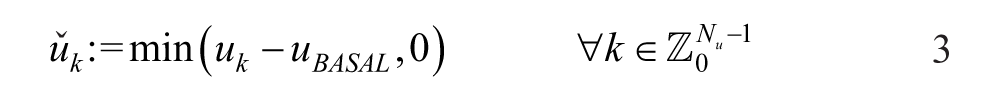
A conservative controller delivers less insulin overall. It shuts down pump infusion fast to minimize hypoglycemia, but it reacts slow to hyperglycemic excursions. The selected conservative configuration is
Note that the definition of aggressiveness used here differs from its traditional meaning. An aggressive controller is usually understood to be a very responsive controller that would act fast against hypo or hyperglycemic excursions, either by injecting more insulin or by shutting down insulin suspension fast. An aggressive controller here would act fast only to counter hyperglycemic excursions, and it is a controller that is more likely to give more insulin than a conservative one, to cope with both hypo and hyperglycemia. Also note that the ratio between
The 2 controllers selected differ from the default settings (
Trust Index
The method proposed in this article to quantify the trust of the model prediction makes use of the available information provided by the residuals of the predictions of that same model. Each of the

where
where
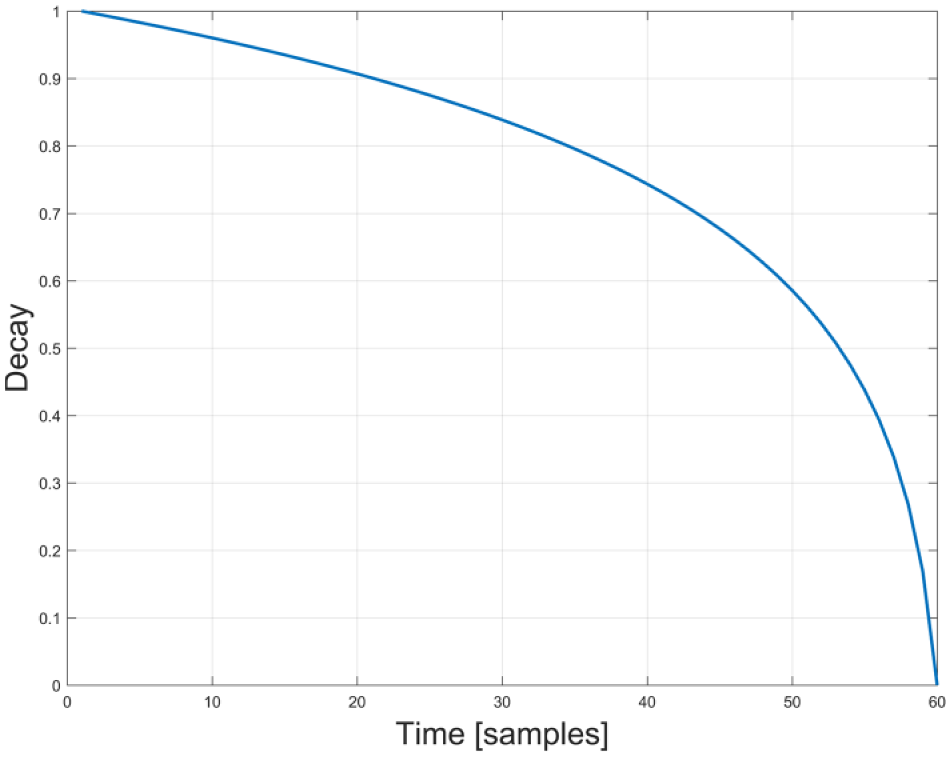
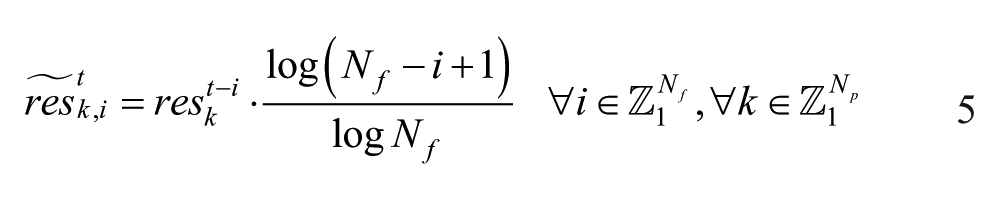
Logarithmic forgetting function applied to the residuals.
A good estimation of the confidence interval of the current prediction error can be calculated from the 5th and 95th percentiles of this sample:
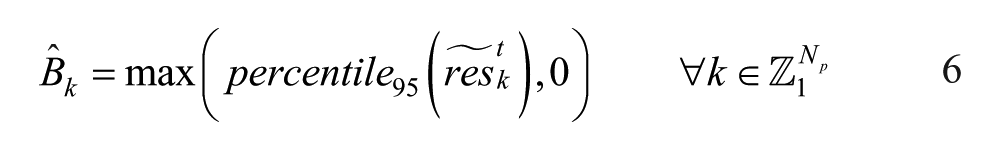
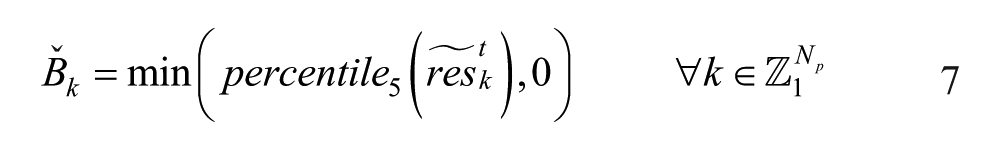
where
A scalar value that comprises both the uncertainty of previous model predictions and the coherence of the new measurement with that uncertainty is computed next:
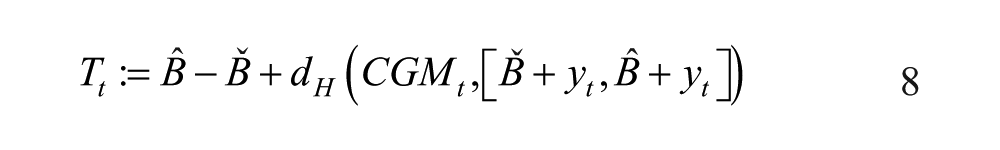
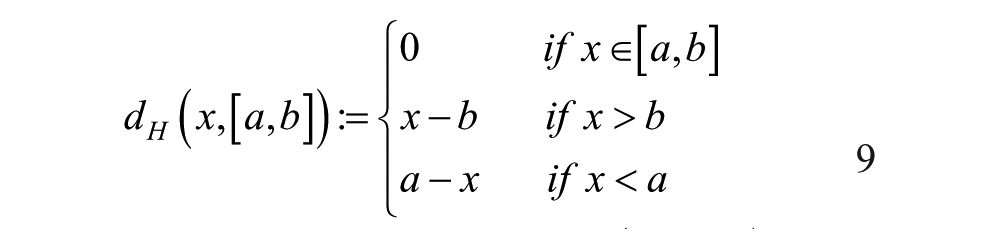
where
The trust index is here implemented into the closed-loop scheme presented in Gondhalekar et al 16 by relating it to the aggressiveness tuning of the controller. Every possible scenario of the correlation between the trust index and the controller aggressiveness is explained in Table 1.
Controller Behavior for Every Glucose Scenario and Each Trust Index Value.
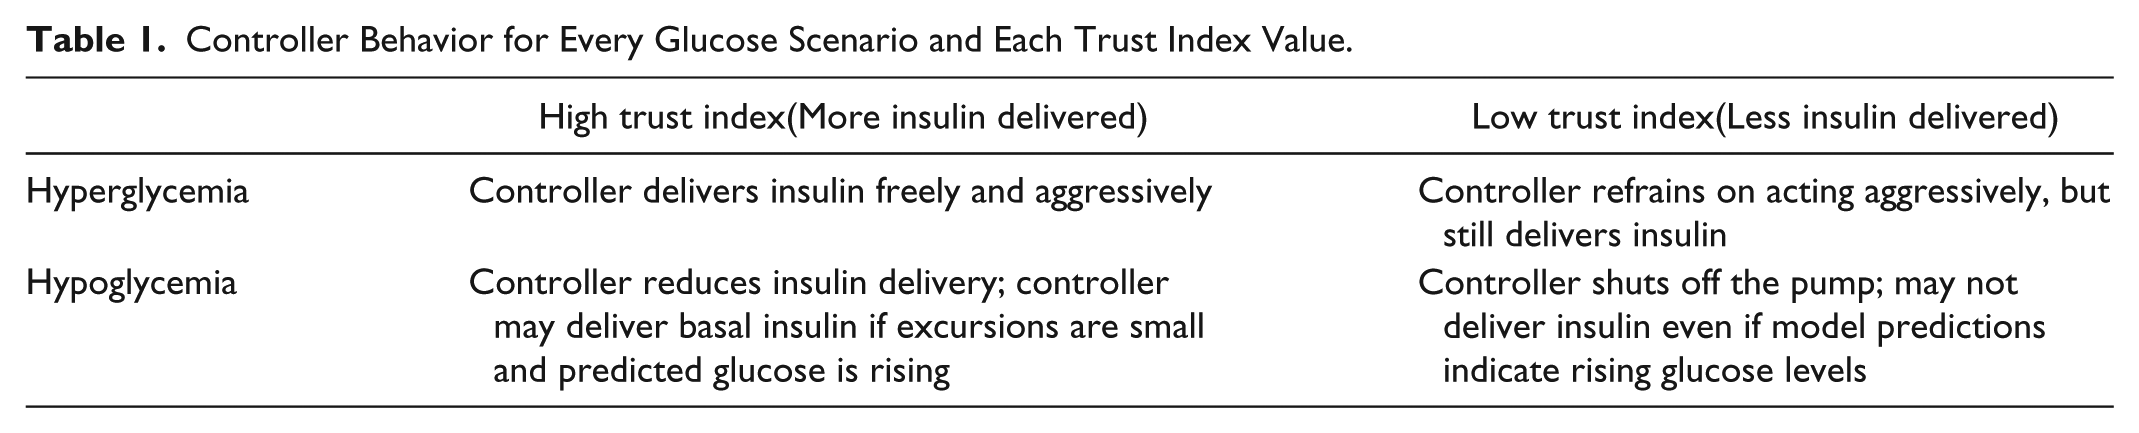
For a
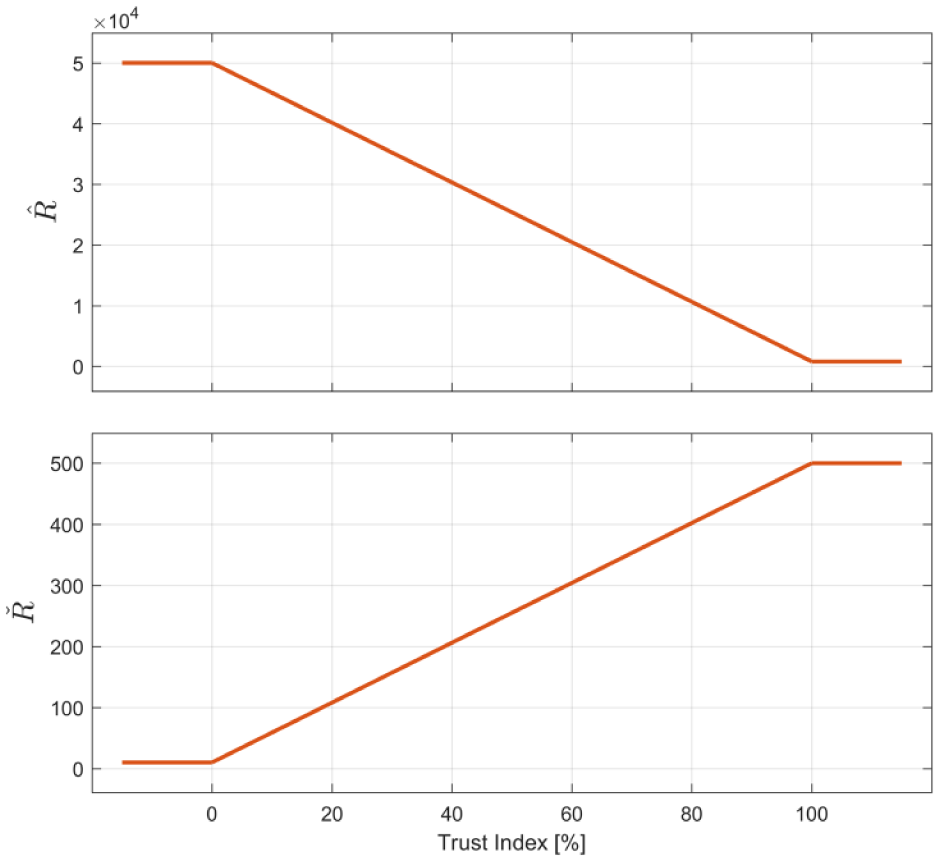
Adaptation scheme for parameters
Results
Performance metrics for the experiments described in the methods section are reported in Table 2. Metrics are reported as mean plus-minus standard deviation of the in silico population. The performance metrics for the “default,” “aggressive,” and “conservative” tuning are statistically compared to the proposed adaptive algorithm.
Mean and standard deviation of the control performance metrics of the zMPC controller for the Default, Aggressive, Conservative, and Adaptive tuning.
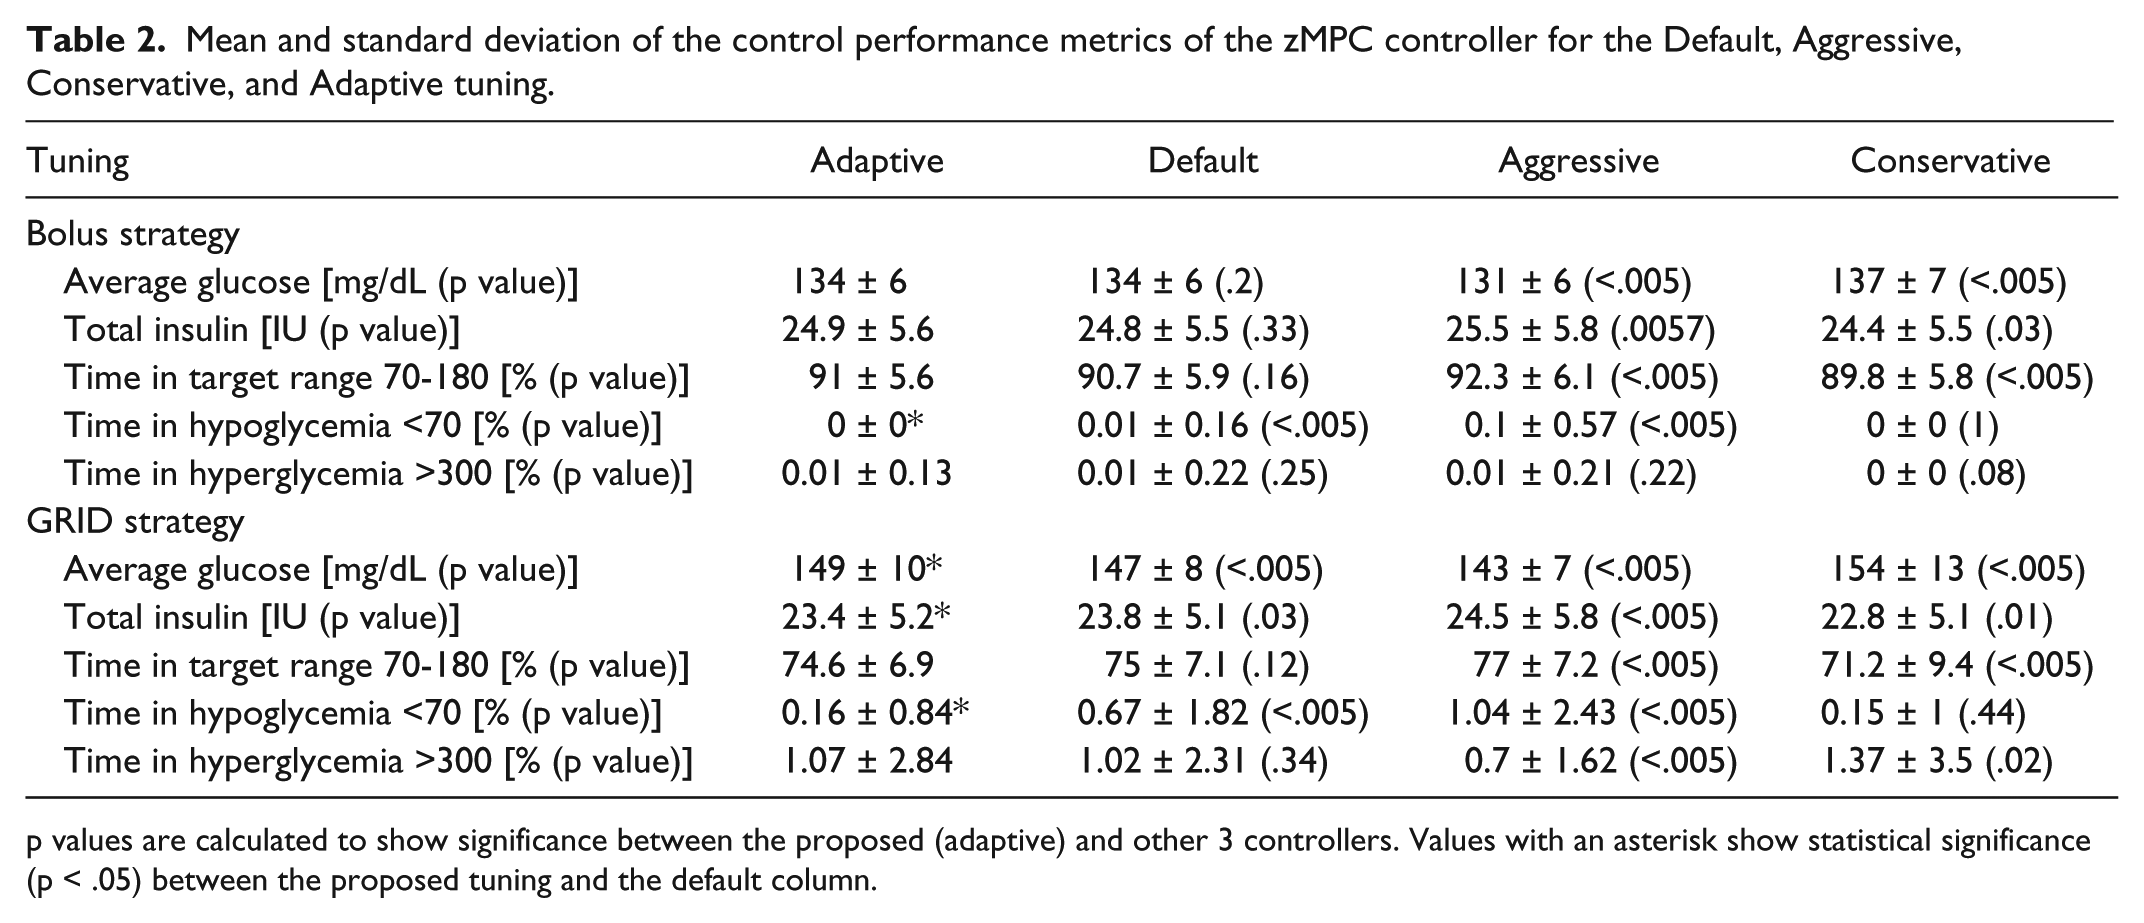
p values are calculated to show significance between the proposed (adaptive) and other 3 controllers. Values with an asterisk show statistical significance (p < .05) between the proposed tuning and the default column.
In the bolus strategy, the adaptive controller shows very similar performance (in mean glucose and time in range) to that of the “default” controller. However, the adaptive strategy is able to reduce significantly the time spent in hypoglycemia (0.01% vs 0.0%, p < .005). Hypoglycemia is also rarely seen when using the conservative controller, but at the cost of a higher average glucose (137 mg/dL vs 134 mg/dL, p < .005).
In the GRID scenario, the adaptive algorithm shows significantly lower average glucose than the conservative tuning (149 mg/dL vs 154 mg/dL, p < .005). Furthermore, the proposed algorithm shows a significant reduction in hypoglycemia with respect to the aggressive case (0.16% vs 1.04%, p < .005), with minimal increase in average glucose and good time in the safe glucose range. The time in hypoglycemia is not different for the conservative case and the proposed adaptive algorithm. Time in hypoglycemia for the proposed adaptive algorithm is significantly lower than for the default controller (0.16% vs 0.67%, p < .005), but in this case at the cost of a higher average glucose. However, the time in range for the proposed algorithm is not significantly different than that of the default tuning.
In Figure 3 the glucose concentration, insulin infusion, and trust index for the adaptive scenario and default controller are plotted. The average glucose is marginally lower for the default controller, and the interquartile range is larger, especially after the larger meal. The way GRID is designed, 30 an insulin bolus (considering insulin-to-CHO ratio, recent insulin delivered, and IOB constraints) is triggered when a meal is detected, which explains the relatively small and delayed insulin impulse after meals. Significant drops in the trust index can be observed for time of the meals and glucose peak time, corresponding to changes in the glucose trend that yield larger prediction errors.
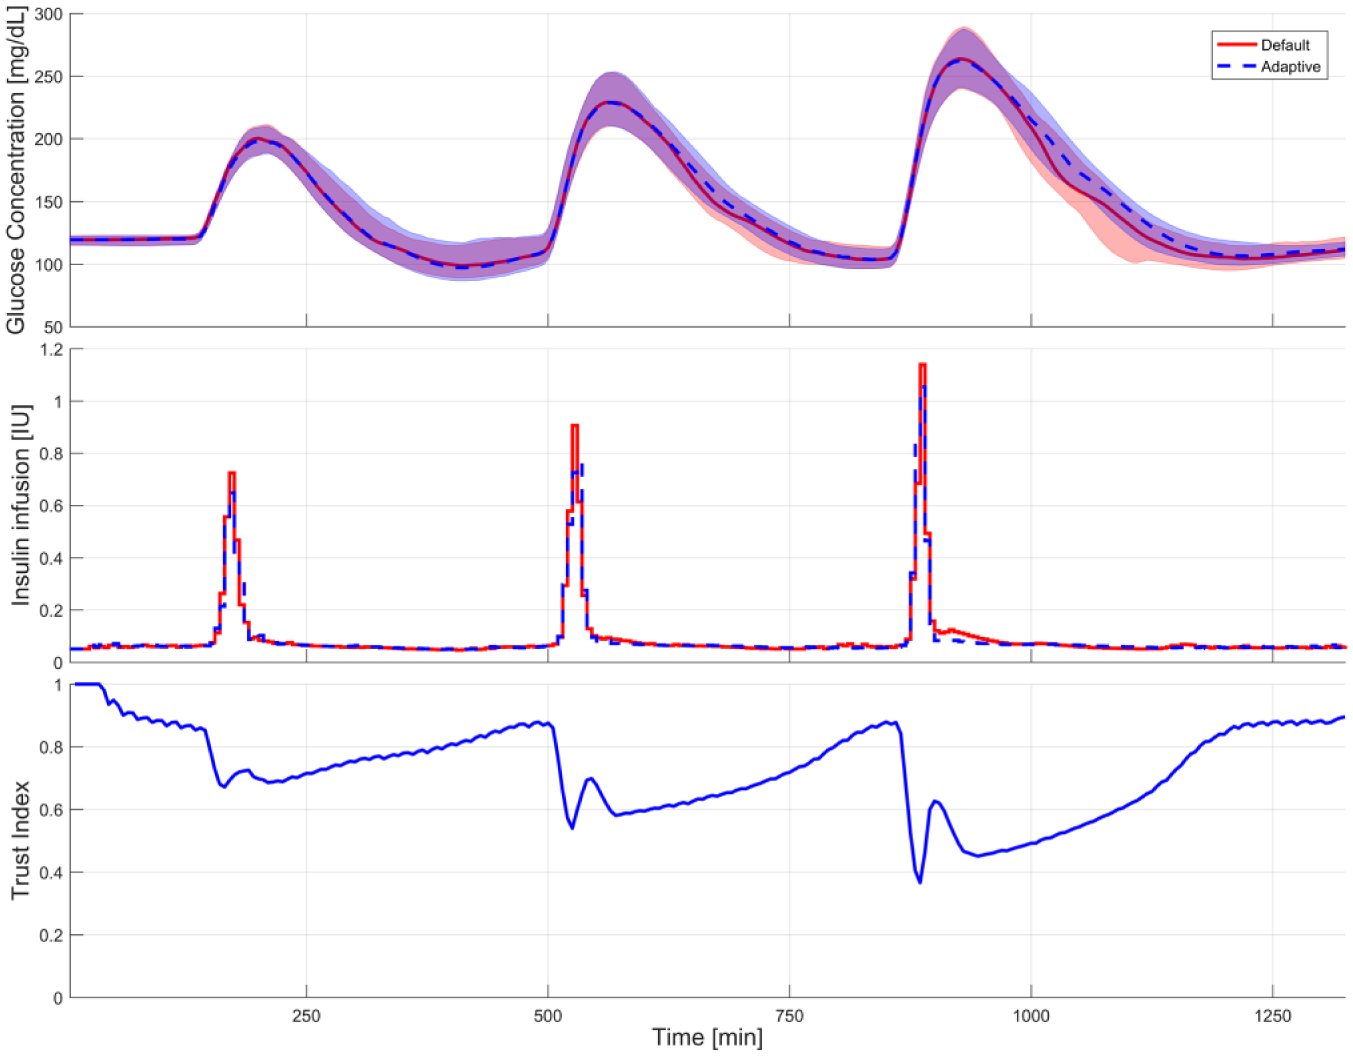
Median glucose concentration and interquartile range (top) and mean insulin pump administration (middle). The default static tuning is plotted in red (continuous line), the proposed adaptive tuning in blue (discontinuous line). The displayed glucose and insulin profiles correspond to the GRID compensated meals. The bottom plot displays the trend of the Median Trust Index against time for the adaptive version of the controller.
Discussion
A detailed comparison of the proposed adaptive strategy with the default controller is necessary to appreciate the benefits of our novel approach. Looking at the bolus strategy in Table 2, the adaptive strategy and the default tuning show very similar performance, both in average glucose (134 mg/dL) and time in range (24.9% and 24.8%). However, the adaptive controller is able to avoid hypoglycemia more efficiently, reducing the time below 70 mg/dL to virtually zero, while the default controller still has spurious episodes of hypoglycemia. This low occurrence of hypoglycemia is also observed for the conservative version of the controller, but the performance of that tuning is subpar when compared with the other tested controllers. The aggressive tuning of the controller is able to achieve significantly better performance than any of the other controllers, with an average glucose of 131 mg/dL and a time in range of 92.3%. However, the number of hypoglycemic episodes triggered by that controller is also higher than those of the adaptive simulation.
When comparing strategies GRID and Bolus from Table 2, a larger disparity can be observed for the results of each controller configuration for the GRID strategy. This is a direct result of the prandial bolus dosing limiting the amount of insulin that the controller is able to utilize in the postprandial period, which is one of the safety mechanisms implemented in the controller structure. This yields, for the bolus strategy, more homogeneous results than those of the GRID strategy.
As for the GRID strategy results, the adaptive controller produces significantly larger average glucose than the default controller configuration (149 mg/dL vs 147 mg/dL). However, this difference is clinically irrelevant, with an estimated A1C (based on the average glucose) of 6.81% for the adaptive control and 6.74% for the default controller configuration. The “A1C-average glucose” regression was calculated following:
33
Due to the forgetting function introduced in equation 5, the algorithm gradually converges to a particular value if the prediction error remains bounded. Since the prediction errors are bounded by the nature of the output variable (CGM values and its rate of change are bounded), we conclude that the computation of the trust index is stable and convergent.
zMPC uses a control-relevant model that is different from the validation model. Given that there is an evident model-plant mismatch, a practical approach was used to address stability of the closed-loop system, as it has historically been done for MPC applications.
34
We performed 2000 simulations under a variety of scenarios, clinical conditions and realizations of additive noise, to verify the stability of the algorithm and the closed-loop system. Our simulations resulted in stable MPC treatments every time, reassuring experimental stability of the algorithm. Furthermore, the controller response is bounded between 2 stable
For both scenarios tested, the proposed scheme achieves similar or better control than the other configurations by good use of already available information and without any additional risk to the patient’s health.
Even though the results seem promising, the performance of the proposed control benefits when put in context with existing clinical experiments from literature. In Table 3 some of the results of this article are displayed along similar results from literature, using the same controller implementation as described in this article for simulated and real patients.
Performance comparison for the announced meals scenario between the controllers tested in this study and previous studies present in the literature using the same controller scheme.
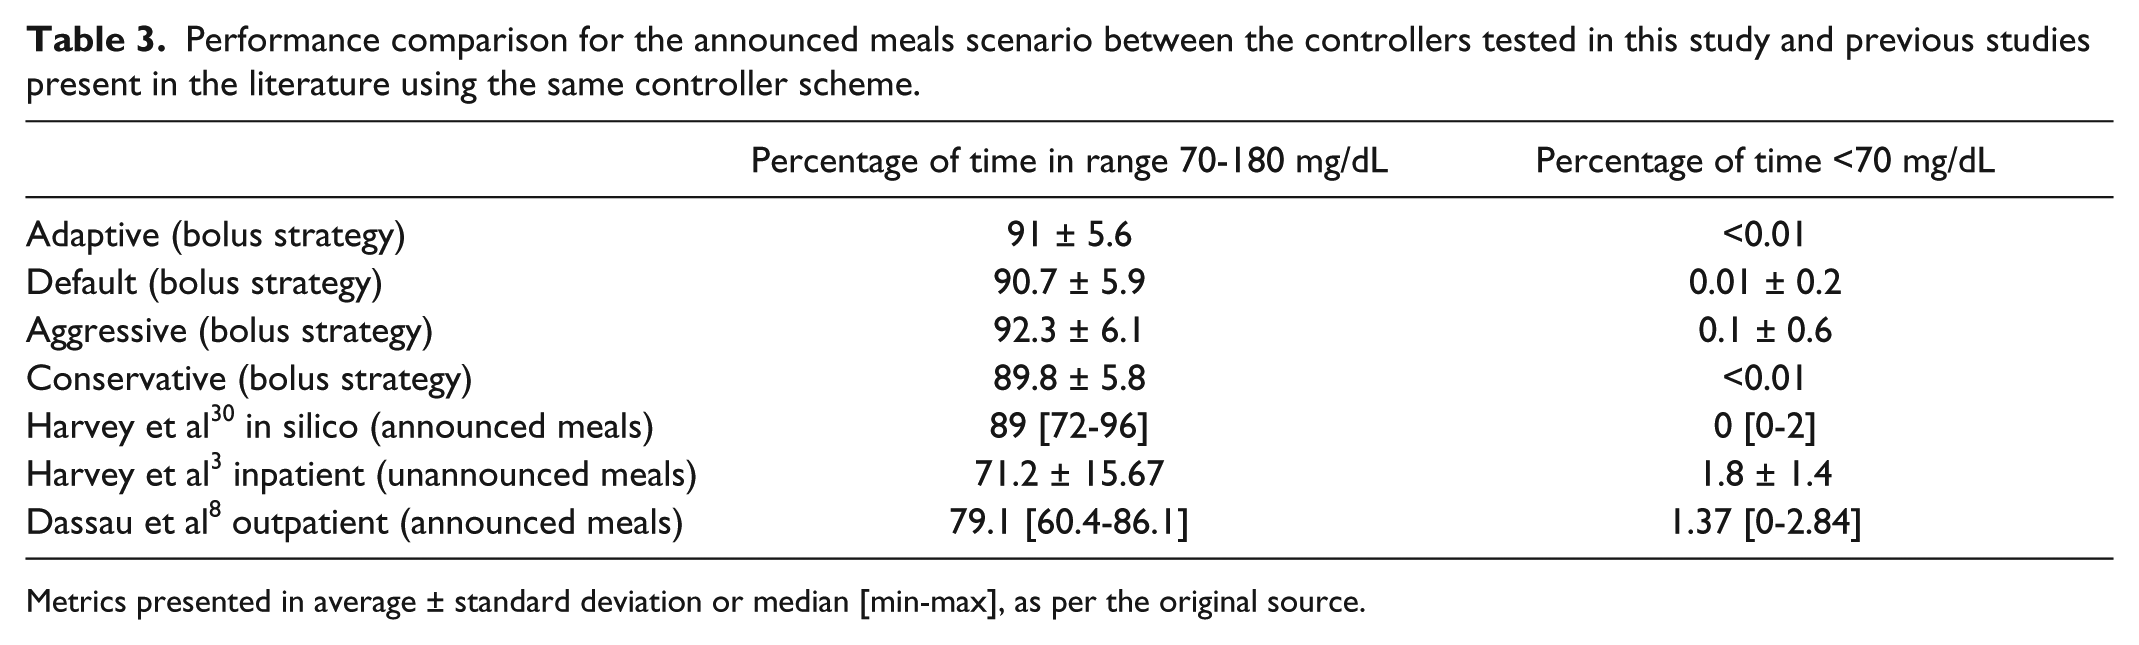
Metrics presented in average ± standard deviation or median [min-max], as per the original source.
Rows 1 to 5 of Table 3 correspond to in silico experiments, while the last 2 rows are clinical experiments, both in clinic (row 6) and outpatient (row 7). Rows 2 and 5 are the same experiment, with 1 difference: in this article we have simulated each patient 100 times. We can observe that the results are very similar to those achieved in this article.
Performance results for virtual patients are better than those seen in clinical studies, in particular when looking at frequency of hypoglycemia, which is extremely low in simulation. However, hypoglycemia occurrence is still a very important concern when implementing controllers in clinical practice, which justifies our focus on hypoglycemia reduction.
Conclusions
A novel strategy for adaptive tuning of a zone based MPC controller has been presented and its application to a virtual cohort of people with type 1 diabetes. Repeated residuals from the model predictions are stored and a scalar trust index is deduced quantifying the uncertainty of the model predictions and the coherence of the glucose sample at each step. The MPC controller is then tuned in real time based on the value of the trust index. The resulting adaptive controller was tested against several static counterparts producing safer control in hypoglycemia.
Footnotes
Acknowledgements
The authors would like to thank the valuable insight provided by Professor Dale E. Seborg and the help of Dr Ravi Gondhalekar.
Abbreviations
CGM, continuous glucose monitor; CVGA, control variability grid analysis; GRID, glucose rate increase detector; MPC, model predictive control; FDA, Food and Drug Administration; UVA, University of Virginia.
Declaration of Conflicting Interests
The author(s) declared no potential conflicts of interest with respect to the research, authorship, and/or publication of this article.
Funding
The author(s) disclosed receipt of the following financial support for the research, authorship, and/or publication of this article: National Institutes of Health grant DP3DK094331 and JDRF grant 17-2013-473