
Abstract
Background:
Glucose homeostasis is the result of complex interactions across different biological levels. This multilevel characteristic should be considered when analyzing and designing closed-loop glucose control algorithms. Classic control schemes use only a pharmacokinetic-pharmacodynamic (PKPD) perspective to describe the glucoregulatory system.
Methods:
A multilevel model combining a PKPD model with an insulin signaling model is proposed for patients with type 1 diabetes mellitus T1DM (T1DM). The PKPD Dalla Man model for T1DM is expanded to include an intracellular level involving insulin signaling to control glucose uptake through glucose transporter type 4 (GLUT4) translocation. A model-based controller is then designed and used as an example to illustrate the feasibility of the proposal.
Results:
Two significant results were obtained for the controller explicitly utilizing multilevel information. No hypoglycemic events were registered and an excellent performance for interpatient variability was achieved. Controller performance was evaluated using two indexes. The glucose was kept inside the range (70–180) mg/dl more than 99% of the time, and the intrapatient variability measured using control variability grid analysis was solid with 90% of the population inside the target zone.
Conclusions:
Multilevel models open new possibilities for designing glucose control algorithms. They allow controllers to take into account variables that have a strong influence on glucose homeostasis. A model-based controller was used for demonstrating how improved knowledge of the multilevel nature of diabetes increases the robustness and performance of glucose control algorithms. Using the proposed multilevel approach, a reduction of the hypoglycemic risk and robust behaviour for intrapatient variability was demonstrated.
Introduction
Glucose homeostasis is achieved through complex interactions across different biological levels. It involves a number of factors, for example, the sensitivity of the insulin cellular receptors and hormone release by various organs. Diabetes is, accordingly, a multilevel disease that involves alterations from the organ level down to subcellular signaling. To take this aspect into consideration, closed-loop glucose control should be based on a multilevel analysis. However, most developed control approaches are based on high-level models without explicit consideration of the multilevel character of type 1 diabetes mellitus (T1DM). Typically, a pharmacokinetic/pharmacodynamic (PKPD) model is used to describe the glucoregulatory system, e.g., Bergman model 1 , Dalla Man model 2 , Hovorka model 3 , Vicini model 4 , and the Sorensen model. 5
Multilevel models describe subsystems and their interplay at different levels of organization and abstraction. For instance, they can consider the interactions between the intracellular and extracellular levels. Thus, not only direct mass balance effects are considered, as in the PKPD models, but also indirect effects such as changes in insulin sensitivity. A multilevel approach to glucose control should hence also focus on modeling relevant cellular signal transduction processes and how changes in the signaling networks may affect the transmission and flow of information about extracellular conditions to intracellular processes and vice versa. Insulin signaling is a key factor in the glucoregulatory process, as it delivers the information contained in the extracellular insulin concentration to protein transcription processes in the cell nucleus and modifies glucose uptake in the cells by stimulating translocation of glucose transporter type 4 (GLUT4) from intracellular sites to the cell surface. 6 A variety of insulin signaling models have been developed that can be integrated with a PKPD model. A model of metabolic insulin signaling pathways was developed by Sedaghat and coauthors. 7 It contains many of the components of insulin signal transduction pathways leading from the insulin receptor to translocation of GLUT4. The model, which has 21 state variables, was validated with experimental data and also reproduces expected qualitative behaviors. Liu and coauthors 8 integrated it with a PKPD model in order to get a model of glucose mobilization and uptake in patients with type 2 diabetes mellitus. The main deficiency of the whole-body model proposed by Liu and coauthors 8 is the lack of a meal absorption model, an insulin PK model, and a fasting equilibrium point. All these limitations are overcome in the hierarchical whole body developed by Nyman and coauthors. 9 Their hierarchical model relates intracellular insulin control of glucose transport in human primary adipocytes with insulin levels in the PKPD model, which provides for an improved understanding of glucose homeostasis. In this work, we consider a similar approach for T1DM patients, as closed-loop glucose control is more relevant for these patients.
One of the goals of this article is to show how knowledge of the multilevel nature of diabetes can be explicitly utilized to significantly improve the performance of glucose controllers in an artificial pancreas framework. For this purpose, a multilevel model for T1DM is proposed and a model-based control scheme is designed to show the feasibility of the approach.
Methods
Multilevel Model
Multilevel models include information provided by a combination of high level models, typically for organs such as liver, kidney, or muscles, communicating with low level models, e.g., intracellular models. The main advantage of this approach is that the glucoregulatory model can utilize information concerning the overall glucose balance explained by PKPD relations. With low-level submodels, it is also possible to include a number of other aspects that are important for achieving glucose homeostasis, such as interactions with protein and fatty acids, hormone release, and dynamic variations in insulin sensitivity, including its circadian rhythmicity. The latter is an example of a weakness in the classic PKPD models, because insulin sensitivity is considered constant1–3 despite the well-known fact that a diabetes patient has important dynamic changes of insulin sensitivity during the day. 10 In fact, clinical therapies with insulin pumps typically employ different basal rates within a 24 h period. 11
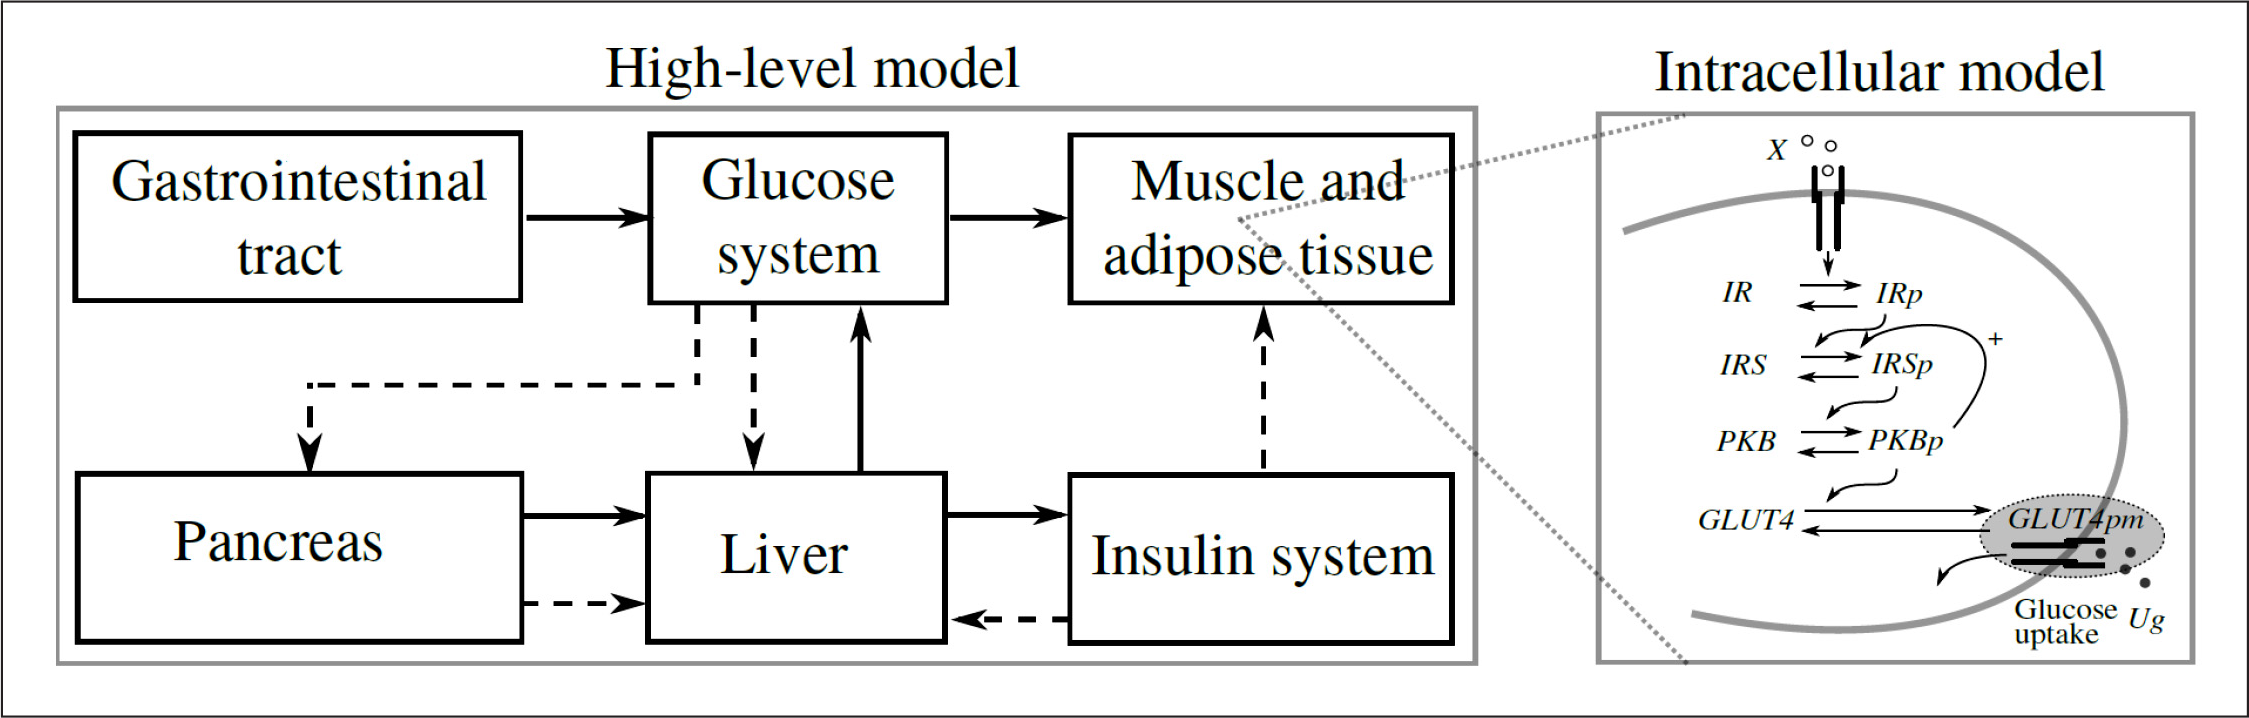
Multilevel scheme of the glucose–insulin regulatory system. Continuous lines denote fluxes of material and dashed lines control signals.
The Dalla Man model was chosen as the top-level model because it has a suitable balance between dimension and modularity. Other models, such as the Bergman model, have a higher level of abstraction, making them less modular and hence more difficult to expand to include multilevel aspects. The subsystems within the Dalla Man model are distinct, and their equations have a clear physiological interpretation, hence it is relatively straightforward to extend the subsystems to include new variables. We utilized this to develop a multilevel model that includes intracellular information and that will provide a better explanation of the insulin and glucose dynamics required to achieve homeostasis.
Insulin Signaling Model
The schematic of the components involved in the glucose uptake by adipose tissue are shown in the submodule called intracellular model in
Model Predictive Control Based on Multilevel Model
In order to illustrate how a multilevel model can be used to improve glucose control performance, model predictive control (MPC) was selected, which can be considered a de facto control standard for closed-loop glucose control. It has been used both in in silico trials 13 and in vivo trials. 14 Also, MPC is considered as a promising control technique because it is flexible and can incorporate physiological variables for improved performance. For example, MPC that uses insulin-on-board computation and meal-size estimation is presented by Lee and coauthors. 13
The basic idea of MPC is to calculate a sequence of future control signals in such a way that it minimizes a quadratic discrete-time cost function defined over a prediction horizon. The vector with the future control sequence is obtained by solving the corresponding optimization problem. However, only the first element of the sequence is applied, and then the same procedure is repeated successively at each sample time, thereby effectively providing feedback control. The typical quadratic objective function used is given by

subject to
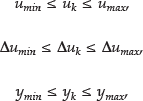
where N1 and Np define the beginning and end of the prediction horizon, Nu is control horizon, r(k + j) is reference trajectory, ŷ(k + j|k) is j-step prediction of the output on data up to instant k, δΔu is weight on the control action increments, δu is input increment, and ymin/ymax, umin/umax and Aumin/umax are the constraints imposed on the output, input, and input increments, respectively. The performance index to be optimized is the expectation of a quadratic function measuring the distance between the predicted system output and a given reference sequence over the horizon, plus a quadratic function penalizing the control effort.
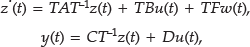
In this work, the MPC design is based on a linear multilevel model, combining the PKPD model and the insulin signaling model as described earlier. The linear multilevel model was obtained from linearization of the complete nonlinear model as presented in the
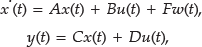
where, A, B, C, D, and F are matrices of the state space model; x(t) is the vector of states; y(t) is the output of the system (glucose); u(t) is control signal; and w(t) is meal estimation. Meal information was incorporated into the control scheme using the meal information as measured disturbance into the MPC algorithm.
Model predictive control requires estimation of states based on the model and available measurements. In order to determine what states could be estimated based on blood glucose measurement and insulin infusion rate, an observability analysis was performed based on the observability Gramian defined by
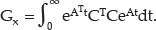
The Gramian was computed using the Matlab function gram for the linear system of

where T was obtained using the Matlab function balreal. The resulting balanced model
has controllability and observability Gramians that are identical and diagonal, with diagonal elements representing the importance of the corresponding states in describing the input–output behavior. Removing states corresponding to small diagonal elements then yields a reduced model where all states are observable and controllable with some margin. In this case, we found 11 significant modes, and using the Matlab function modred, a reduced state space model (Ar, Br, Cr, Dr) with 11 states was obtained. Finally, the reduced model was discretized with a sample time of 5 min to yield the discrete time state space model
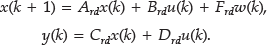
The reduced model of
This is a second-order model for the glucose–insulin relationship and first-order for the glucose–meal relationship. 16 The model is fitted to the average patient response of the University of Virginia (UVa)/Padova simulator. 12
The tuning parameters for both the low-order and the multilevel MPC are N1 = 1, Np = 85, Nu = 2, and δΔu = 1.5. The constraints are ymin = −40 mg/dl, ymax = 240 mg/dl, umin = −150 pmol/min, umax = 700 pmol/min (these values are deviations of glucose level and insulin infusion from the chosen basal point: ubasal = 150 pmol/min and Gbasal = 100 mg/dl), and Δumin = Δumax = 95 pmol/min.
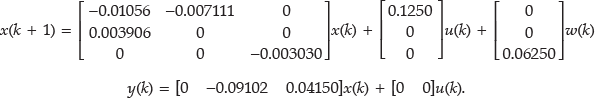
Comparison of glucose response between the average patient of the UVa/Padova simulator (solid) and the multilevel model (dash–dot) and the low-order model (dash).
Results
A preclinical testing trial is an important step to evaluate the performance of closed-loop glucose control schemes. The UVa/Padova simulator
12
provides realistic results and covers a wide range of the variability observed among the diabetes patient population. This simulator was selected to show the interpatient performance of the considered MPCs. The simulator is much more comprehensive than the multilevel MPC model and includes different sensors and actuators. These models are not considered as part of the nonlinear model used to obtain the prediction models of MPC. The trials were started at the initial condition of each patient given by the simulator and MPC in closed-loop mode. Multilevel MPC was tuned for the average adult patient. These tuning parameters gave a good response for the average patient, also with the low-order MPC, see
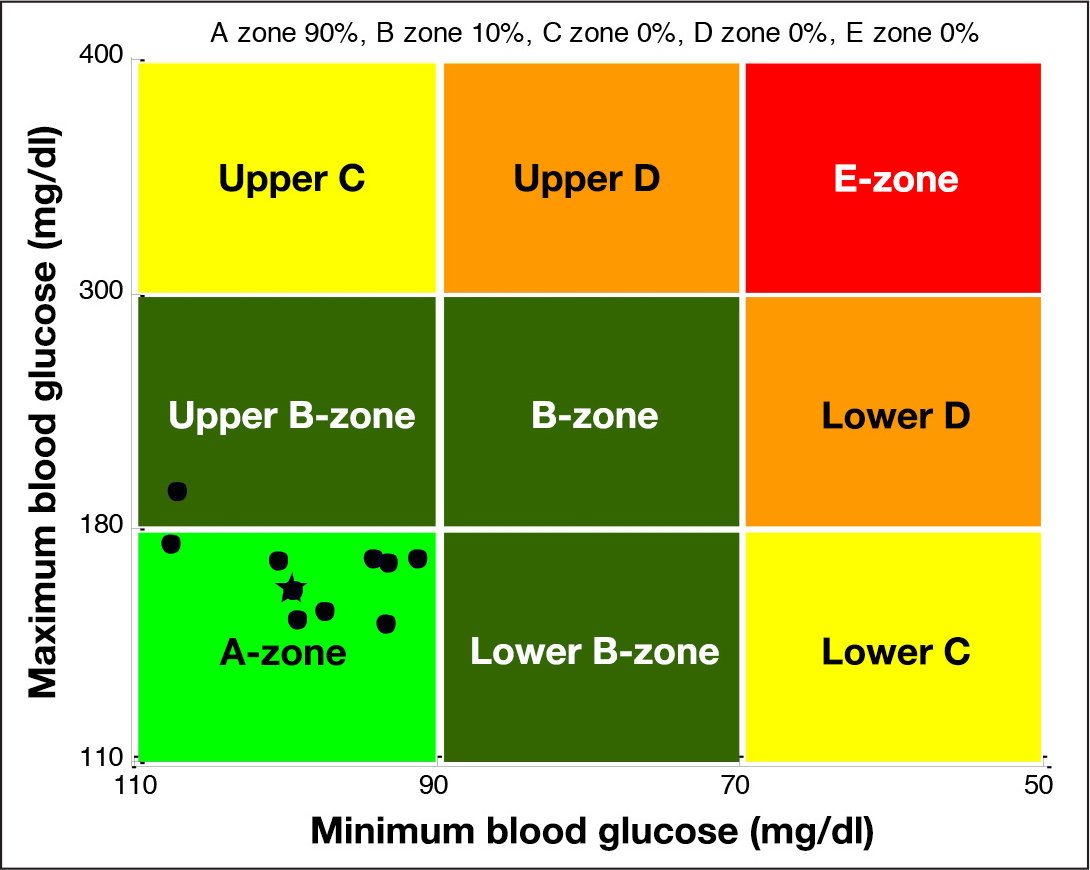
The CVGA for multilevel MPC. The grid is divided into nine square zones associated with different degrees of clinical risk ranging from A (excellent control) to E (poor control). Each circle represents the coordinates associated with a single patient (x is the minimum glucose value, and y is the maximum glucose value). The star mark represents the average patient used for nominal tuning.
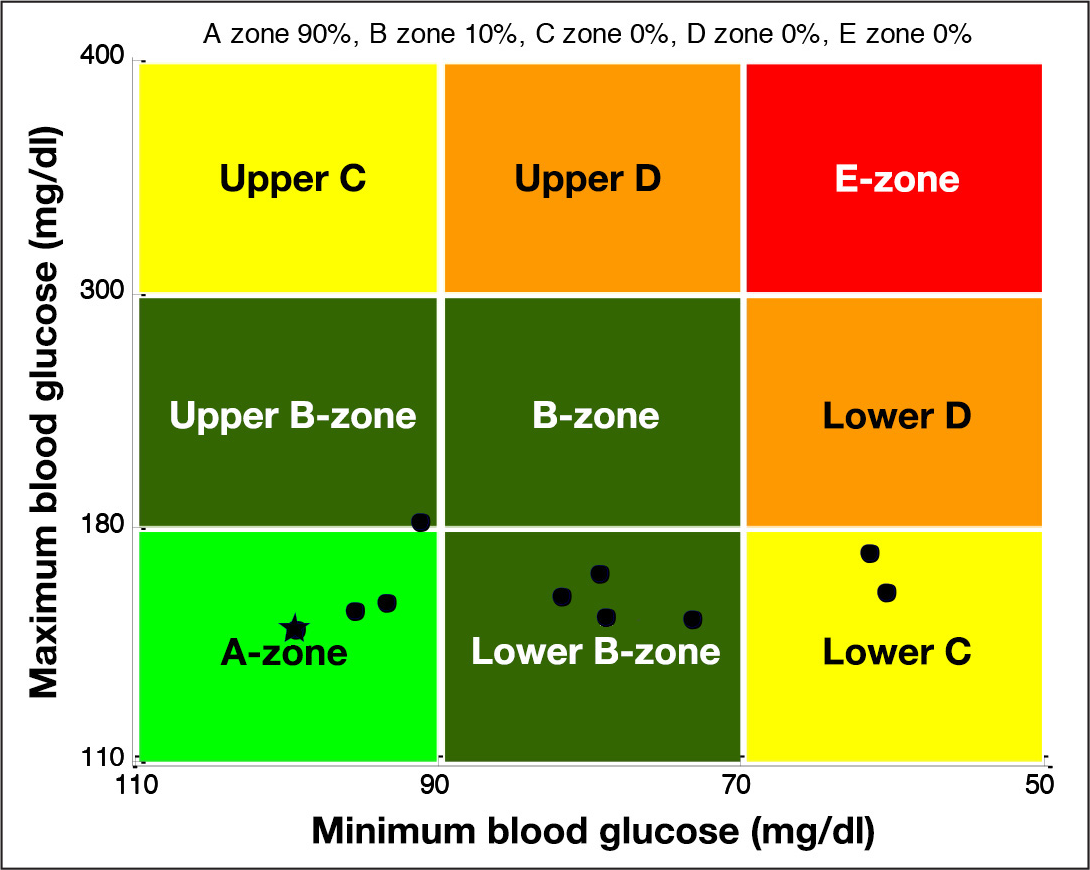
The CVGA for low-order MPC. The grid is divided into nine square zones associated with different degrees of clinical risk ranging from A (excellent control) to E (poor control). Each circle represents the coordinates associated with a single patient (x is the minimum glucose value, and y is the maximum glucose value). The star mark represents the average patient used for nominal tuning.
All individuals in the population received the same multiple meals routine provided by the simulator during 1 week scenario. The scenario includes five meals with a total of 205 g carbohydrates: breakfast at 07:00 with 45 g, lunch at 12:00 with 70 g, snack at 16:00 with 5 g, dinner at 19:00 with 70 g, and snack at 23:00 with 5 g.
The performance assessment is based on two different indexes: time percentage within ranges metrics and control variability grid analysis (CVGA).
17
Also, compared with the performance of MPC using the linearized Dalla Man model, multilevel MPC achieves significantly better performance, in particular, avoiding the hypoglycemic and hyperglycemic episodes found by Abu-Rmileh and Garcia-Gabin. 18
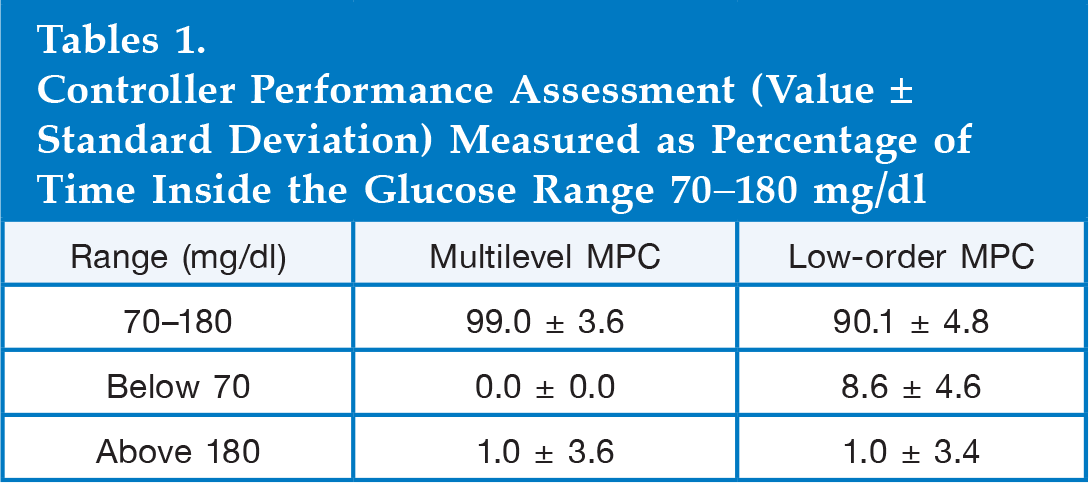
The performance of the two MPCs were also analyzed using the time percentage within ranges metric. This metric gives the percentage of the testing period time during which the patient's blood glucose is within the acceptable (70–180 mg/dl), hypoglycemic (<70 mg/dl), and hyperglycemic (>180 mg/dl) ranges. The results in
Controller Performance Assessment (Value ± Standard Deviation) Measured as Percentage of Time Inside the Glucose Range 70–180 mg/dl
Mean glucose and insulin profiles for the complete population are shown in
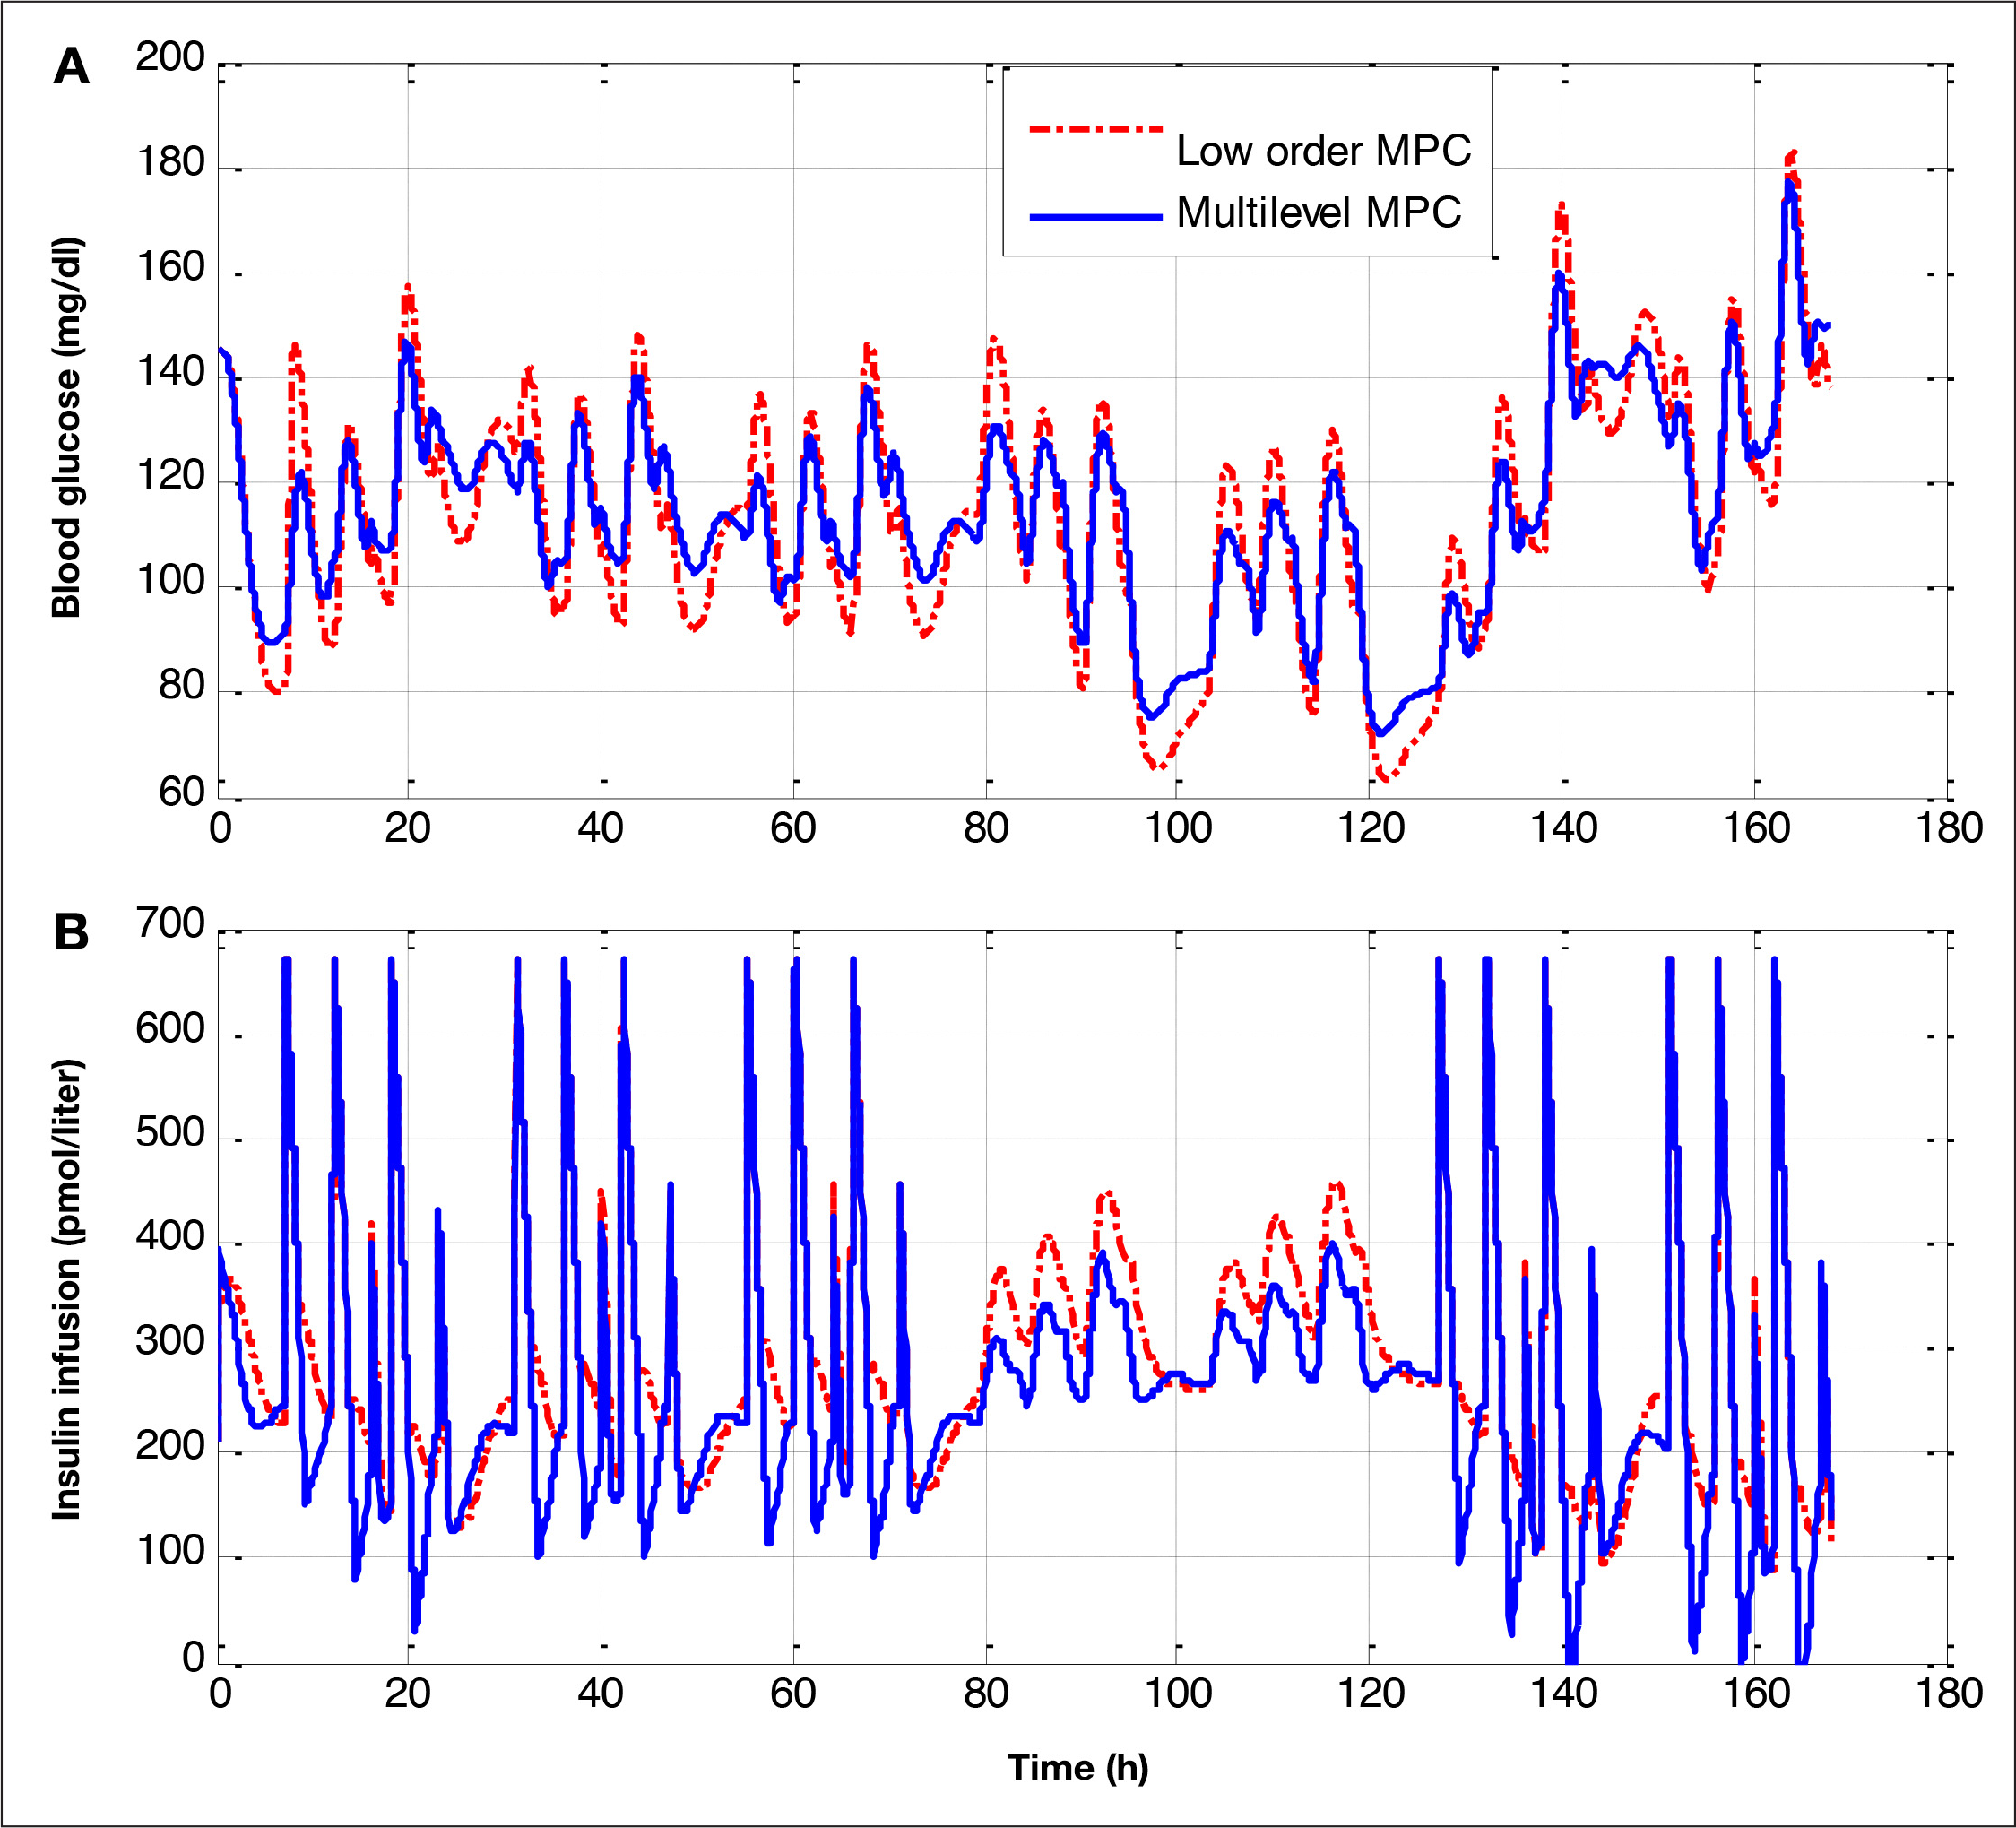
Mean glucose and insulin infusion profiles for all the population: multilevel MPC (solid) and low-order MPC (dotted red). The test is a 1 week scenario with the following changes: day 1, the controller has no estimation errors; days 2 and 3, the controller has the meals announced, with a 30% underestimation; days 4 and 5, the controller has no meal information; and, finally, days 6 and 7, the controller has the meals announced, with a 30% of overestimation.
Discussion
This work contributes three elements toward the quest for high-performance closed-loop glucose control of T1DM patients. First, it proposes a multilevel approach as a way to achieve an improved knowledge of glucose homeostasis. Second, it shows how an intracellular model can be added to an existing PKPD model to obtain a multilevel model. Finally, it illustrates how a controller based on a multilevel model improves glucose control performance.
Incorporation of intracellular information can be handled using a standard control technique such as MPC. Multilevel MPC showed an excellent performance mainly in two aspects. First, it showed excellent performance for intrapatient changes. The cloud of points that represents the behavior of the population of T1DM patients has a small dispersion
Conclusions
In this article, a novel approach has been presented to develop closed-loop glucose controllers based on multilevel models. The multilevel model developed incorporates information provided by a combination of a high-level model communicating with an intracellular signaling model. The novel result is that knowledge of the intracellular processes that affect the glucose dynamic significantly improves the control performance to achieve homeostasis. Multilevel models open new possibilities for designing closed-loop glucose control approaches, because they allow controllers to consider variables that have a key role in the glucose homeostasis that high-level models based on PKPD are not able to incorporate. The feasibility of the proposed approach was illustrated by developing a control scheme using a multilevel model incorporating a PKPD model combined with an insulin-signaling model. Multilevel MPC was tested and compared against low-order MPC using an in silico population of T1DM patients. Two remarkable results were obtained with MPC that explicitly utilizes multilevel information: no hypoglycemic events were registered and excellent performance for interpatient variability was achieved.