
Abstract
Background:
Increasing numbers of people with diabetes are adopting exercise programs. Fear of hypoglycemia, hypoglycemia itself, and injuries are major issues for many people with diabetes undertaking physical activity. The purpose of this study was to investigate the effects of type 1 diabetes mellitus on the risk of hypoglycemia, glycemic variability, exercise performance, changes in body composition, changes in insulin dosage, and psychosocial well-being during a multiday endurance exercise event.
Methods:
Eleven participants (7 with type 1 diabetes, 4 with normal glucose tolerance) undertook a 15-day, 2300 km cycling tour from Barcelona to Vienna. Data were prospectively collected using bike computers, continuous glucose monitors, body composition analyzers, and mood questionnaires.
Results:
Mean blood glucose in riders with and without diabetes significantly reduced as the event progressed. Glycemic variability and time spent in hypoglycemia did not change throughout the ride for either set of riders. Riders with diabetes in the lowest quartile of sensor glucose values had significantly reduced power output. Percentage body fat also significantly fell. Hypo- and hyperglycemia provoked feelings of anxiety and worry.
Conclusions:
This is the first study to describe a real-time endurance event in type 1 diabetes, and provides important new data that cannot be studied in laboratory conditions. Hypoglycemia continues to occurs in spite of peer support and large reductions in insulin dose. Glycemic variability is shown as a potential barrier to participation in physical activity through effects on mood and psychological well-being.
Undertaking physical activity can be challenging for people with diabetes; in particular matching insulin delivery with insulin requirements to enable provision of metabolic substrate to exercising muscles. 1 Failure to do so can lead to hypoglycemia, both during and after exercise. We aimed to investigate the incidence and timing of hypoglycemia over a multiday event in people with type 1 diabetes mellitus (T1DM). We also sought to assess glycemic variability, and how power output, heart rate and speed correlate with glucose. We studied cyclists with and without T1DM who undertook the Team Blood Glucose Diabetes Grand Tour, riding from Barcelona to Vienna over 15 days to increase diabetes awareness.
The primary fuel used by exercising muscles for submaximal aerobic exercise is glucose, sourced from muscle glycogen stores.2,3 As these stores are depleted, equilibrium between hepatic glucose production and glucose uptake at the exercising muscle is established. 4
Increased α-adrenergic receptor activation at the pancreatic islet during exercise reduces insulin secretion and increases the ratio of glucagon to insulin, enhancing hepatic glucagon sensitivity and increasing hepatic glucose output. 5 Skeletal muscle glucose uptake continues by insulin-independent translocation of glucose-transporter-4 (GLUT-4) receptors to the cell surface. 6 During anaerobic exercise, a 14- to 18-fold increase in catecholamines can precipitate a 7- to 8-fold increase in glucose production and muscle glycogenolysis. 7
Exogenously administered insulin does not fall on commencement of exercise and increased insulin exposure reduces hepatic glucose production leading to increased risk of hypoglycemia. 8 GLUT-4 transporters remain in place between 3 and 24 hours following exercise to replenish muscle glycogen stores and late hypoglycemia, 6-15 hours post exercise, is common. 9 Furthermore, the risk of hypoglycemia increases during exercise following antecedent hypoglycemia (within 24 hours before exercise) due to blunted counterregulatory reponses. 10 People with T1DM may need to consume additional carbohydrate to avoid hypoglycemia in subsequent exercise. 11 Hypoglycemia during exercise can be difficult to identify as the symptoms (sweating and elevated heart rate) mimic those experienced during exercise. Hypoglycemia is less likely to be identified during sleep following exercise. 12
Short bouts of intense anaerobic exercise in people with T1DM can result in hyperglycemia. The insulin rise seen in postanaerobic exercise in people without T1DM ensures muscle glycogen replenishment but is impaired in those with T1DM with resultant hyperglycemia. 13
The purpose of this study was to investigate the effects of T1DM on glycemic variability, the risk of hypoglycemia, exercise performance, changes in body composition, and psychosocial well-being during a multiday endurance exercise event.
Methods
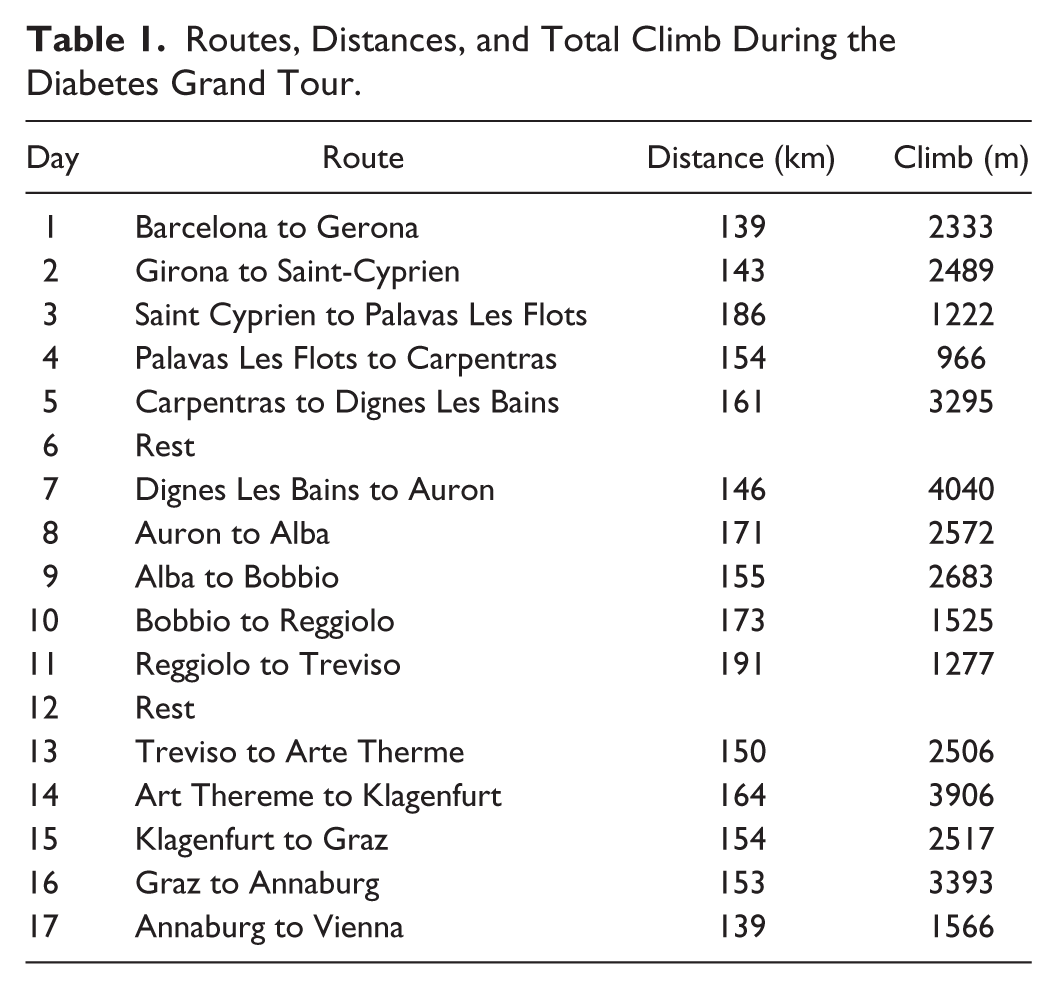
Participants were recruited from those taking part in the Team Blood Glucose Diabetes Grand Tour 2014; there were no exclusion criteria. The cyclists completed 15 days of riding between Barcelona and Vienna covering 2300 km with 2 rest days on Days 6 and 12 (Table 1). On most days, the cyclists began cycling at around 8
Routes, Distances, and Total Climb During the Diabetes Grand Tour.
All riders with T1DM (n = 7) and without T1DM (n = 4) wore continuous glucose monitors (CGM) throughout (Dexcom G4, San Diego, CA). Of those with diabetes, continuous subcutaneous insulin infusion (n = 5) and multidose injections (n = 2) were used. Measurements of capillary blood glucose were also recorded each day. CGM data were analyzed to identify periods of hypoglycemia. Three definitions of hypoglycemia and subsequent blood glucose values were used; <70 mg/dl, <60 mg/dl, and <50 mg/dl. Further analyses assessed differences in the percentage of time spent in hypoglycemia. Time periods for evaluation of percentage time spent were defined according to time of day (8
Body composition analysis was performed each morning using a Tanita body composition analyzer (Tokyo, Japan). Body mass (kg), body fat percentage, and fat free mass (kg) were recorded. All riders were asked to complete a standardized mood questionnaire daily, to list 5 emotions felt after each day’s ride, and to record thoughts and overall feelings. 15
Data on power output (watts), heart rate, speed (km/h), distance traveled (km), and altitude (m) were gathered using Garmin Edge 1000 (Olathe, KS, USA) bike computers. Data from the bike computers were matched to CGM from Dexcom G4 and all data were formatted to 5-minute averages. Change in glucose over each 5-minute period was correlated with change in power, speed and heart rate over the same 5-minute period. The data were exported into Golden Cheetah cycling analysis software (www.goldencheetah.org) and transferred to Microsoft Excel.
GraphPad Prism version 6.00 for Windows (GraphPad Software, La Jolla, CA, USA, www.graphpad.com) and Stata 13.0 (StataCorp, College Station, TX, USA) were used for statistical analysis and graph creation. Statistical significance was set at P < .05.
Results
Eleven people participated in the study; 7 had T1DM and 4 did not. There were 9 male and 2 female riders, with a mean age of 41 years (range 26-49). The mean body mass on day 1 was 79 kg (range 66.6-98.6 kg) and the mean duration of diabetes was 12.7 years (range 3-25 years).
The mean blood glucose value of the riders with (n = 7) and without diabetes (n = 4) was analyzed over the 3 stages of ride. There was a significant reduction in mean blood glucose for the riders with diabetes from between stages 1 and 2 (154.3 ± 0.7 vs 149.9 ± 0.7 mmol/L, P < .001) but no change between stages 2 and 3 (Figure 1A).
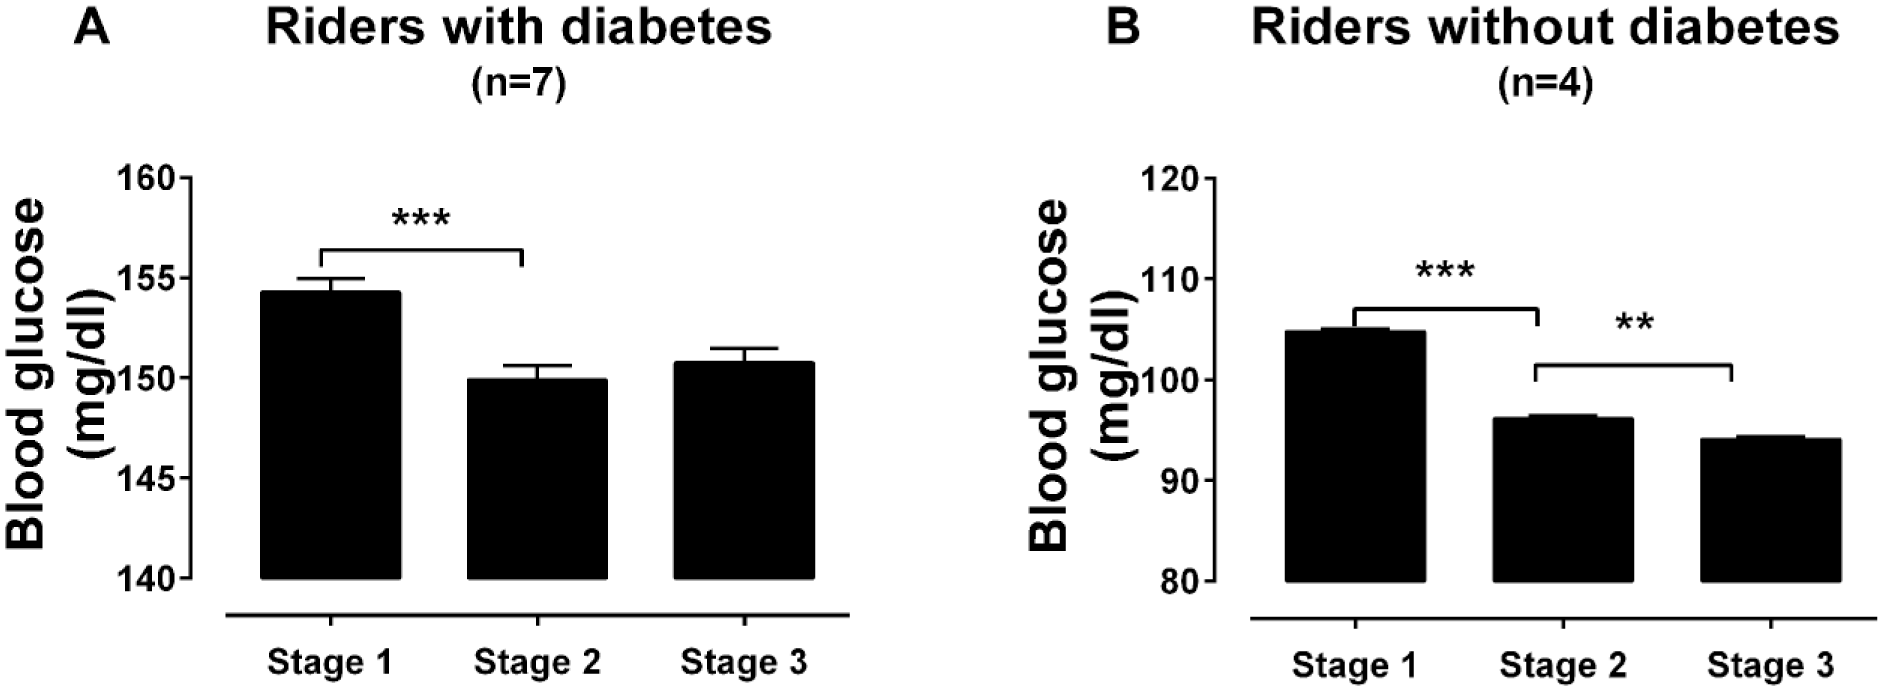
Mean blood glucose levels during the Team Blood Glucose Diabetes Grand Tour. Mean blood glucose (±SEM) of all riders (A) with diabetes and (B) without diabetes during the three 5-day stages of the Diabetes Grand Tour. **P < .01, ***P < .001 measured by Kruksal-Wallis test and Dunn’s multiple comparisons.
For the riders without diabetes a significant decrease in mean blood glucose occurred between stages 1 and 2 (104.8 ± 0.4 vs 96.1 ± 0.4 mmol/L, P < .001) and between stages 2 and 3 (96.1 ± 0.4 vs 94.1 ± 0.4 mmol/L, P < .001) (Figure 1B).
The mean blood glucose changes for each individual with diabetes across a 24 hour period for each stage is shown in Figure 2.
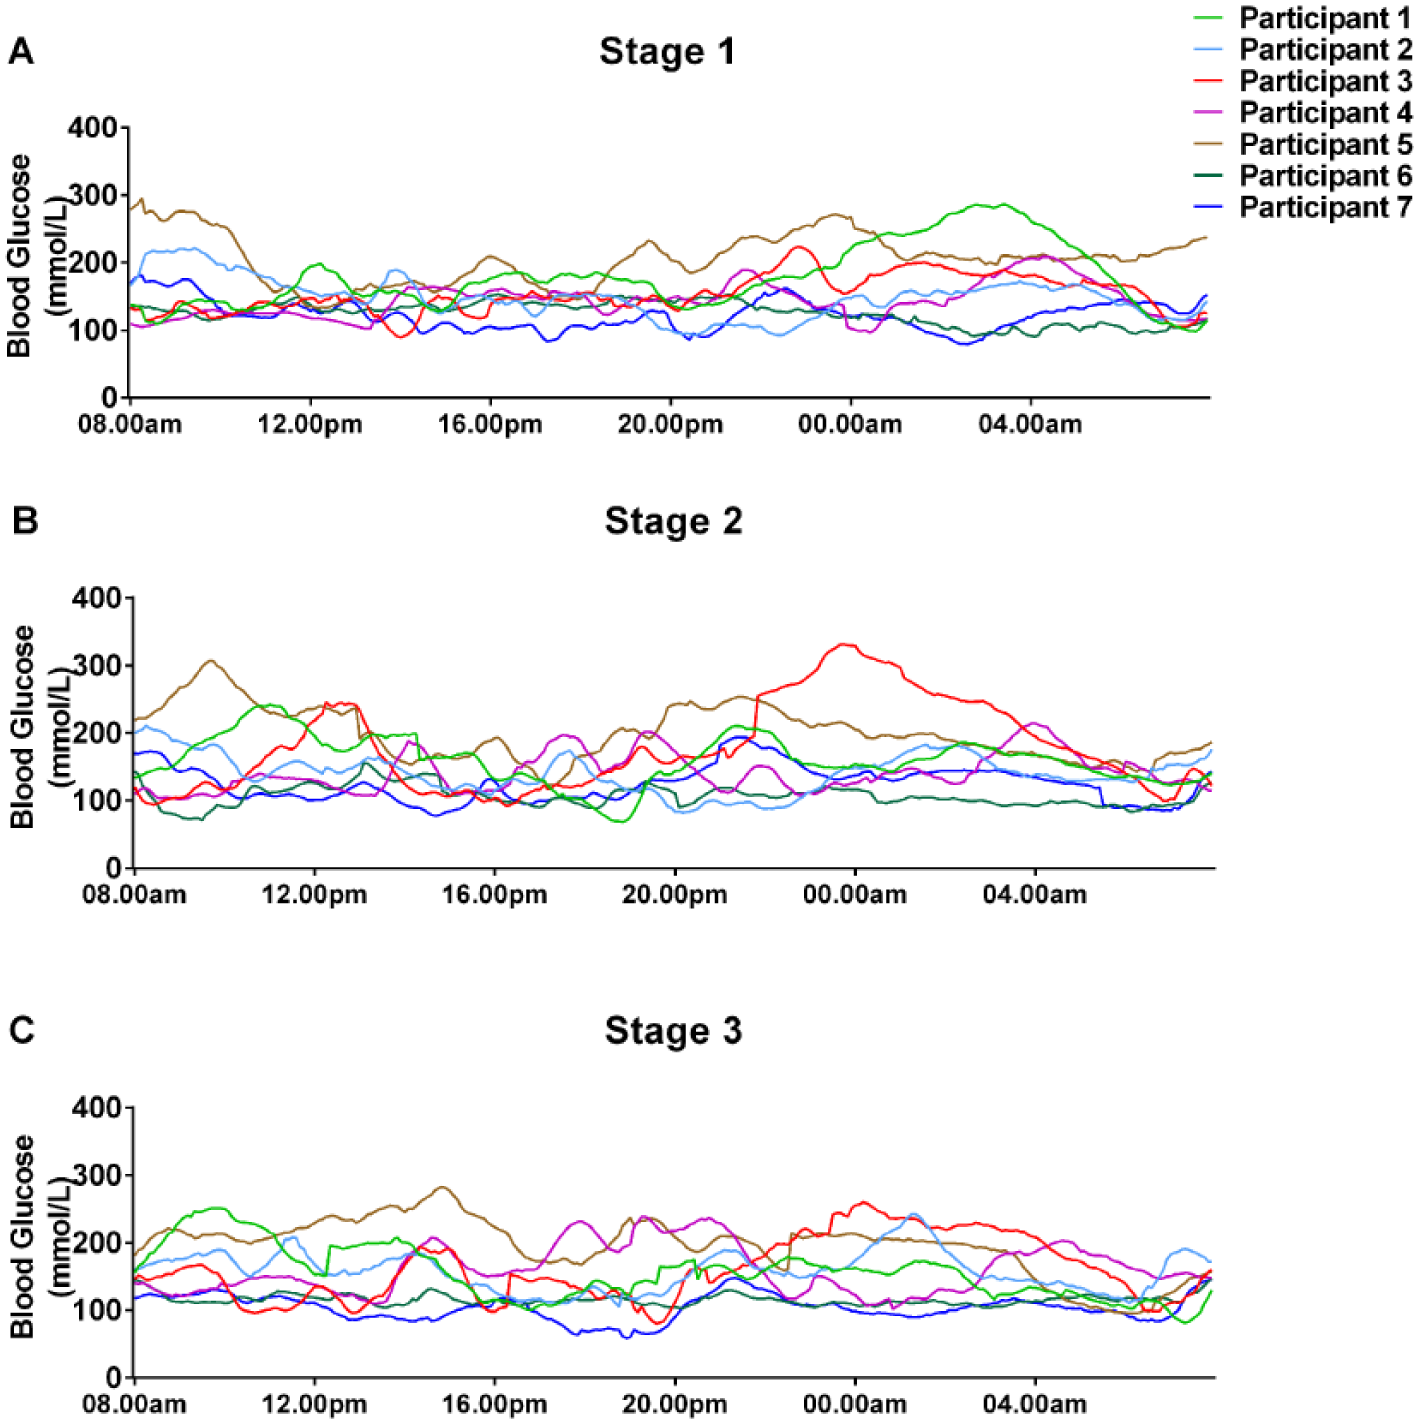
Blood glucose levels measured by continuous glucose monitoring during the Team Blood Glucose Diabetes Grand Tour. CGM glucose was measured in 7 riders with diabetes during (A) stage 1, (B) stage 2, and (C) stage 3. Each colored line represents a different participant with diabetes.
Random effects modeling showed that the presence of diabetes significantly increased glucose, independently of stage or time of day (+47.5 mg/dl, P = .004) (Table 2). Relative to 8
Blood Glucose of Cyclists in the Diabetes Grand Tour by Stage and Time Period of the Day.
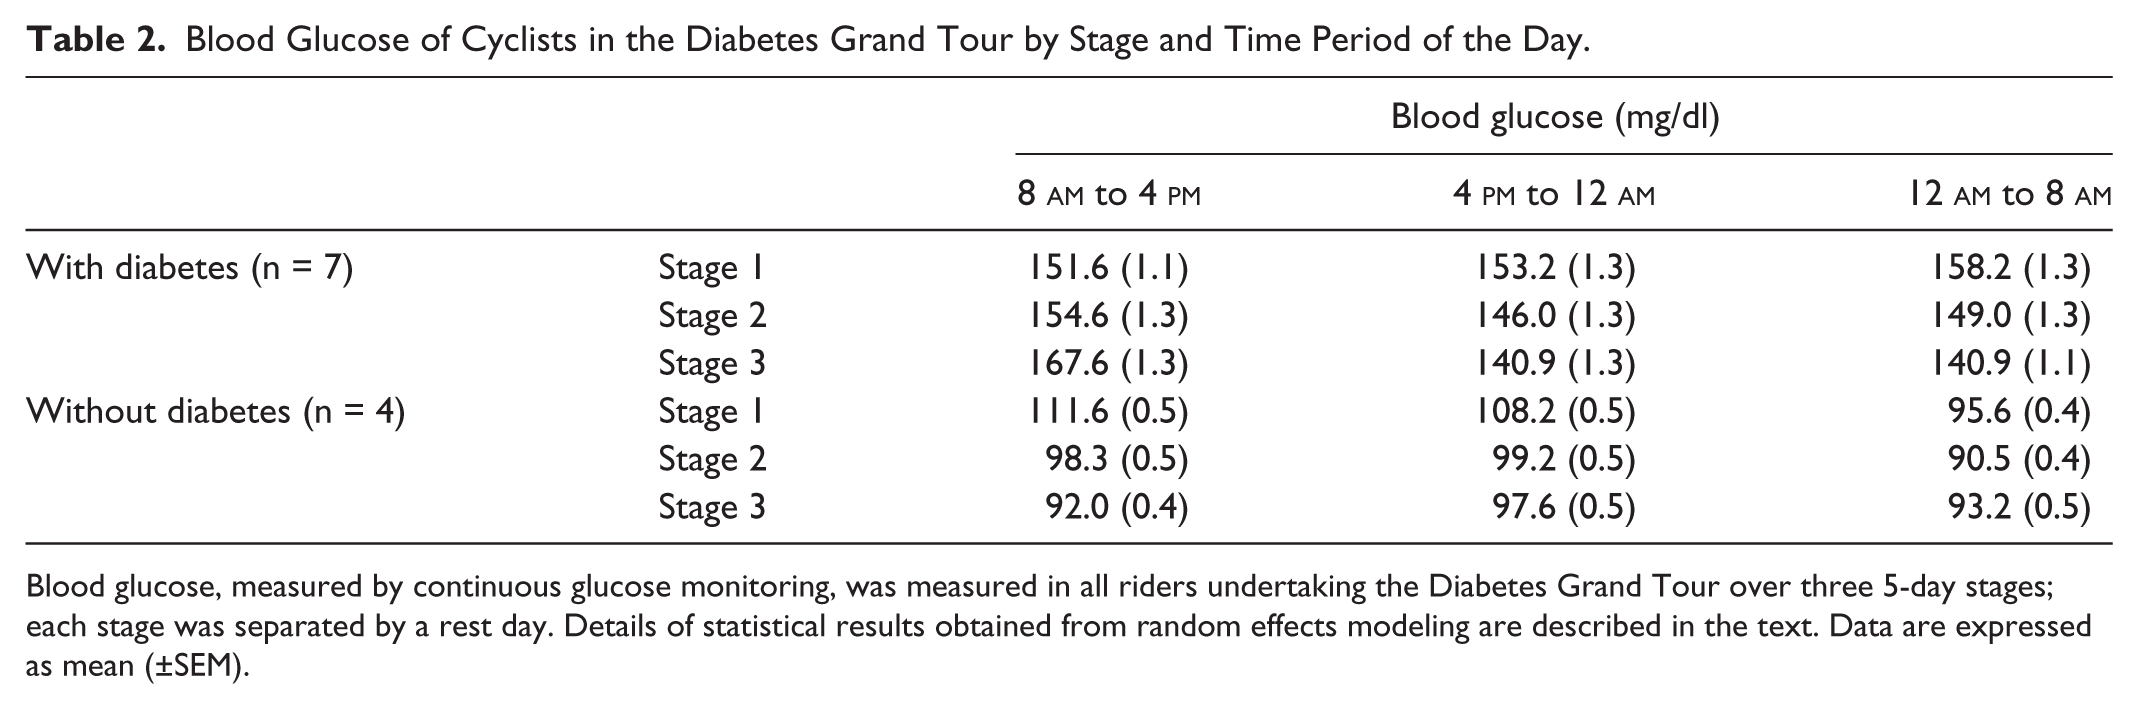
Blood glucose, measured by continuous glucose monitoring, was measured in all riders undertaking the Diabetes Grand Tour over three 5-day stages; each stage was separated by a rest day. Details of statistical results obtained from random effects modeling are described in the text. Data are expressed as mean (±SEM).
There was evidence for significant interaction between diabetes status, time of day and Stage when interaction terms were successively introduced into the random effects model. For example, the negative effect of 4
Mean percentage times in hypoglycemia were also investigated (Table 3). Independent effects of diabetes status, stage and time were again explored by random effects modeling, in this case within each definition of hypoglycemia. With hypoglycemia defined as blood glucose <70 and <60 mg/dl there were no significant effects on percentage time in hypoglycemia. With hypoglycemia defined as blood glucose <50 mg/dl, the presence of diabetes had the only effect, increasing percentage time in hypoglycemia with an independent effect size of +0.64% (P = .02).
Incidence of Hypoglycemia Experienced by Riders on the Diabetes Grand Tour.
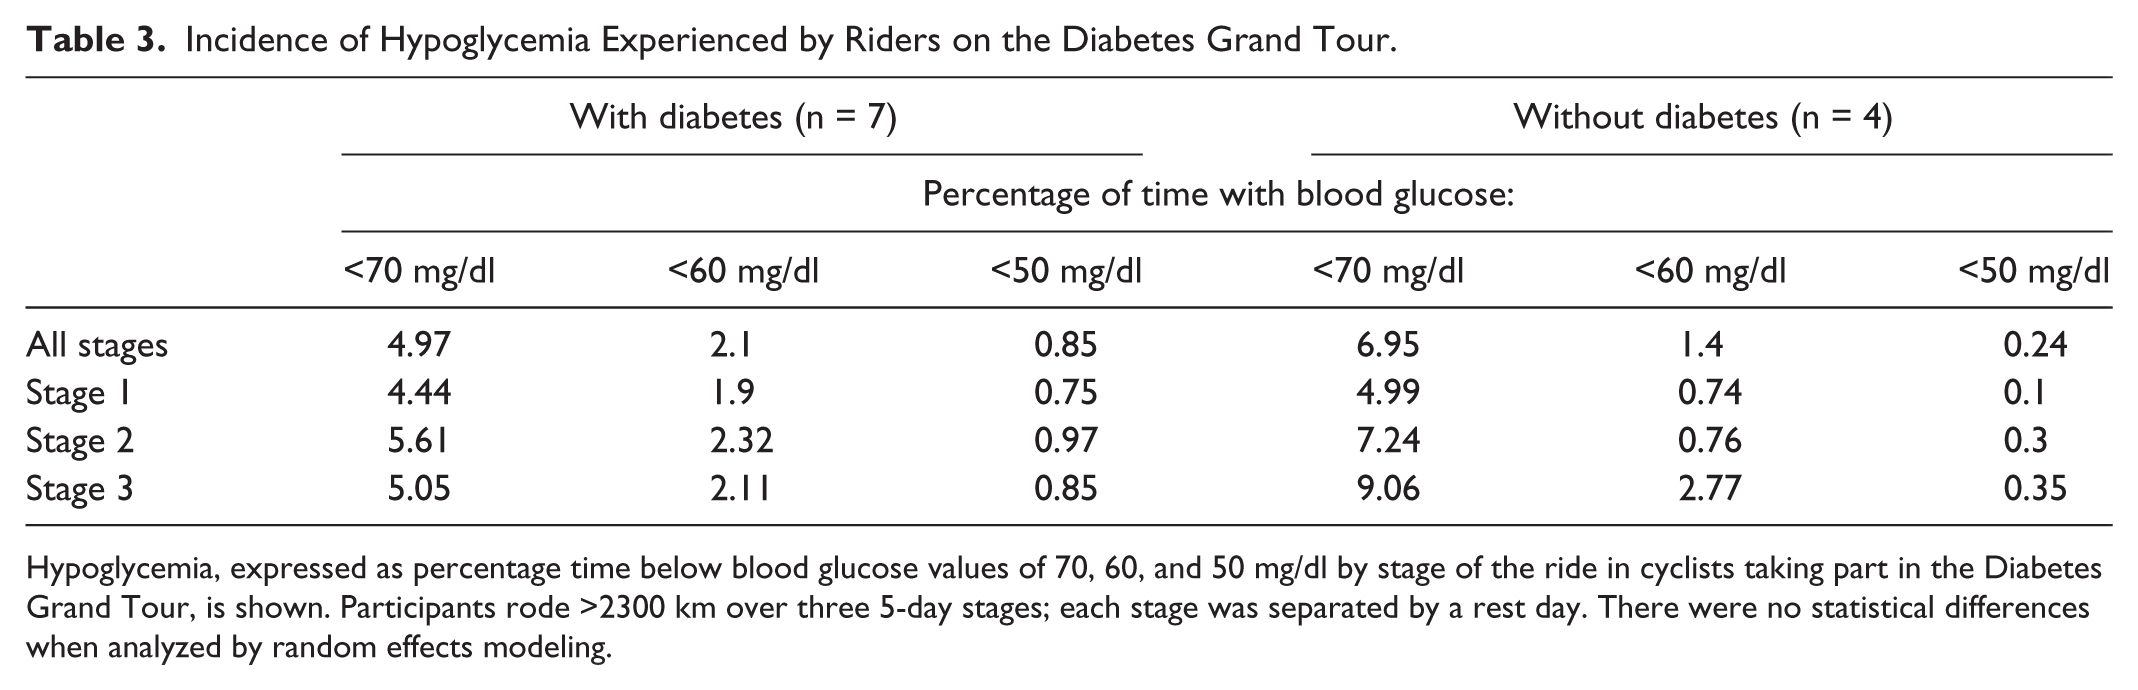
Hypoglycemia, expressed as percentage time below blood glucose values of 70, 60, and 50 mg/dl by stage of the ride in cyclists taking part in the Diabetes Grand Tour, is shown. Participants rode >2300 km over three 5-day stages; each stage was separated by a rest day. There were no statistical differences when analyzed by random effects modeling.
The SD of glucose in participants without diabetes were all within the normal reference range of <54 mg/dl. 14 Riders with diabetes had SDs regularly more than 54 suggesting more glycemic variability. However, there was no significant difference between the standard deviations during each stage or each time period of the day. In addition, there were no significant differences in LBGI between stages in the riders (both those with diabetes and without diabetes). There were also no changes in LBGI for riders between each 8-hour time period. During the event, the average daily insulin use was significantly reduced on ride days (0.31 units/kg/day) compared to rest days (0.48 units/kg/day, P < .05) (Figure 3).
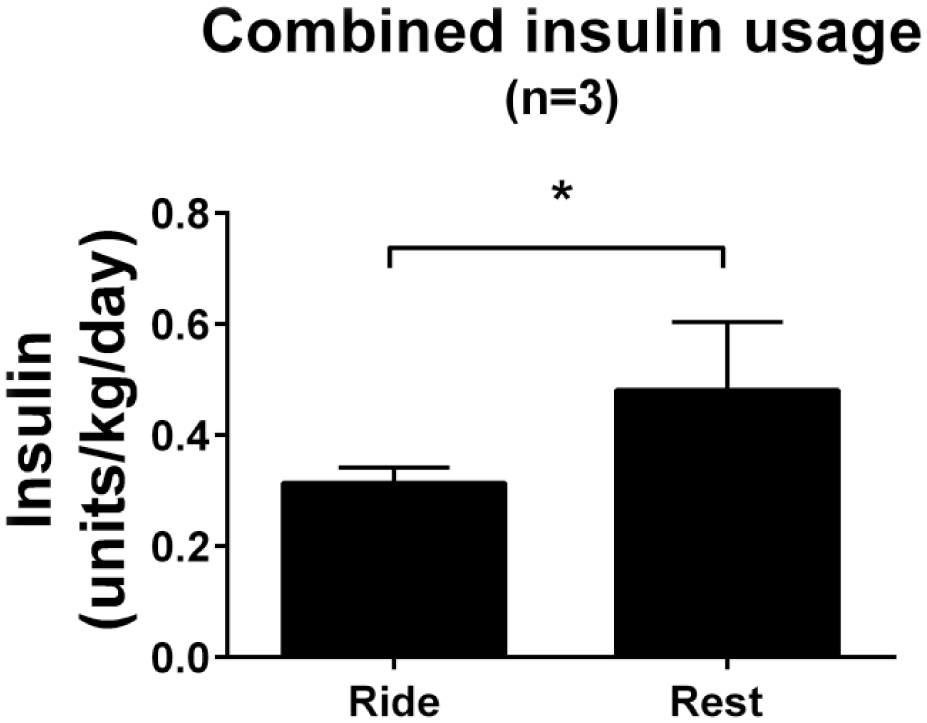
Insulin use during the Diabetes Grand Tour. Mean units of insulin/kg/day (±SEM) for n = 3 riders with diabetes analyzed by Mann-Whitney test.
For the 7 riders with diabetes there were no statistically significant correlations between change in glucose and change in power, speed and heart rate across the 15 days of the event. There was a significant positive correlation between heart rate and power for all the riders over the full length of the tour (r = .47, P < .001). Five of the riders with diabetes had adequate power recordings to assess power output within blood glucose quartiles of ≤70 mg/dl, 70-140 mg/dl, 141-200 mg/dl, and >200 mg/dl (Figure 4). When the blood glucose was ≤70 mg/dl the mean power output was significantly lower compared to the 70-140 mg/dl range (68.6 ± 70 vs 114.4 ± 1.1 watts, P ≤ .001).

Relationship between power output and glucose in people with diabetes. Mean (±SEM) power output of the riders with diabetes in specified glucose ranges. ***P < .001 vs all other groups measured by Kruksal-Wallis test and Dunn’s multiple comparisons test.
Body composition analysis of all riders demonstrated a significant reduction in mean percentage body fat between Day 1 and Day 15 of the ride (17.2 ± 2.4 vs 15.7 ± 50%, P ≤ .05). There were no significant changes in body mass or fat free mass.
Only 3 riders completed the mood questionnaire in full for each day. Questionnaire completion significantly reduced over the duration of the study (Figure 5). Words used to describe periods of hypoglycemia which had affected the riders’ performance were “frustrated,” “angry,” “grumpy,” “upset,” and “emotional” reflecting the negative feelings attributed to hypoglycemia. The extended comments boxes were often used to describe hypoglycemia and how this affected mood and performance.
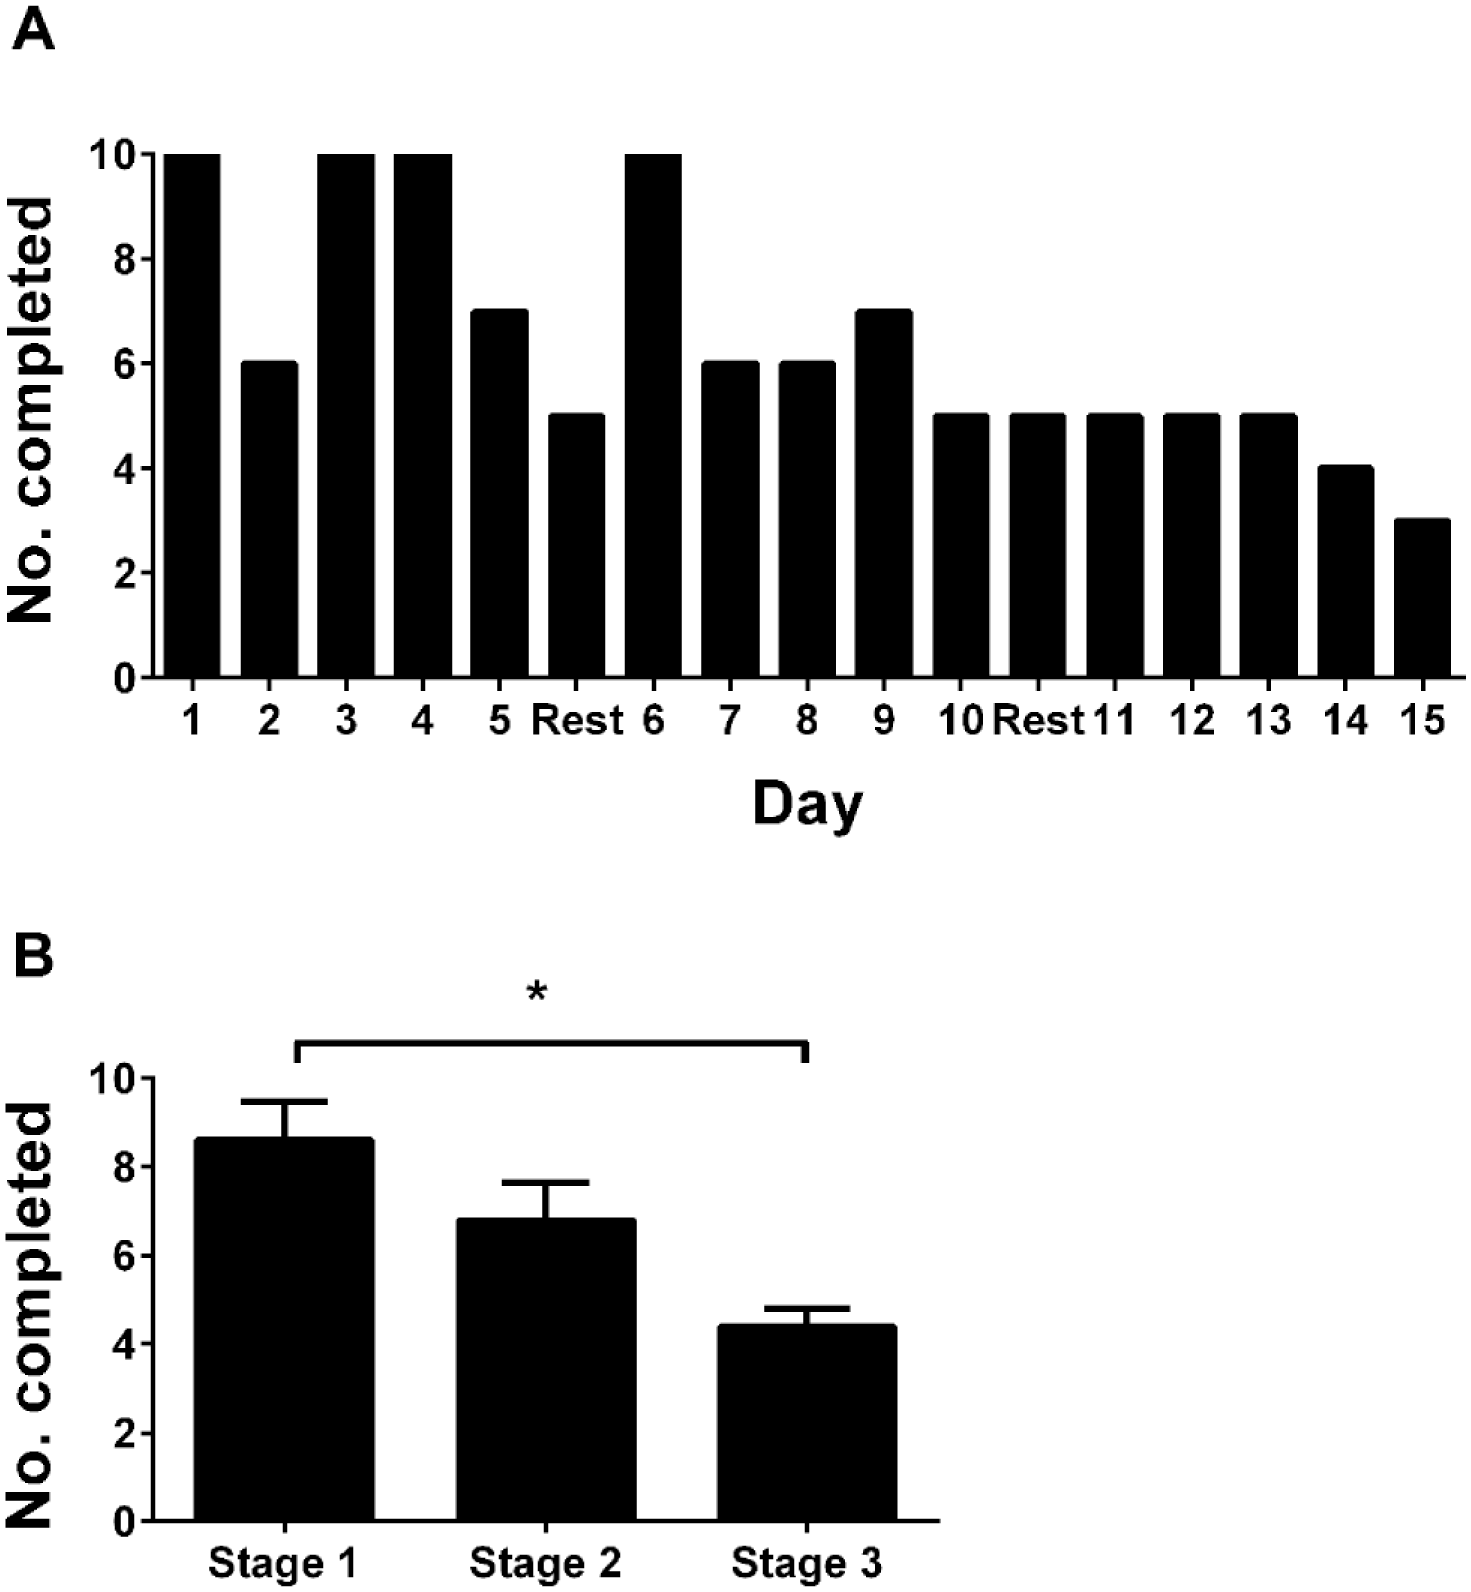
Mood questionnaire completion. Number of participants completing mood questionnaires each day (A), and mean (±SEM) number of completed questionnaires per stage (B). *P < .05 measured by Kruksal-Wallis test and Dunn’s multiple comparisons test.
Hyperglycemia provoked feelings of anxiety and worry with riders describing low mood, stress and frustration and 1 rider described having to stop the ride and use the support bus due to “unexplained” hyperglycemia.
Discussion
This study is the first of its kind to use a multiday endurance exercise event to assess the interactions between T1DM and exercise performance, mood, and glycemic control, with a comparator cohort with normal glucose tolerance. A substantial reduction in mean blood glucose was noted for both riders with and without diabetes over the duration of the ride, without increased hypoglycemia, demonstrating the impact of endurance exercise in people with maintained homeostasis. Power output was significantly impaired during hypoglycemia in the riders with diabetes, and hypo- and hyperglycemia provoked feelings of worry and anxiety and were shown as a potential barrier to participation in physical activity.
For the riders with diabetes, the 4.3 mg/dl reduction in mean blood glucose from stage 1 to stage 2 could be attributed to a number of reasons. As the ride progressed there is likely to have been greater demand for metabolic substrate, and increased insulin sensitivity, thus increasing the risk of hypoglycemia due to difficulty in matching exogenous insulin to carbohydrate on ride days. Other published data suggest insulin requirements are consistently reduced by 6-15% during exercise, however our data show that hypoglycemia still occurred in spite of insulin dose reductions of around 30%, suggesting that required insulin dose reductions may be well in excess of those previously estimated.16,17
The significant reduction in percentage body fat may also partly explain the reduced mean blood glucose. Adiponectin, an adipocytokine secreted solely from adipocytes, levels are higher in people who are lean compared to those who are obese.18,19 Furthermore, adiponectin has been shown to have an insulin sensitizing function via activation of AMP-activated kinase in both skeletal muscle and the liver by increasing skeletal muscle glucose uptake and reducing hepatic gluconeogenesis respectively.20-22 Thus a decrease in percentage body fat and a rise in adiponectin could explain the fall in mean blood glucose.
The decrease in mean blood glucose from stage 1 to stage 3 amongst the riders without diabetes was 10.6 mg/dl. One study has shown a marked increase in postprandial glycemia amongst volunteers with normal glucose tolerance during 3 days of physical inactivity. 23 Our study suggests that endurance exercise has a significant impact on the short-term glucose control of people without diabetes although it is important to note there were only 4 riders in this group. The mechanism for this is a presumed increase in insulin sensitivity as the ride progressed, as suggested by the increased time spent with a reported sensor glucose <70 mg/dl.
Many exercise studies take place in controlled laboratory conditions, thus there is little evidence for people with T1DM on how to self-manage their diabetes during longer periods of intense exercise such as training camps or endurance feats like this ride. 24 This study, the first of its kind, provides initial data that will contribute to supporting people to manage their diabetes and improve performance.
The effects of blood glucose levels on power output were inconclusive. Overall there was no correlation between a change in power output and a change in blood glucose however, when splitting the blood glucose into quartiles, power output was significantly lower in the hypoglycemic range. Low blood glucose would limit exercising muscles’ capacity to maintain work and has been shown to curtail both physical and cognitive performance in sport. 25 The present study adds some important data on the effects of low blood glucose on cycling power and performance in people with T1DM however a larger sample will be needed to further strengthen these conclusions.
The collection and analysis of the mood questionnaires was an important aspect of the study as hypoglycemia has frequently been identified as one of the strongest barriers to physical activity in people with T1DM. 26 Suboptimal glycemic control was a major concern for many of the riders with diabetes before the ride and the preride questionnaires stated many hoped to gain better knowledge of blood glucose control during endurance exercise. It is clear from the responses to the questionnaires that hypo- and hyperglycemia had a profound impact on many of the riders to the point where 1 rider “did not complete the total distance of the day in order to gain better control”—highlighting the potential of poor glucose control as a barrier to participation. There are number of potential reasons why the psychosocial data were incomplete including increased tiredness at the end of the day and time required to complete. Prevalence of depression is higher in adults with T1DM than the general population and those who are depressed often have worse medical outcomes.27,28 This study provides pilot qualitative data which can be used a framework for future research exploring the interrelationship between mood, activity, and diabetes.
This study is limited by a small number of participants and CGM data should be interpreted with caution as sensor accuracy can be poor, particularly in the hypoglycemic range. 29 In addition, the lack of carbohydrate and small number contributing to the insulin dosage data limit the interpretation of the glucose data. However, the strengths of the study lie in the large volume of CGM data collected for each participant and in the originality of the data. This is the first study to analyze data collected from 15 days of a real-time endurance event and it will add to the current literature which has very little describing the effects of endurance exercise on glycemic control, mood and performance of people with T1DM.
Conclusions
People with diabetes undertaking exercise, and those trying to support them, are often reliant on anecdotal or trial-and-error methods of management. This preliminary study has shown the effects of endurance exercise on lowering the blood glucose of both people with and without diabetes, and also how this can contribute to an increased risk of hypoglycemia. The study has also begun to explore the effects of blood glucose on power output during cycling and provided insightful data regarding the psychology of athletes with diabetes. This study lays the foundations for further research in the field of endurance exercise in T1DM.
Footnotes
Acknowledgements
We would like to thank the Diabetes Grand Tour participants, Professor Katherine Barnard (Southampton University) for advice on psychosocial questionnaires, and Mark Liversage (Golden Cheetah) for assistance with the Garmin data analysis. NEH and CC contributed equally to this work.
Abbreviations
CGM, continuous glucose monitor; GLUT-4, glucose-transporter-4; LBGI, low blood glucose index; SD, standard deviation; SEM, standard error of the mean; T1DM, type 1 diabetes mellitus.
Declaration of Conflicting Interests
The author(s) declared the following potential conflicts of interest with respect to the research, authorship, and/or publication of this article: NSO has received honoraria for advisory board membership from Roche and Abbott Diabetes.
Funding
The author(s) disclosed receipt of the following financial support for the research, authorship, and/or publication of this article: The Diabetes Grand Tour was partially funded by Roche and Johnson & Johnson, and Dexcom provided the CGM monitors. The funders had no role in study design, data collection and analysis, decision to publish, or preparation of the manuscript.