
Abstract
Aims:
We previously demonstrated that people with type 2 diabetes (T2DM) can improve their ability to categorize blood glucose (BG) results into low, in range, or high glycemic ranges after experiencing a color range indicator (CRI or ColorSure™ Technology) in a single meter. This study examined whether a CRI was effective in people with type 1 (T1) or T2DM when used in 3 glucose meters.
Methods:
A total of 179 subjects (139 T2DM and 40 T1DM) classified BG values as low, in range, or high based on individual current knowledge. Subjects then experienced the CRI which showed whether different BG values were low, in range, or high. After CRI interaction, subjects repeated the classification.
Results:
Following interaction with the CRI, subjects significantly improved their ability to categorize BG results into low, in range, and high glycemic ranges by 27.9% (T2DM) and 27.2% (T1DM) (each P < .001). Improvement was not accompanied by an increase in time spent categorizing results. There was no difference in classification ability between subjects with T1 or T2DM. There was also no correlation between HbA1c, numeracy level, test frequency, or duration of diabetes and the ability to correctly classify results. Subjects agreed the CRI feature helped them easily interpret glucose values and improved their awareness of glucose ranges.
Conclusion:
Interaction with a CRI improved the ability of subjects with T1 and T2DM to interpret and categorize BG values into recommended glycemic ranges, irrespective of the glucose meter providing the CRI insights.
Keywords
Self-monitoring of blood glucose (SMBG) is an integral component of effective diabetes management, allowing patients to evaluate their individual response to therapy and assess whether individual glycemic targets are being achieved.1,2 Appropriate education addressing SMBG interpretation and particularly the response to “out of-range” blood glucose (BG) results are prerequisites for the useful performance of SMBG.3,4 Recent studies have highlighted the issue of interpreting and responding to SMBG. A study in 207 patients with T2DM 5 investigating perceptions of high BG results demonstrated that the subjects were more tolerant of high BG levels than is clinically advisable. In addition, a survey of 886 people with T2DM showed that about half of insulin and non-insulin-using patients with T2DM regularly took no action for out-of-range BG values (low or high) with any self-care adjustments. 6 We recently reported that a blood glucose meter (BGM) that provides automatic on-screen glucose range information using a color range indicator (CRI) significantly improved the ability of subjects with T2DM to classify BG readings into low, in range, or high glycemic ranges. 7 This may support optimal diabetes self-management.
In the current study, we investigated whether a CRI tool was effective when delivered on 2 additional BGMs. In addition, since people with T1DM perform more frequent SMBG than people with T2DM and perceptions exist that they are more adept at interpreting SMBG data, 8 we explored the effect of a CRI on subjects with T1DM. Finally, because poor numeracy skills have been associated with suboptimal glycemic outcomes in people with both T2DM 9 and T1DM, 10 we investigated the relationship between interpreting SMBG data and numeracy.
Subjects
The study was conducted at 3 National Health Service (NHS) clinics in the UK (Highland Diabetes Institute, Inverness; Edinburgh Royal Infirmary, Edinburgh; Birmingham Heartlands Hospital, Birmingham) and approved by the relevant ethics committees. Subjects provided written informed consent before starting the study. Subjects were aged ≥16 years, diagnosed with diabetes for at least 6 months and currently performing SMBG. Subject’s most recent laboratory A1c result (within the last 6 months) was obtained from the NHS database.
Materials and Methods
Blood Glucose Meters
Subjects utilized PC-based computer simulations of OneTouch Select® Plus (OTSP) meter in 59 subjects with T2DM; OneTouch VerioFlex™ (OTVF) meter in 40 different subjects with T2DM; OneTouch Verio® (OTV) meter in 80 different subjects, 40 T2DM and 40 T1DM. All 3 meters are marketed by LifeScan Inc (Wayne, PA).
CRI Feature
Subjects experienced the CRI feature (ColorSure™ Technology) using interactive computer simulators that mirrored the displays of the respective glucose meters. The CRI tool automatically indicates whether the BG result displayed on the screen is “low” (below range), “in range,” or “high” (above range). The CRI on OTSP uses a note that points to a blue, green or red bar on the meter casing and displays the text “low,” “in range,” or “high” (Figure 1A). OTVF uses a simple arrow (without text) to indicate the glucose range (Figure 1B). In OTV, a CRI color dot appears alongside text on each results screen to indicate the glucose range (Figure 1C). The message depends on the glucose range set in the meter by the patient or health care professional (HCP). Low (<70 mg/dl), in range (70-180 mg/dl), and high (>180 mg/dl) default limits are provided preset in the meter and were used in this study.
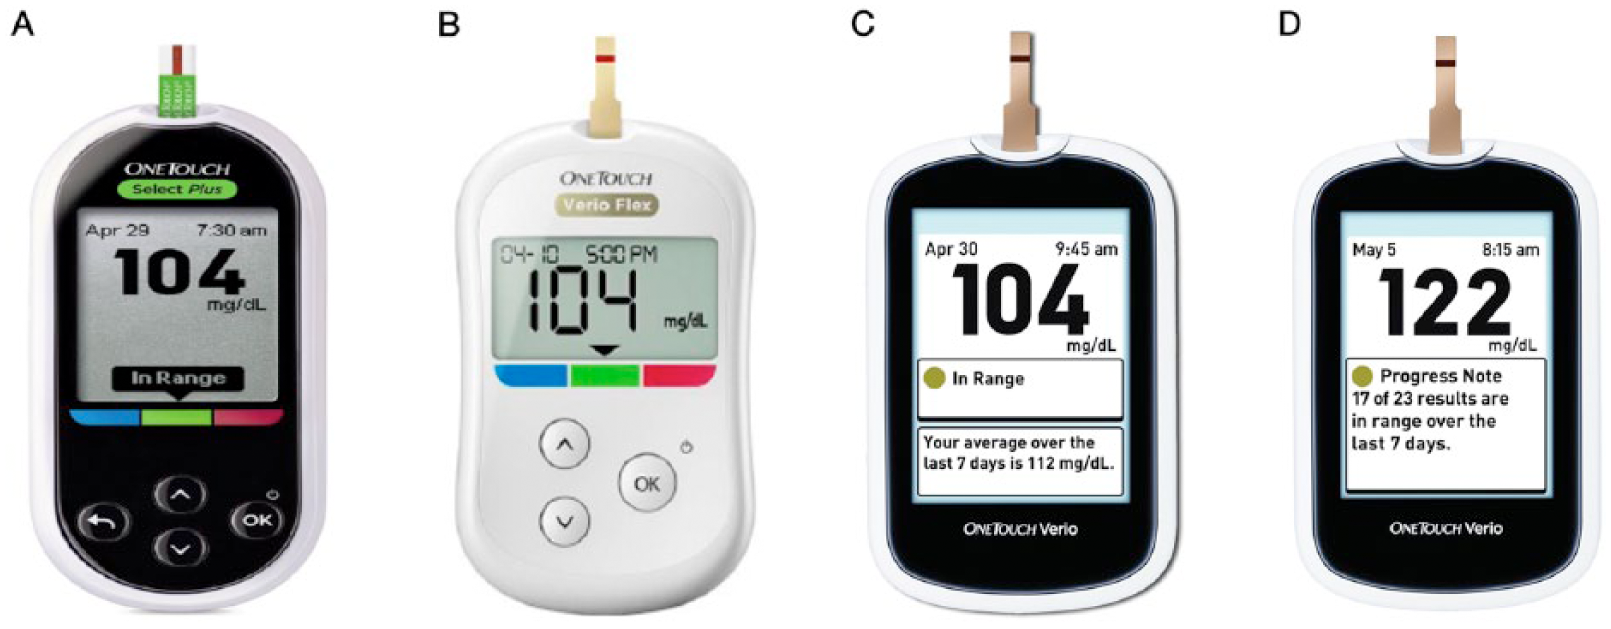
BGM color range indicator (CRI) and progress notes screens. (A) OneTouch Select Plus, CRI; (B) OneTouch Verio Flex, CRI; (C) OneTouch Verio, CRI; (D) OneTouch Verio, Progress Notes.
Progress Notes Feature
In addition to the CRI, OTV displays progress notes that automatically describe how many BG results are in range over the last 7 days (Figure 1D). 11 The algorithm displays a progress note when ≥70% of results are within the customizable range limit. The value of this feature to patients was explored via logbook comparisons and subject surveys.
Study Design
Glucose Readings Classification
Step 1
Subjects classified 50 glucose readings as low, in range, or high based on their current knowledge.
Step 2
Subjects interacted digitally with BGM simulators to experience how the CRI tool classified a different set of 30 glucose readings. Subjects used a mouse to click on the test strip picture on the screen to visually insert a strip into the meter and then clicked on the test strip edge to simulate a 5 second blood glucose test. After 5 seconds, a preprogrammed glucose reading with the appropriate CRI low, in range, or high message (note, arrow, or dot) was displayed. Subjects repeated this process at their own pace to simulate 30 home glucose tests. Subjects then interactively scrolled through these results either using the results log history (OTSP and OTVF) or simply reviewed the results screens (OTV) showing how each BGM categorized the results.
Step 3
Subjects repeated the original exercise in step 1 to classify the original 50 glucose readings.
The study facilitator recorded the time it took subjects to complete each step. The default glycemic ranges were not disclosed to subjects during any of these steps.
Progress Notes Feature
After the CRI exercises, 169 subjects (40 T1DM; 129 T2DM) reviewed BG results on a paper logbook in which 7 of 10 logbook results were in range. At this time the facilitator explained that in range meant 70-180 mg/dl and this range was also written on the logbook itself. Each subject was asked to review identical logbooks and determine how many logbook results were in range in the last 7 days. Each subject was then shown the progress notes screen in OTV and asked to confirm how many results were in range in the last 7 days.
Subjective Numeracy Scale (SNS) Evaluation
In all, 40 T1DM and 129 T2DM subjects took part in a subjective numeracy assessment using the Subjective Numeracy Scale (SNS), which comprised 8 numeracy statements with 6 potential responses for each statement that most represented themselves. 12 A total numeracy score was determined for each subject.
Subject Surveys
After all study procedures were completed, subjects completed surveys to investigate their knowledge of glucose ranges and explore how subjects interpret and might respond to low or high glucose readings. Finally, subjects expressed their perception of the value of the CRI tool and progress notes features with respect to managing their diabetes.
Statistical Analyses
Continuous demographic variables were described as median and range or mean and standard deviation (SD). Categorical demographic variables were described as percentages within categories. Test score changes were calculated as the percentage change from baseline. The null hypothesis “H0: Pretraining score = posttraining score” was tested using a paired t-test with a significance level α = .05. Correlations with A1c and other variables were assessed using the Pearson correlation coefficient and were deemed significant at P < .05. Minitab 16.1.1 and SPSS 21.0 were used for all analyses.
Results
Subjects
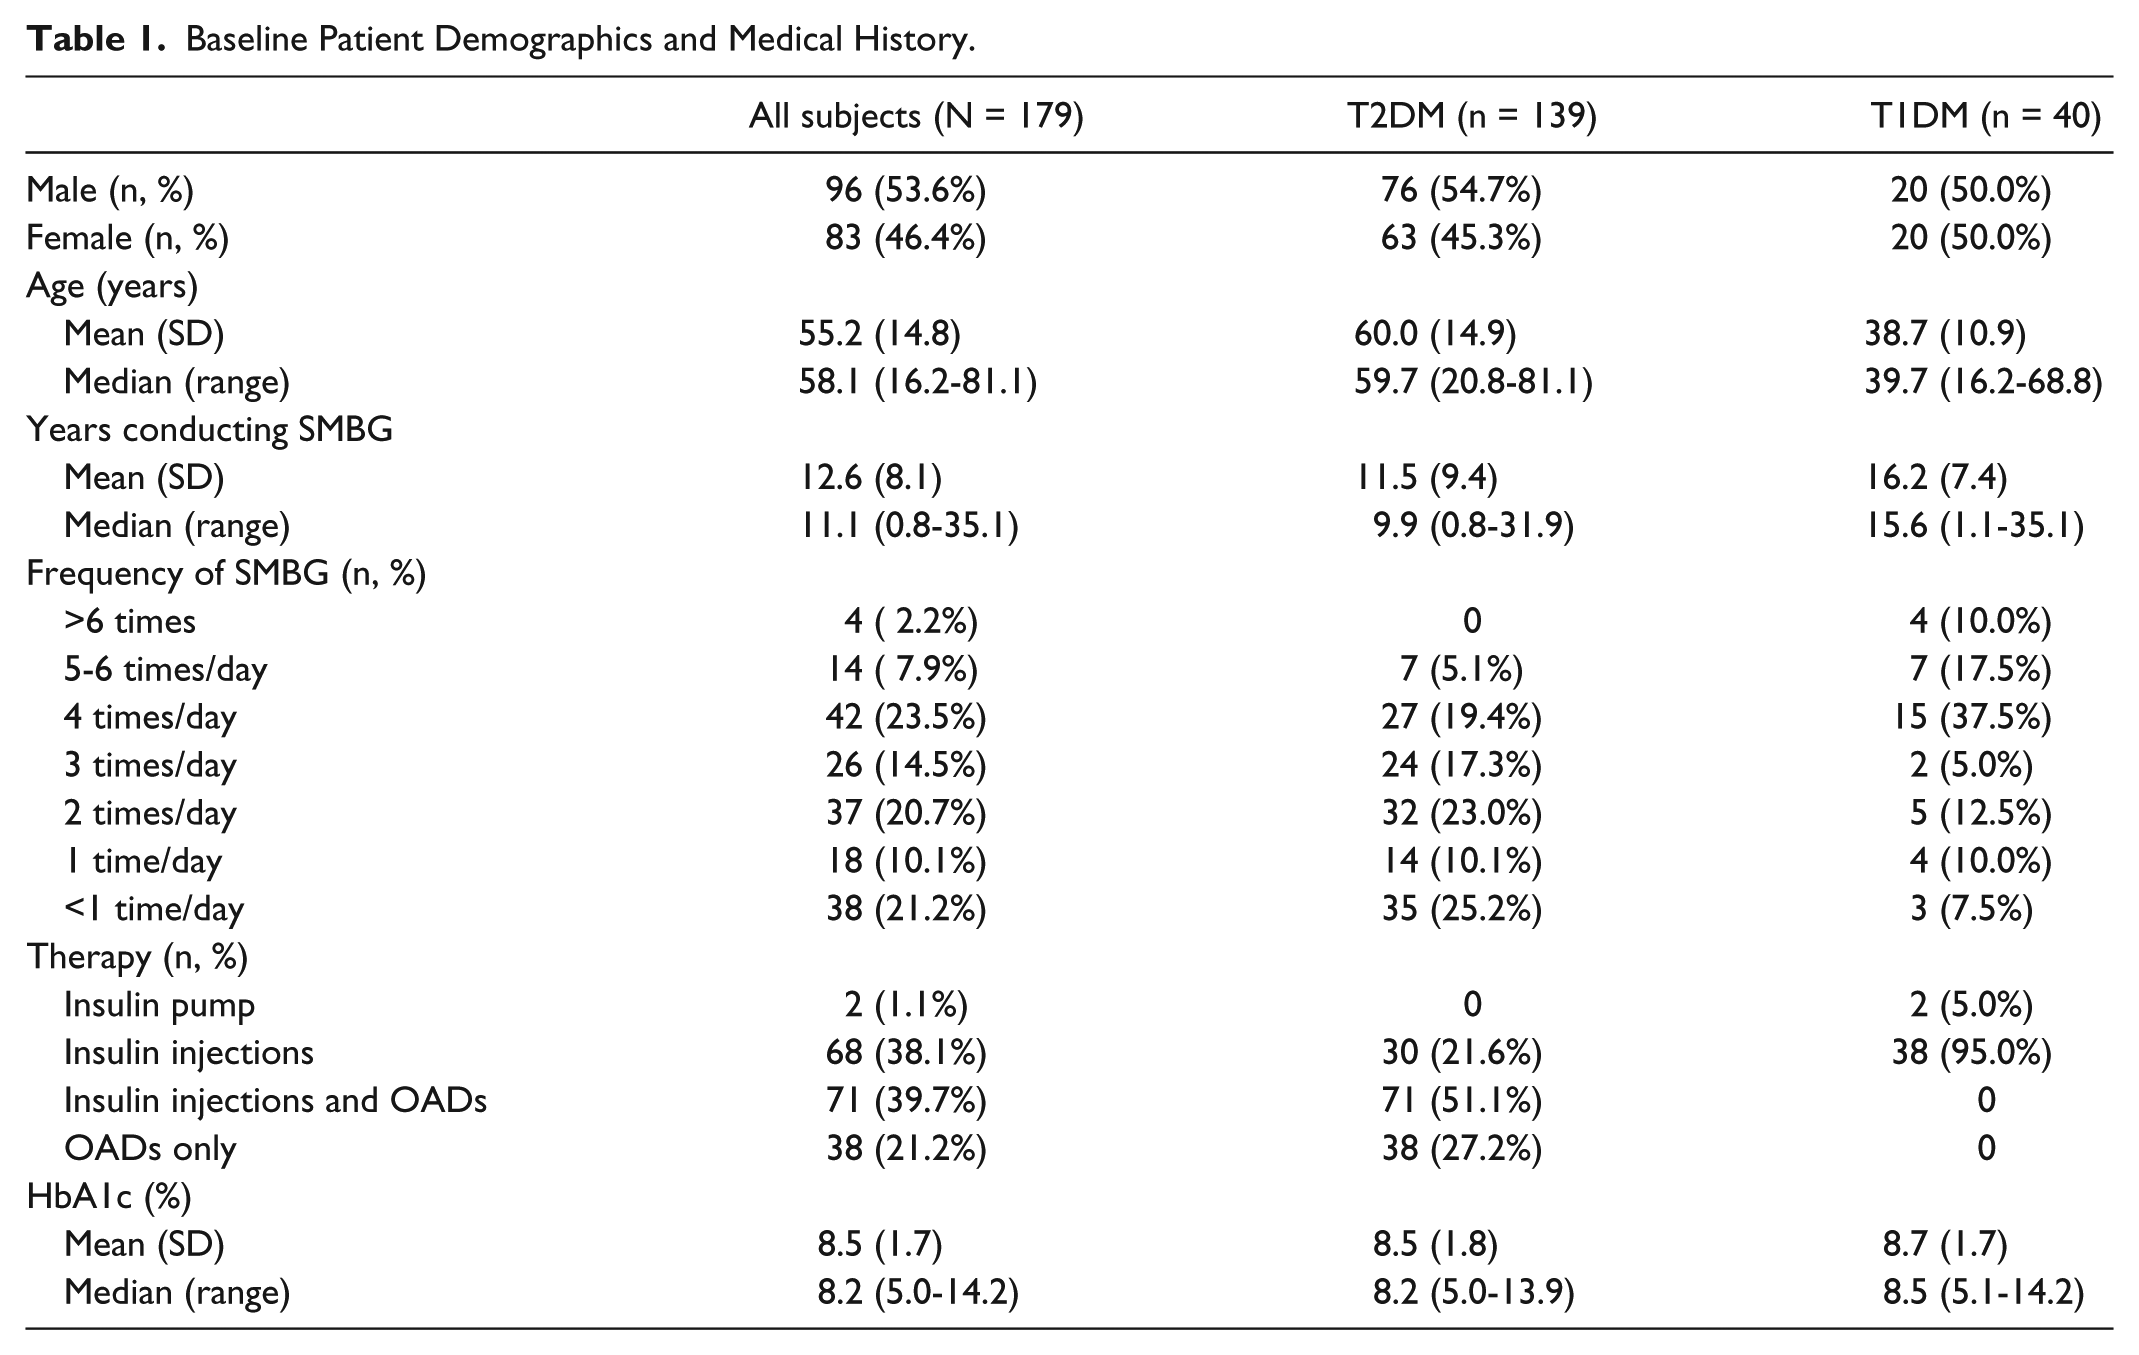
Baseline characteristics of the 139 T2DM and 40 T1DM subjects are shown in Table 1. There was no statistically significant difference in baseline characteristics across the 3 meter groups in the T2DM subjects (data not shown).
Baseline Patient Demographics and Medical History.
Glucose Readings Classification
On average, subjects correctly classified 37.3 of the 50 readings in Step 1 into their appropriate ranges (39.8 T1DM; 36.6 T2DM). After exposure to the CRI tool, the average correct number of responses increased to 46.1 of 50 (48.4 T1DM; 45.5 T2DM), representing a statistically significant improvement against baseline (P < .001) of 27.7% ± 2.2% (SEM) (27.2% ± 5.2% T1DM; 27.9% ± 2.5% T2DM). The individual subject improvement (or decline) in score is shown in Figure 2. Subjects took a mean of 2.2 min (1.7 min T1DM; 2.4 min T2DM) to classify all 50 general readings during step 1, and 1.9 min (1.5 min T1DM; 2.0 min T2DM) after CRI interaction. The difference in time spent during these steps was not statistically significant. The average time spent interacting with the CRI tool itself (during Step 2) was less than 6 min, with a range of 1 to 14 min.
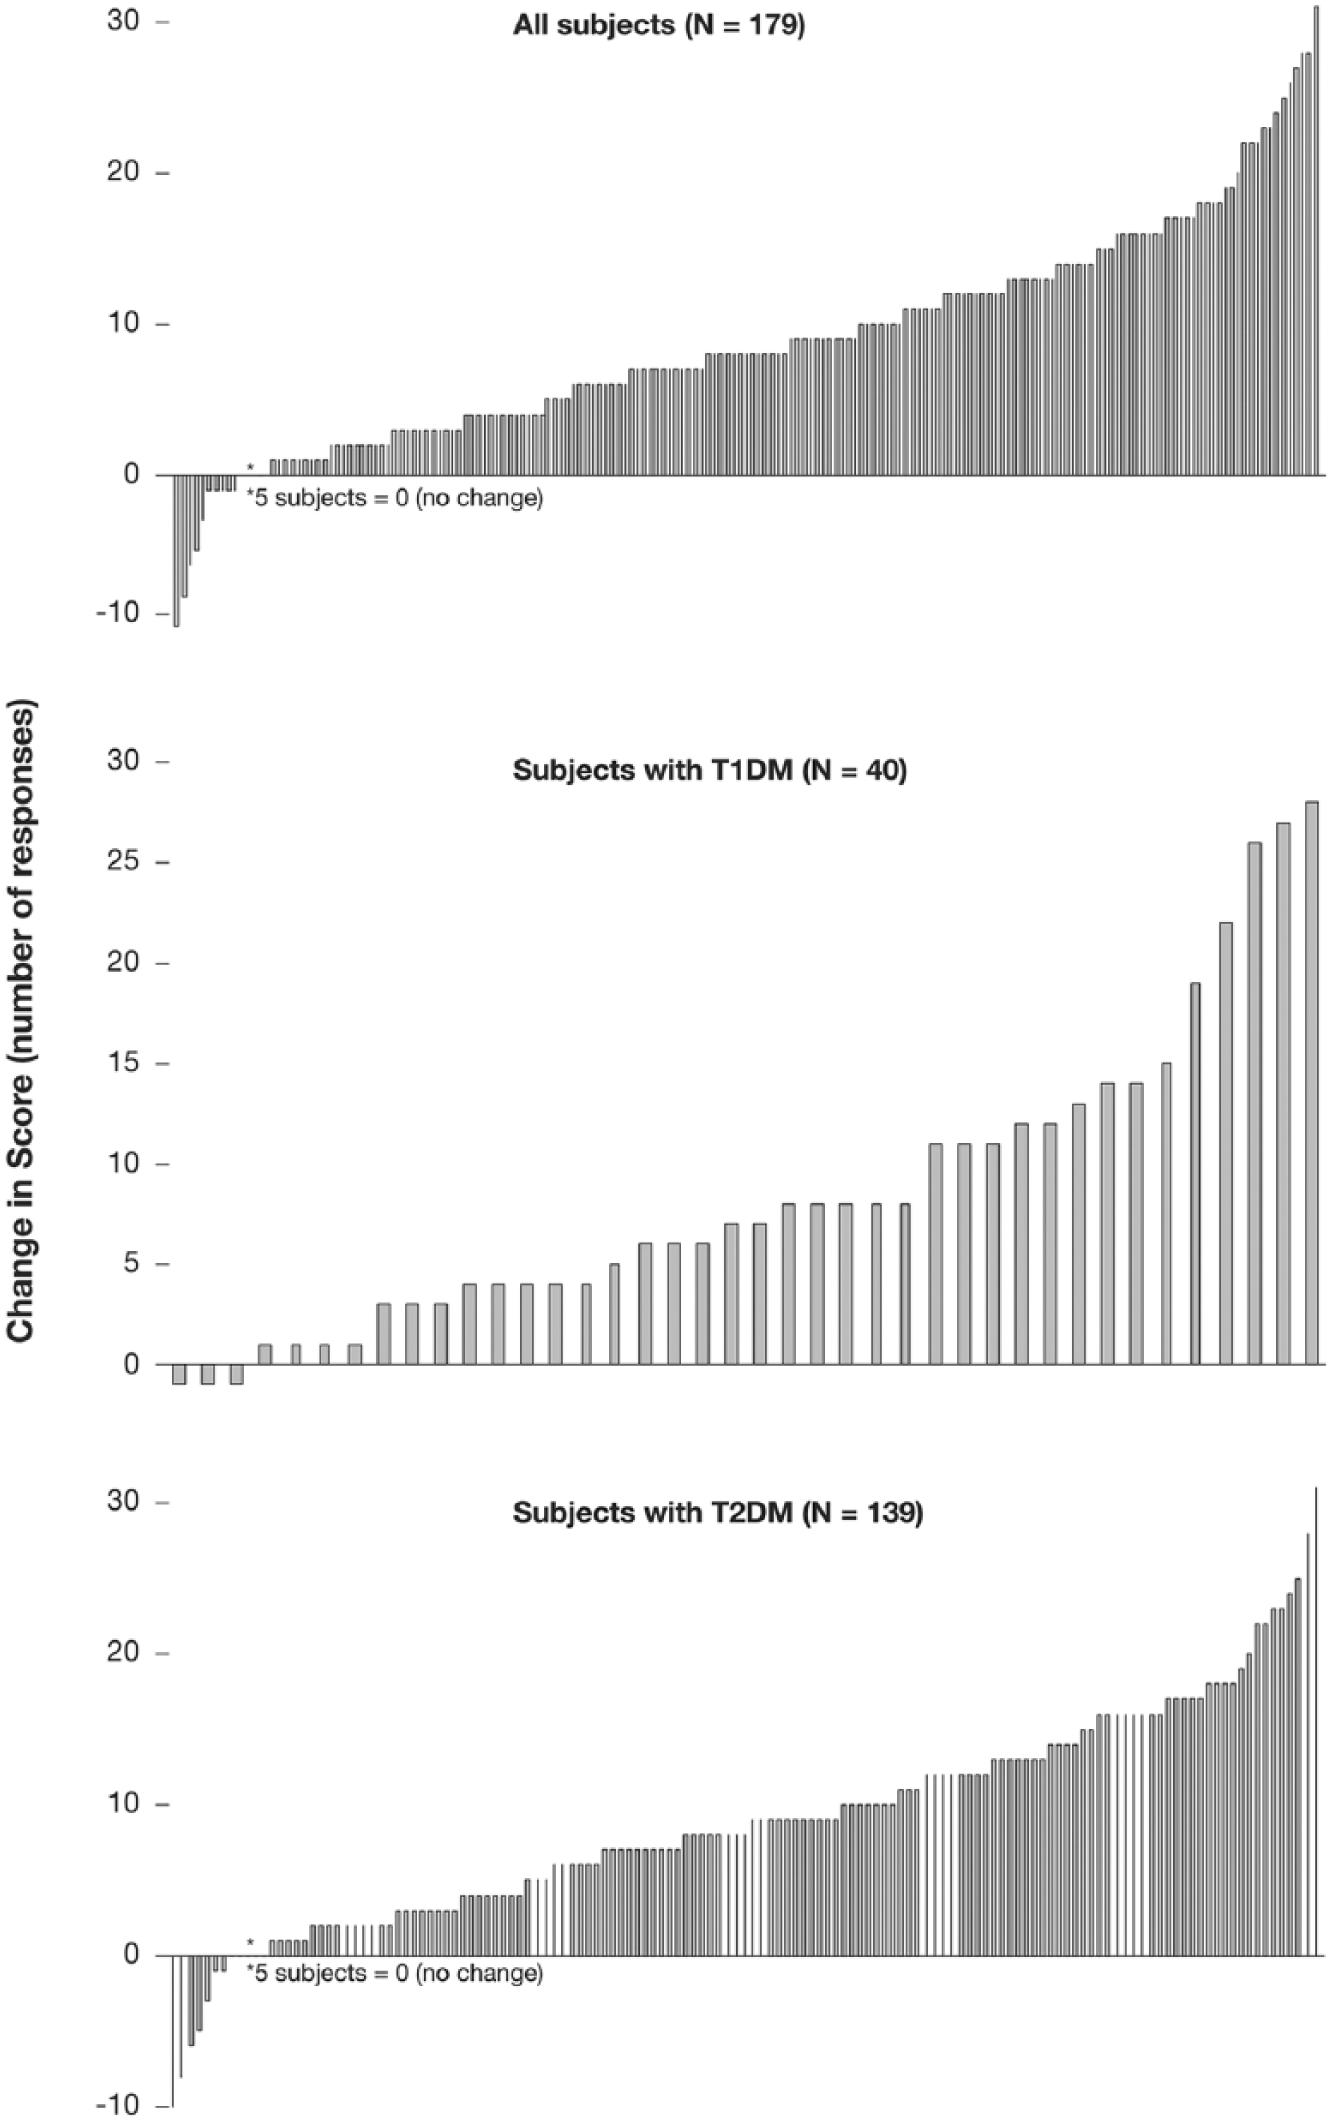
Change in glucose result classification scores. Each bar represents an individual subject.
Range Classification and Clinical Measures
Subject baseline A1c ranged between 5.0% to 14.2%. There was no correlation between A1c and the ability of subjects with T1 or T2DM to classify 50 glucose readings into appropriate glucose ranges. There was also no correlation between baseline SMBG frequency or duration of diabetes and the ability of subjects to correctly classify glucose readings.
SNS Evaluation
Median numeracy score was 30 (maximum score of 48) across all subjects with a range of 8 to 45 (9-43 T1DM; 8-45 T2DM) (Figure 3). There was no statistical difference between numeracy scores in subjects with T1 or T2DM. In addition, there was no correlation between numeracy score and the ability to classify BG results into acceptable ranges.
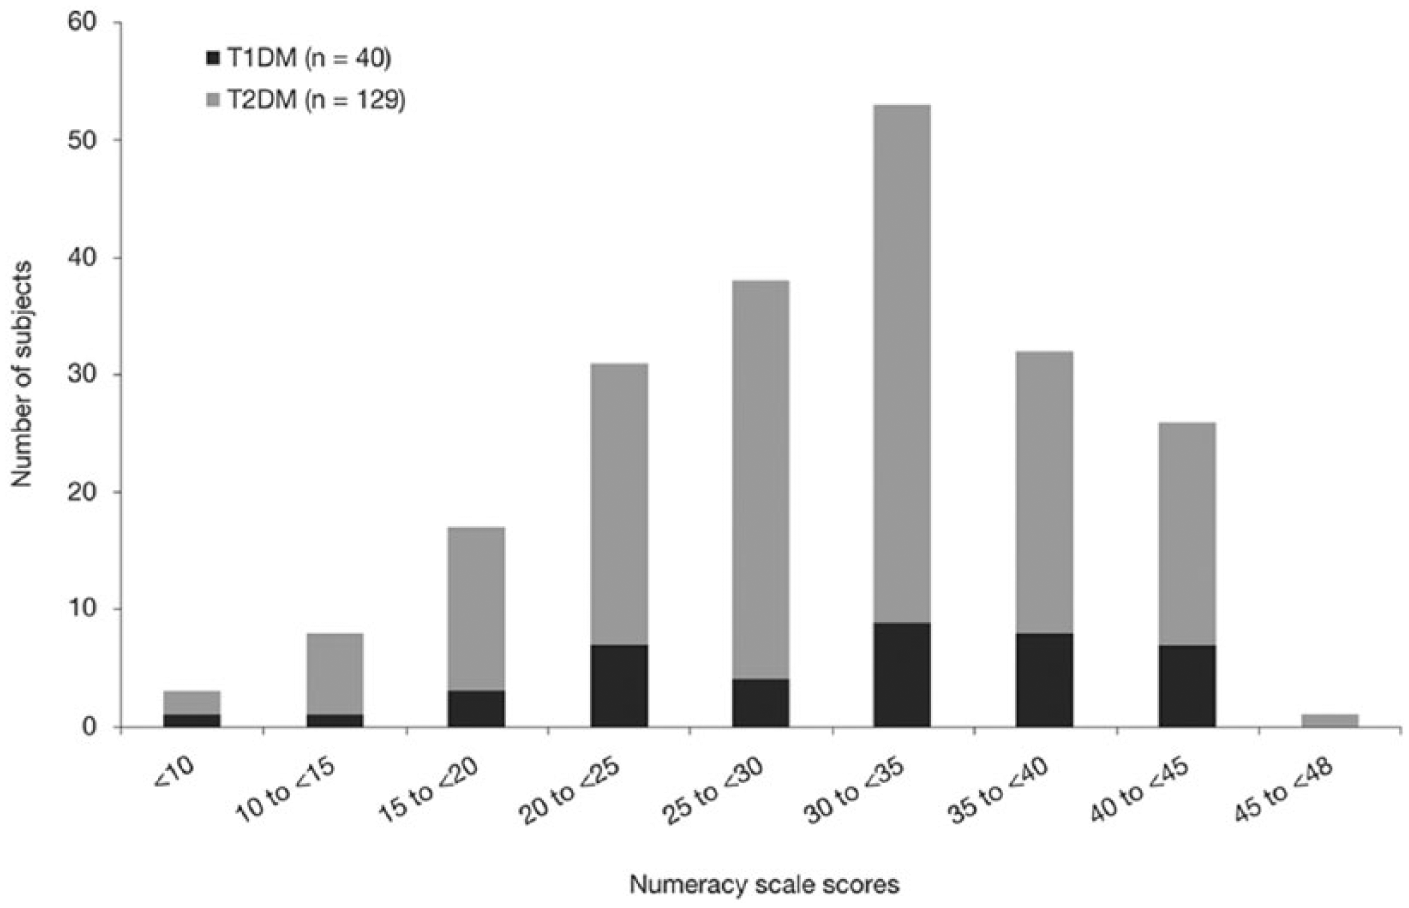
Subjective Numeracy Scale scores in T1DM (n = 40) and T2DM (n = 139) subjects. The 8-question scale has 6 items per question, with a maximum score of 48 representing highest subjective numeracy evaluation. Numbers represent the number of subjects scoring in the range shown.
Progress Notes Feature
After reviewing a paper logbook, only 42% of 169 subjects correctly identified that 7 of 10 weekly logbook results were in range (53% T1DM; 39% T2DM) despite being told the range. T1DM subjects were no better at correctly identifying in-range results using a paper logbook than T2DM subjects (P = .16). However, 94% of all subjects correctly confirmed that the OTV progress notes screen described that 7 of 10 weekly BG results were in range with no statistical difference between T1DM or T2DM subjects (Figure 4).
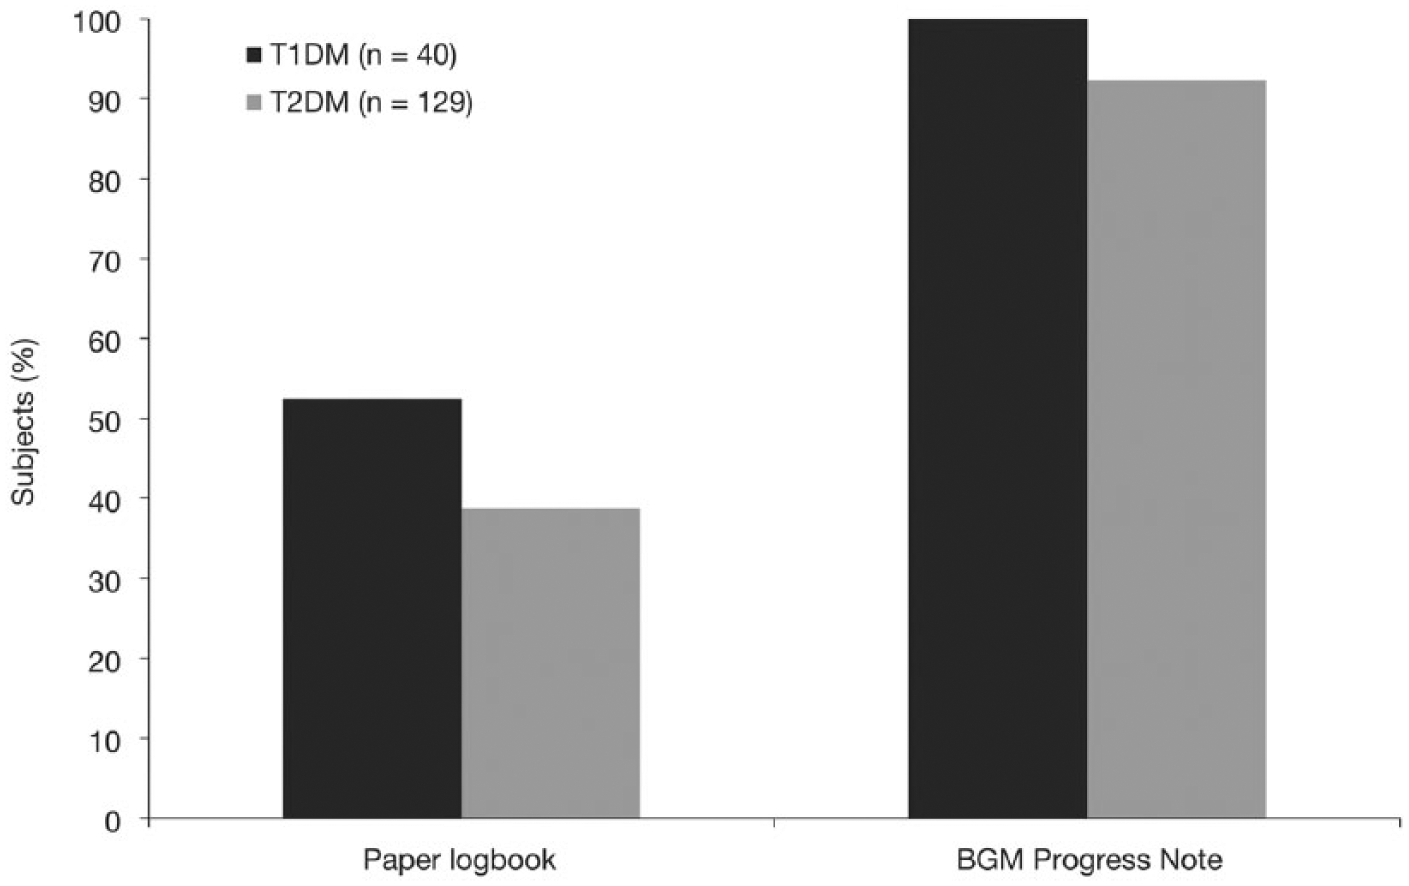
Success determining number of in-range results after reviewing a paper logbook or viewing a BGM progress note. Scores are percentage success rate correctly identifying that 7 of 10 BG results were in range (3.9-10.0 mmol/l).
Subject Surveys
Subject Awareness on Glucose Ranges
Of subjects, 76% (98% T1DM; 70% T2DM) confirmed they had previously discussed glucose ranges with their HCP. In all, 43% responded that their HCP mentioned glucose ranges at every scheduled visit (54% T1DM; 39% T2DM), and 25% said that their HCP mentioned it only sometimes (33% T1DM; 22% T2DM). Furthermore, 32% of subjects (55% T1DM; 26% T2DM) stated their HCP had previously given verbal and written glucose ranges, while 40% of all subjects reported that they only received verbal information.
Subjects Perceptions of High or Low Glucose Readings
When subjects were asked “Is there a low glucose value you would prefer to stay above during routine SMBG?,” 94% specified a low limit (95% T1DM; 94% T2DM). Of these subjects, 98% said they would prefer to be above 70 mg/dl with 45% preferring to always be above 90 mg/dl (26% T1DM; 50% T2DM). When asked, “Is there a high glucose value you would prefer to stay below during routine SMBG?,” only 37% said they would prefer to stay below 180 mg/dl (32% T1DM; 38% T2DM), with the remaining preferring to stay below higher target limits (68% T1DM; 62% T2DM). When subjects were asked, “Is there a low glucose reading at which you would take action (to raise blood glucose)?,” 99% responded they would act below 70 mg/dl. When subjects were asked the same question for high readings, 72% said they would only act above 180 mg/dl (98% T1DM; 65% T2DM), and 28% said they would not take action at any high glucose reading (2% T1DM; 35% T2DM).
Subject Perceptions of the CRI and Progress Notes Tool
Table 2 shows the responses of subjects to statements regarding OTSP, OTVF, OTV, and the progress notes feature of OTV. Of subjects in the OTSP group, 96% agreed the CRI made them more aware of their target ranges and could help them quickly (92%) and easily (90%) interpret their BG readings. Of subjects in the OTVF group, 98% agreed that the simple CRI helped them know where they stand and could help them quickly (95%) and easily (95%) understand their BG readings. Of subjects in the OTV group, 90% agreed that seeing a positive progress note would boost their confidence and help them feel reassured about the actions they had been taking to manage their diabetes.
Subject Responses to Survey Statements.
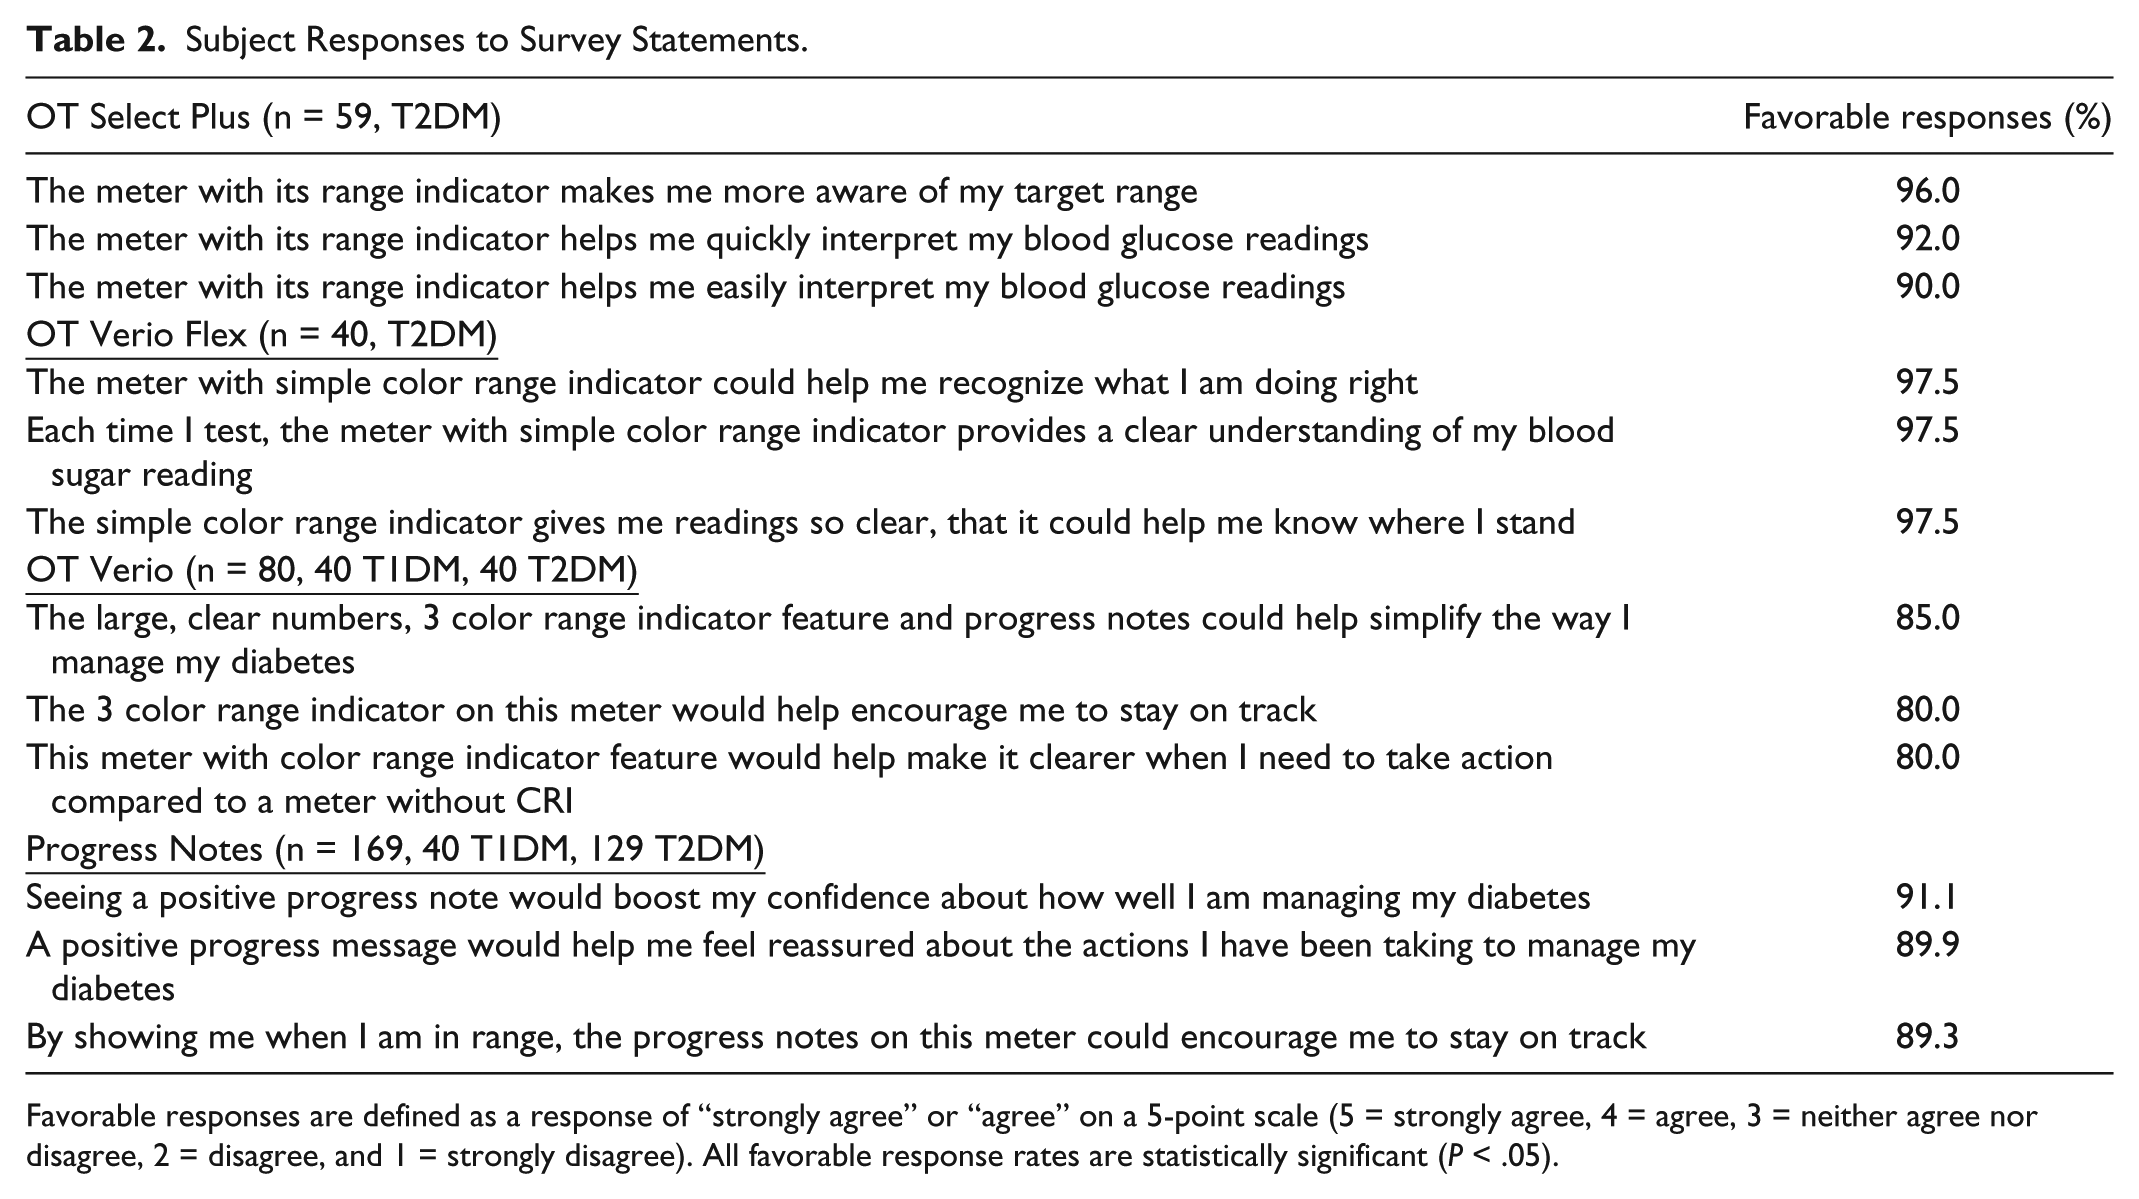
Favorable responses are defined as a response of “strongly agree” or “agree” on a 5-point scale (5 = strongly agree, 4 = agree, 3 = neither agree nor disagree, 2 = disagree, and 1 = strongly disagree). All favorable response rates are statistically significant (P < .05).
Discussion
Despite it being generally accepted that patients find health-related data such as BG monitoring results difficult to understand, 13 studies evaluating how well patients are able to comprehend information (including SMBG data) or how this information directly affects outcomes is not well reported. 14 The baseline data in our study reinforce the idea that some patients struggle with basic interpretation of glucose data. In addition, one cannot assume that patients who test their blood sugars more frequently, such as patients with T1DM or insulin-using patients with T2DM, are more capable of interpreting glucose results due to their supposed familiarity with glucose results. Consistent with this idea, although subjects in our study with T1DM had a slightly higher baseline ability to classify BG results into appropriate ranges compared with T2DM subjects, this difference was not significant.
Recent evidence has shed light on how patients with T1DM perceive information on glucose ranges and targets. Rankin et al 15 explored experiences of implementing BG targets in 30 patients in the UK with T1DM and found use of BG targets enabled patients to more easily identify problems. Therefore, a simple color range indicator, personalized to the appropriate BG target range by an HCP, may help T1DM patients recall BG targets and enable them to more confidently refine their range limits over time and improve glycemic control.
Our study demonstrated that providing automatic on-screen glucose range advice via a color range indicator significantly improved the ability of subjects to classify BG readings into low, in range, or high ranges. Improved ability to interpret and classify BG readings was consistent across 3 different glucose meters regardless of how each meter displayed the advice. Furthermore, these improvements were of equal magnitude in subjects with T2DM and T1DM.
Our subject survey noted that although nearly all subjects with T1DM discuss glucose ranges at their scheduled HCP visits, only 70% of subjects with T2DM did so even though many of them were insulin users. This tendency to a stronger focus on glycemic targets during encounters of people with T1DM with their HCP is understandable given the need to avoid hypoglycemia when dosing insulin. But it does seem an area of opportunity for people with T2DM to be provided with more consistent feedback from their HCP regarding glucose ranges. Again, the simplicity of displaying range targets on a meter using a color range indicator may be helpful. Interestingly, there is an apparent disconnect between perceptions of HCPs and people with T2DM with respect to diabetes management advice received in routine clinical practice. An observational study surveying 1,012 T2DM patients and 974 physicians found that almost half of physicians thought they assessed treatment adherence “very often,” while only 17% of patients agreed with this statement. 16 And while most physicians (63%) felt treatment adherence was “very important” to achieve optimal clinical outcomes, only 25% of the patients with T2DM considered this attribute of great importance to their physician. Therefore, the ability to customize patient BGMs with personalized glucose target ranges may facilitate patient adherence by providing repeated reminders of HCP-advised treatment goals between scheduled visits.
We also examined the perceptions of our study population to BG values, both in terms of ranges they would routinely prefer to be within and with respect to actions they would be inclined to take when results were low or high. Survey results highlighted similarities and differences between subjects with T1DM and T2DM. Nearly all subjects in our study preferred their BG results to be above 70 mg/dl and would take some form of action below this threshold. However, it was interesting to note that subjects with T2DM had a more variable response to acceptable low glucose targets, with 50% of them preferring to stay above 90 mg/dl most of the time, double the percentage stated by T1DM subjects. Similar percentages of T1 and T2DM subjects preferred to keep their high results below 180 mg/dl, but in contrast to T1DM subjects where nearly all would take some form of action above 180 mg/dl, only 24% of subjects with T2DM considered action when above 250 mg/dl and 35% stated they would take no action of any kind for any high glucose. This apparent tolerance of high results by subjects with T2DM may reflect a genuine lack of range awareness. The CRI feature may help identify high results and prompt patients to reflect on the advice of their HCPs in regard to responding to high glucose readings.
Recently, Zikmund-Fisher et al 17 reported that numeracy and literacy independently predict the ability of patients to identify out-of-range test results. In addition, poor numeracy skills have been associated with worse glycemic control in patients with T1DM. 10 In our study, we observed that both low and high numeracy subjects improved their ability to classify BG results after exposure to CRI, further demonstrating the potential benefit of CRI.
Utilizing written logbooks for recording BG data is problematic due to a high incidence of errors, information gaps, and the complexity and volume of information presented. 18 Approximately half of adult SMBG logbooks are considered inaccurate and unreliable. 19 Given that many patients become overwhelmed and unable to interpret or act upon logbook data, we investigated whether a meter-based progress notes tool, automatically displaying the number of in-range results over the last 7 days, would help patients interpret in-range results. Our data demonstrated that this tool improved the ability of subjects with both T1DM and T2DM to correctly identify how many results were in range. Perhaps not surprisingly, our data suggest that subjects with T1DM who perform SMBG more frequently are more successful in determining results in range from a paper logbook than their T2DM counterparts. Progress notes are designed to be a positive message to motivate patients to continue positive behaviors and reflect on recent actions and therapy adjustments. Our survey showed that over 90% of subjects agreed progress notes would boost their confidence and help them feel reassured about the actions they are taking to manage their diabetes.
Summary and Conclusions
Many people with T2DM struggle to interpret BG data with respect to accepted glycemic target ranges. The current study strengthens this view and suggests that patients with T1DM have similar issues and may derive similar benefit from exposure to a CRI tool. Using meters that simplify the comprehension and interpretation of glucose data may support patients making more informed decisions and help them to follow HCP recommendations on glycemic targets.
Footnotes
Acknowledgements
The authors would like to thank Barry Irvine, Nichola Purvis, Krisna Koria, and Lorna Stewart for support of the study conduct. The authors received editorial assistance from Excerpta, which was funded by LifeScan, Inc.
Abbreviations
A1c, hemoglobin A1c; BG, blood glucose; BGM, blood glucose meter; CRI, color range indicator; HCP, health care professional; NHS, National Health Service; OAD, oral antidiabetes drug; OTSP, OneTouch Select Plus; OTV, OneTouch Verio; OTVF, OneTouch VerioFlex; SD, standard deviation; SEM, standard error of the mean; SMBG, self-monitoring of blood glucose; SNS, Subjective Numeracy Scale.
Declaration of Conflicting Interests
The author(s) declared the following potential conflicts of interest with respect to the research, authorship, and/or publication of this article: MG and HC are employees of LifeScan Scotland, Ltd. LBK and BLL are employees of LifeScan, Inc.
Funding
The author(s) disclosed receipt of the following financial support for the research, authorship, and/or publication of this article: This study was funded by LifeScan, Inc.