
Abstract
The relationship between International Organization for Standardization (ISO) accuracy criteria and mean absolute relative difference (MARD), 2 methods for assessing the accuracy of blood glucose meters, is complex. While lower MARD values are generally better than higher MARD values, it is not possible to define a particular MARD value that ensures a blood glucose meter will satisfy the ISO accuracy criteria. The MARD value that ensures passing the ISO accuracy test can be described only as a probabilistic range. In this work, a Bayesian model is presented to represent the relationship between ISO accuracy criteria and MARD. Under the assumptions made in this work, there is nearly a 100% chance of satisfying ISO 15197:2013 accuracy requirements if the MARD value is between 3.25% and 5.25%.
There are multiple ways to assess the accuracy of a blood glucose meter for use in self-monitoring of blood glucose. 1 Perhaps one of the most familiar methods is by using accuracy criteria from the International Organization for Standardization (ISO), as the ISO standards have been used by regulatory agencies to determine whether a blood glucose meter is sufficiently accurate to be marketed commercially for use by people with diabetes. The 2003 ISO accuracy criteria were replaced in 2013 by the more rigorous ISO 15197:2013 accuracy criteria, which require that ≥95% of meter results fall within ±15 mg/dL or ±15% of the laboratory reference result at blood glucose concentrations of <100 mg/dL and ≥100 mg/dL, respectively. 2
Mean absolute relative difference (MARD) has traditionally been used to assess the accuracy of continuous glucose monitoring systems 3 ; however, in recent years, it has been used in studies comparing the accuracy of multiple blood glucose meters.4-14 With MARD, it is possible to represent the accuracy of a blood glucose meter as a single numeric value. While lower MARD values are generally better than higher MARD values, there is no definition for how low is low enough or how high is too high.
It is possible to define whether a blood glucose meter satisfies ISO accuracy criteria; however, the relationship between ISO accuracy criteria and MARD is complex. One cannot deterministically define a particular MARD value that is sufficient enough to satisfy the ISO accuracy test. A Bayesian model is presented here to express the relationship between ISO accuracy criteria and MARD.
Theoretical Development
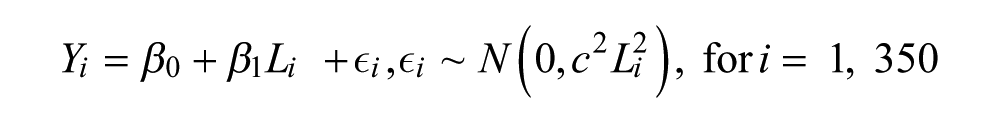
Blood glucose meter measurements may be represented as a linear function of the corresponding measurement made by a laboratory instrument. 15 Let Y represent a meter blood glucose (BG) measurement and let L represent a laboratory BG measurement. Then, Yi is the meter measurement on sample i and Li is the laboratory measurement on sample i. The model for Y is the following:

That is, Y is a linear function of L with noise that is normally distributed with zero mean and variance proportional to the square of the laboratory measurement. The constant, c, is the coefficient of variation (CV). This model assumes a constant CV for meter measurements, as well as linearity. It is assumed that L has no stochastic part.
Absolute Relative Difference and MARD
Absolute relative difference (ARD) between a single meter measurement and its corresponding laboratory measurement is a way to quantify the error in the meter result. The MARD of a sample of blood glucose measurement pairs, such as those taken in a clinical trial, is a measure of overall meter accuracy. Since yi ~ N(μi = β0 + β1Li, σi = cLi), then
Total Probability
The probability that a single measurement taken by a meter will fall within particular limits of a corresponding laboratory instrument can be expressed mathematically. Assume that Li has a gamma distribution with parametersα = 5 and γ = 30 (see Figure 1).
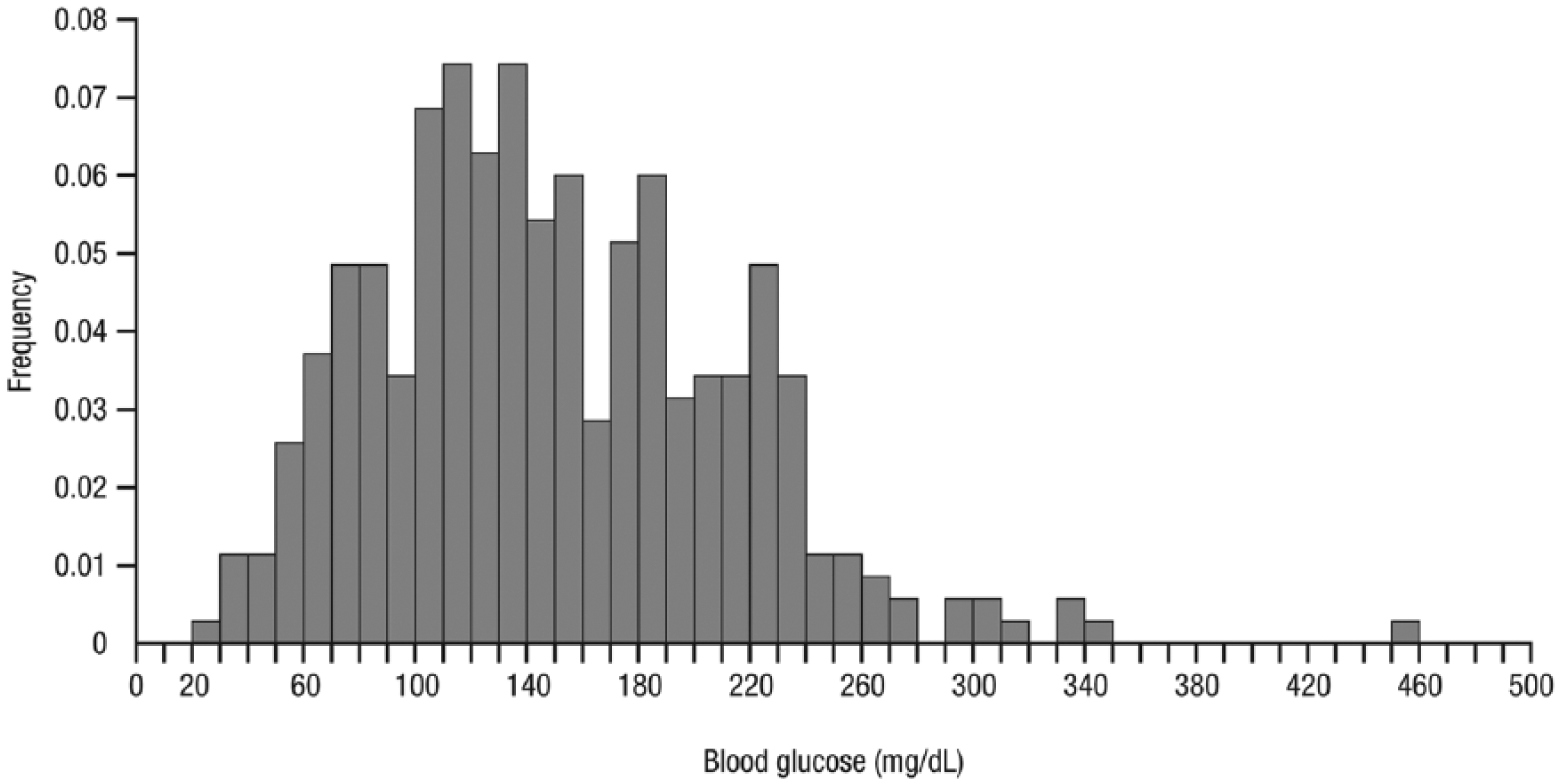
Gamma(5,30) distribution, n = 350. Gamma distribution, with parameters α = 5 and γ = 30, of n = 350 laboratory blood glucose values.
The formula for total probability of satisfying the ISO 15197:2013 accuracy criteria illustrates the complexity of the calculation:
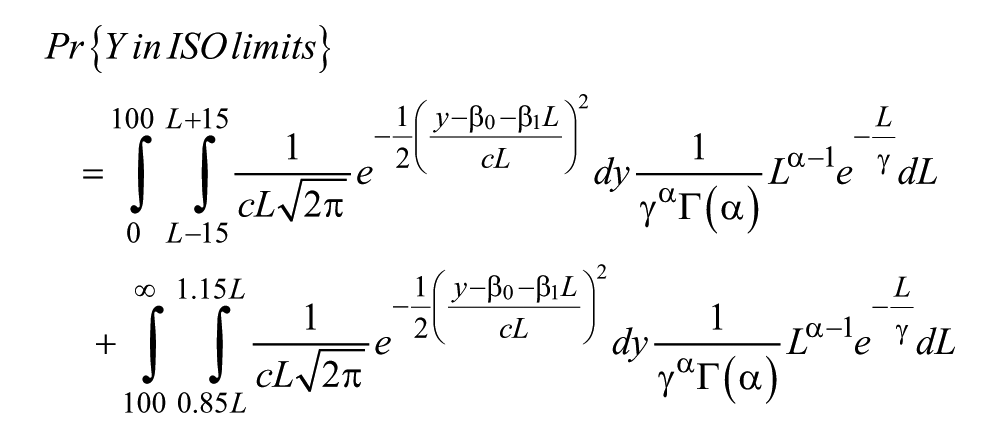
Even if the parameters β0, β1, and c were fixed to specific values, the probability integral could only be approximated numerically. One method for numerical approximation is via Monte Carlo simulation. 17
Simulation
The Experimental Array
A simulation was executed for 840 different value combinations of parameters β0, β1, and c. The parameter values had the following ranges:
β0: –7, +7 (increment 1; 15 values)
β1: 0.94, 1.06 (increment 0.02; 7 values)
c : 0.01, 0.08 (increment 0.01; 8 values)
n = 350 laboratory blood glucose values were generated from the gamma(5,30) distribution (Figure 1).
The model for generating n = 350 meter results, corresponding to each of the 350 laboratory results, for each of the 15 × 7 × 8 = 840 parametric conditions, was the following:
For each of the 840 conditions, the number and percentage (out of n = 350) of results satisfying ISO were computed.
The simulations provide numerical estimates of the double integral that represents Pr{Y in limits}. Each of the simulations was composed of sampling 350 blood glucose pairs (meter, laboratory), repeated 200 times.
MARD is not sufficient to compute the probability of errors falling within any pair of limits. However, for each of the 840 cases, over all 350 simulated laboratory values, we can compute MARD and the percentage of errors falling within any given limits.
Figure 2 shows the percentage of the 200 × 350 = 70,000 blood glucose pairs falling within the ISO limits, plotted against the corresponding MARD value (also computed over 200 × 350 = 70,000 blood glucose pairs for each of the 840 simulations). The horizontal line is drawn at 95%. The vertical line is drawn at the largest MARD value for which all of the percentages within the ISO limits were ≥95%.
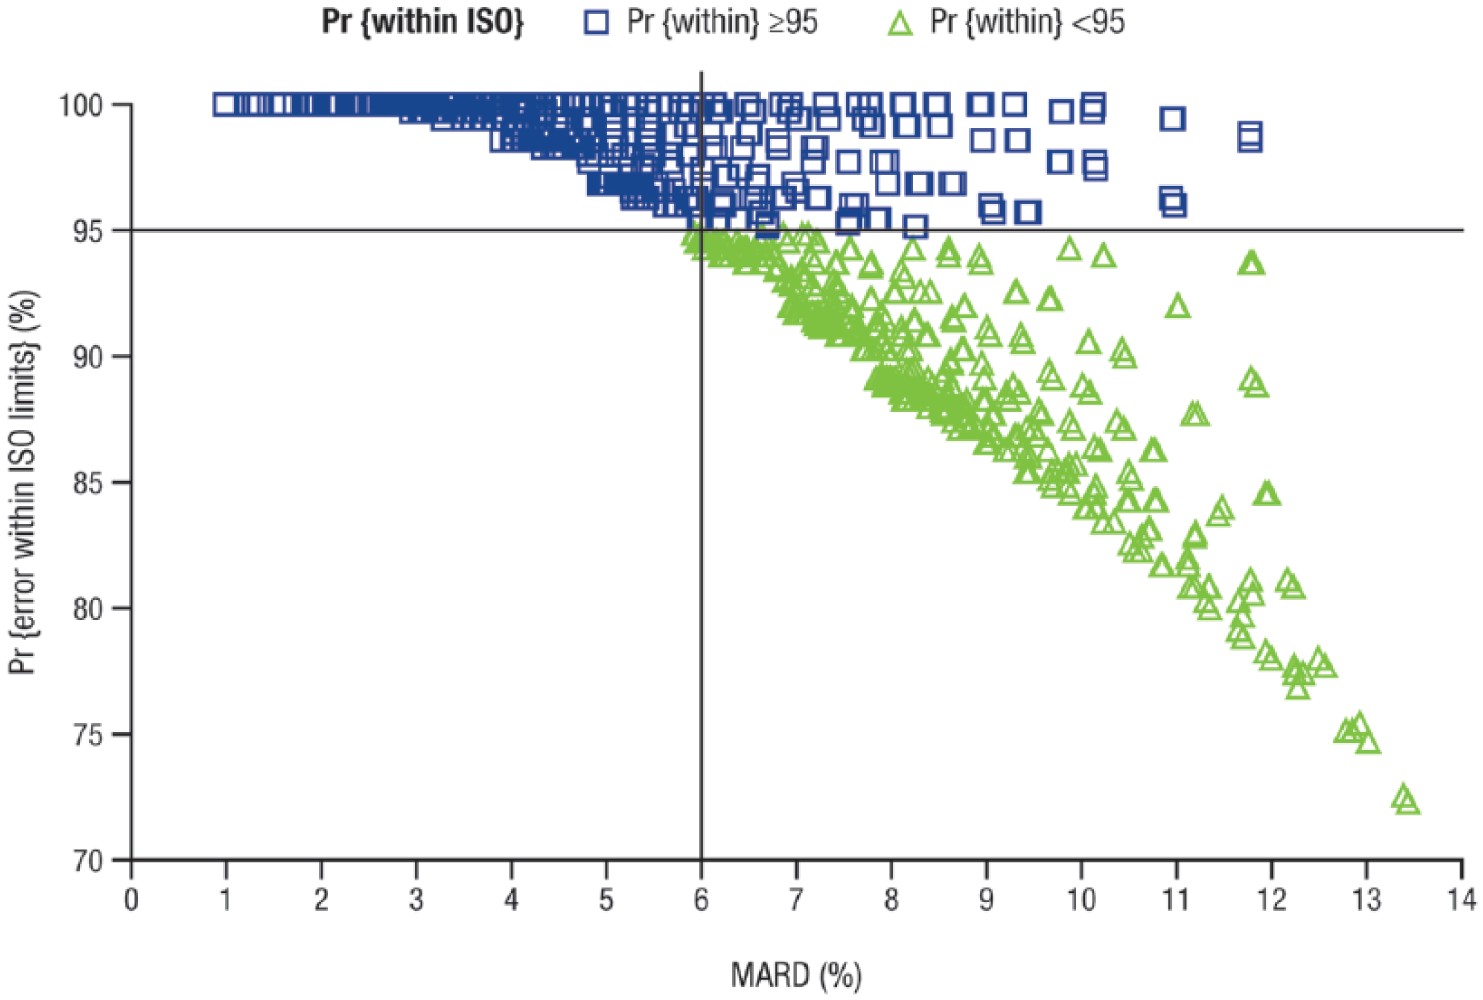
Pr{single measurement within ISO}. Probability of a single measurement falling within ISO 15197:2013 accuracy limits. 2 The percentage of simulated blood glucose pairs falling within the ISO limits (y-axis) is plotted against the corresponding MARD value (x-axis). The horizontal line is drawn at 95%. The vertical line is drawn at the largest MARD value for which all of the percentages within the ISO limits were ≥95%. ISO, International Organization for Standardization; MARD, mean absolute relative difference.
One of the most interesting aspects of the graph is the number of cases in which Pr{single measurement within ISO} was ≥0.95 and MARD exceeds the value where the vertical line is drawn.
The limiting value of MARD was 6.0%.
Probability of Satisfying the ISO Criterion for a Given MARD Value
Perhaps of greater interest than the relationship between MARD and a single measurement falling within ISO accuracy limits is the probability that a meter used in a clinical trial would satisfy the ISO accuracy criterion. Namely, if the MARD of a meter were known, what is the probability that the meter in question would pass the ISO 15197:2013 section 8 accuracy test? Under the assumptions used to create the plot in Figure 2, it is possible to construct a probability curve for a meter system to satisfy the ISO accuracy requirement as a function of MARD. Let:
A = {(β0, β1, c) s.t. at least 95% of simulated results satisfied ISO accuracy definition}
Pr{A} ≈ Pr{a randomly selected meter system will satisfy the ISO accuracy requirement}
B = {(β0, β1, c) s.t. MARD ≤ m} for m є (0%, 13.5%)
Then
Pr{A & B|m} = Pr{B|A,m}Pr{A}
and
Pr{A|B,m} = Pr{A & B|m} / Pr{B|m}
Figure 3 shows the Pr{B|m} curve, as generated using the simulation results.
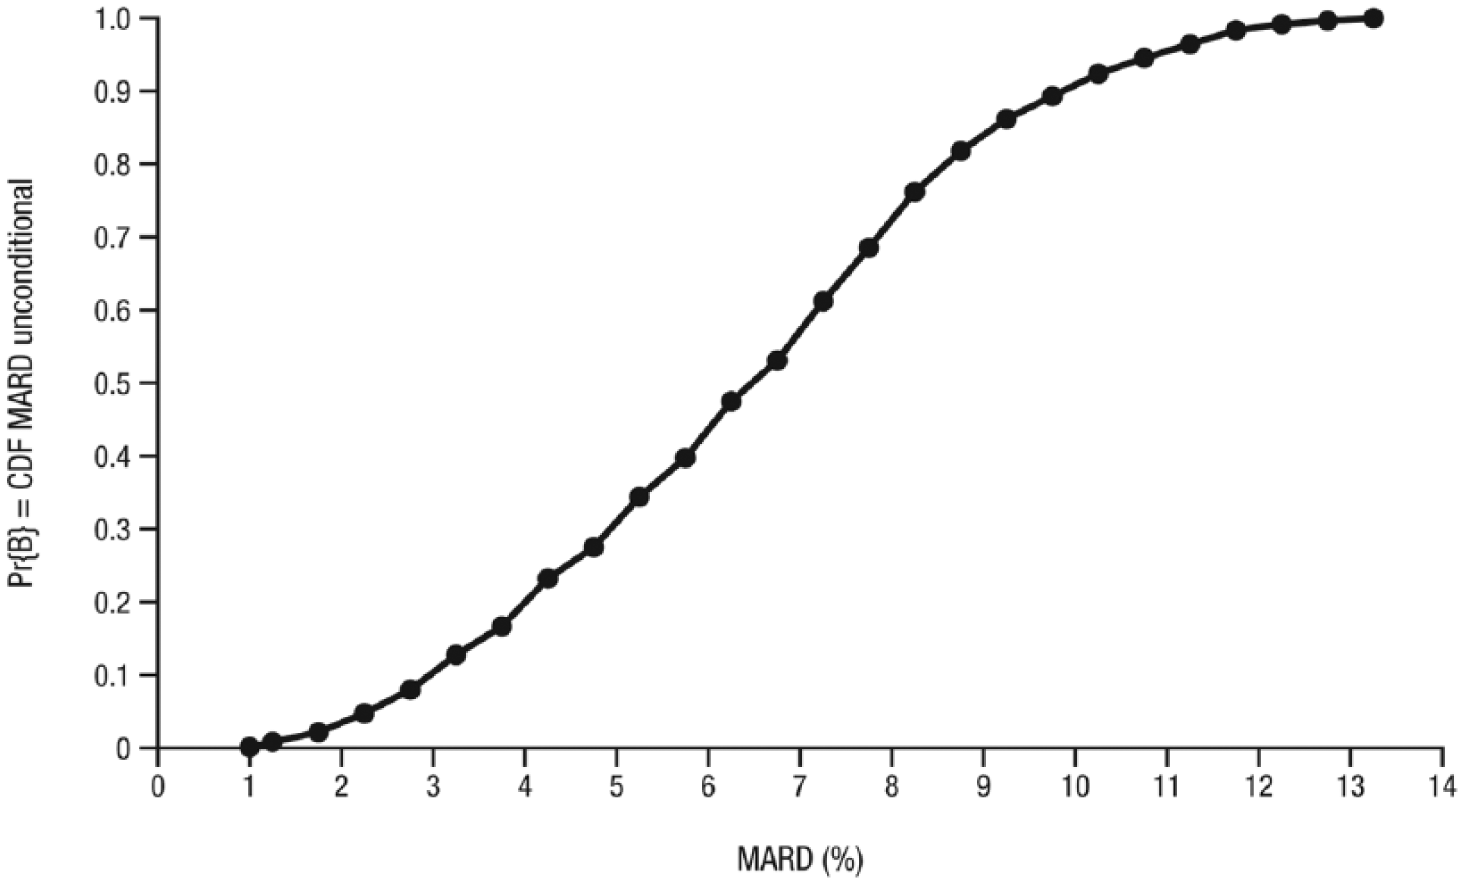
Pr{B|m} = CDF for MARD. Unconditional probability distribution of MARD over all of the 840 simulated meter system characterizations. CDF, cumulative distribution function; MARD, mean absolute relative difference.
Inasmuch as Pr{A} can be thought of as a prior probability for passing the ISO accuracy test and Pr{B|A,m} can be thought of as a likelihood function for MARD for meters passing the ISO test, then the curve Pr{A|B,m} would be a Bayesian posterior for the probability of passing ISO, given that MARD is below a threshold value m. Thus, curves can be generated that represent Bayesian credible bounds. 18
Figure 4 shows Pr{A|B,m} curves, or probability curves for satisfying the ISO accuracy requirement, given that a meter system has MARD = m, m є (0%, 13.5%). The curve labeled pmid is the median curve, plow is the 2.5% lower bound curve, and phigh is the 97.5% upper bound curve. The range of curves between plow and phigh would constitute 95% Bayesian credible bounds for Pr{A|B,m}. One could interpret the curves as most stringent (plow), most likely (pmid), and most liberal (phigh) curves for the relationship between the probability of passing the ISO test and a meter’s MARD value.
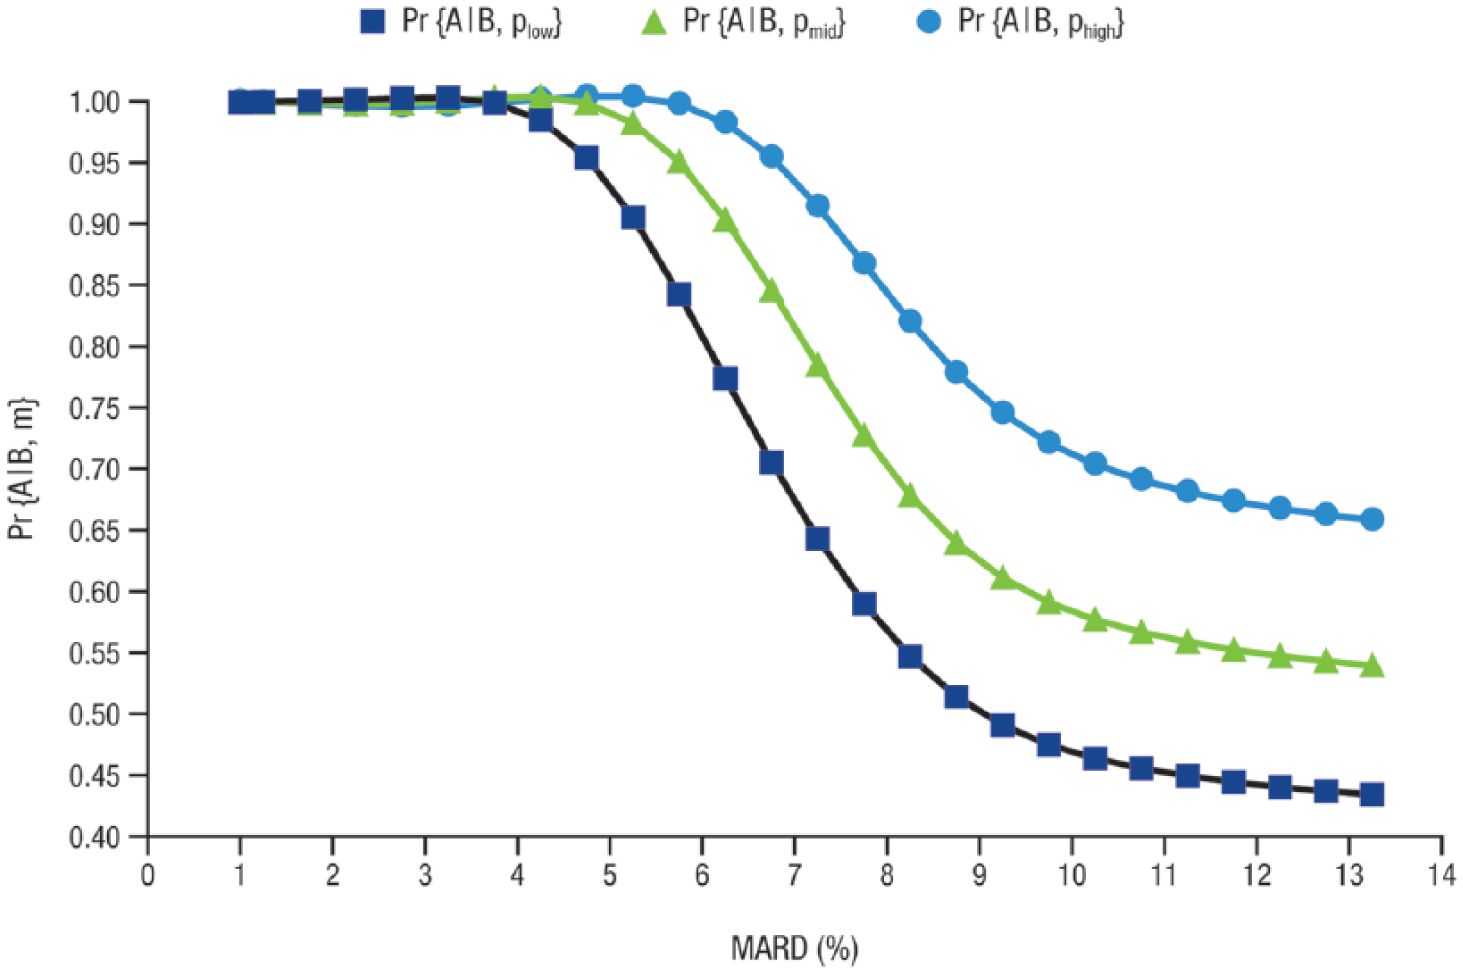
Pr{A|B,m} = Pr{satisfying ISO accuracy given MARD = m}. Probability curves for satisfying the ISO accuracy criterion (ie, having ≥95% of meter results fall within ±15 mg/dL or ±15% of the laboratory reference result at blood glucose concentrations of <100 mg/dL and ≥100 mg/dL, respectively), given the MARD value of the meter system. The curve labeled pmid is the median curve, plow is the 2.5% lower bound curve, and phigh is the 97.5% upper bound curve. The range of curves between plow and phigh constitute 95% Bayesian credible bounds for Pr{A|B,m}. ISO, International Organization for Standardization; MARD, mean absolute relative difference.
For example, to be practically certain of passing the ISO test, the MARD of a meter should be no greater than 3.25% (most stringent), 4.25% (most likely), or 5.25% (most liberal).
It is important to recognize the assumptions under which these curves were constructed:
1) Y = meter BG = β0 + β1*laboratory BG + noise
2) Noise ~ N(mean = 0, standard deviation = c*laboratory BG). In other words, the standard deviation of noise is proportional to the laboratory value (c = coefficient of variation, or CV, expressed as a decimal fraction)
3) Intercepts run between −7.0 and +7.0 (distributed uniformly across all meter systems in the world)
4) Slopes run from 0.94 to 1.06
5) CVs run from 1% to 8%
6) Distributions of intercepts, slopes, and CVs are assumed to be independent of each other
7) Laboratory BG values used in an ISO 15197:2013 section 8–type study are gamma distributed, with α = 5 and γ = 30
Summary
While ISO accuracy criteria provide specific guidelines for the acceptable accuracy of a blood glucose meter, there is no consensus threshold for what constitutes a “good” versus a “bad” MARD value. It is not possible to deterministically define a maximum allowable MARD value that ensures a blood glucose meter will satisfy ISO accuracy criteria. However, it is possible to define a range for MARD such that if the MARD value falls within this range, there is a reasonable certainty that the meter will also satisfy the ISO accuracy criteria.
The relationship between the probability of meter error falling within ISO limits and the meter’s MARD value is complex. Knowing that MARD is below a threshold may be a sufficient, but not necessary, condition for determining that the probability of the meter results falling within ISO limits is greater than some particular value (eg, 95%). The actual value of MARD that ensures passing the ISO accuracy test can only be described probabilistically. Under the assumptions made in this work, there is nearly a 100% chance of satisfying ISO 15197:2013 accuracy requirements if the MARD value is between 3.25% and 5.25%.
While MARD may be useful for comparing the accuracy of multiple meters in a single study, it is not sufficient in itself to characterize meter performance. In general, lower MARD values indicate higher accuracy; however, it is not possible to define a threshold MARD value below which the meter is considered to be sufficiently accurate. Thus, the performance of blood glucose meters should not be judged based solely on their MARD value. It is important to consider multiple measures of accuracy to obtain a more complete assessment of a blood glucose meter’s performance.
Footnotes
Acknowledgements
Editorial assistance was provided by Allison Michaelis, PhD, of MedErgy, Yardley, PA, and was funded by Ascensia Diabetes Care and Ascensia’s predecessor-in-interest, Bayer HealthCare.
Abbreviations
ARD, absolute relative difference; BG, blood glucose; CDF, cumulative distribution function; CV, coefficient of variation; ISO, International Organization for Standardization; MARD, mean absolute relative difference.
Declaration of Conflicting Interests
The author(s) declared the following potential conflicts of interest with respect to the research, authorship, and/or publication of this article: SP and DAS are full-time employees of Ascensia Diabetes Care.
Funding
The author(s) disclosed receipt of the following financial support for the research, authorship, and/or publication of this article: This work was supported by Bayer HealthCare, the predecessor-in-interest of Ascensia Diabetes Care, Parsippany, NJ.