
Abstract
Glucose meters often have similar performance when compared by error grid analysis. This is one reason that other statistics such as mean absolute relative deviation (MARD) are used to further differentiate performance. The problem with MARD is that too much information is lost. But additional information is available within the A zone of an error grid by using the Taguchi loss function. Applying the Taguchi loss function gives each glucose meter difference from reference a value ranging from 0 (no error) to 1 (error reaches the A zone limit). Values are averaged over all data which provides an indication of risk of an incorrect medical decision. This allows one to differentiate glucose meter performance for the common case where meters have a high percentage of values in the A zone and no values beyond the B zone. Examples are provided using simulated data.
The glucose meter error grid has been a mainstay in the performance evaluation of glucose meters.1-3 Error grids are based on clinician opinion of potential outcomes, account for 100% of the data, and distinguish between no harm and various amounts of potential harm to patients based on the difference between a candidate glucose meter and reference. Error grid results are expressed graphically and as a tabulation of the percentage of results in each zone. However, for many glucose meter evaluations, most of the results are in the A zone and often there are no results beyond the B zone. In an example comparing 5 glucose meters, the range of results in the A zone was 79% to 100% with no results beyond the B zone. 4
Perhaps because of similar performance based on error grid analysis, other metrics are used including MARD (mean absolute relative difference). The advantage of MARD is that it expresses performance in 1 summary number and there is often separation in meter performance for meters that appear similar by error grid analysis. But MARD has been criticized 5 as it throws away the information about bias direction and it combines the effects of bias, precision, and outliers into 1 number. Moreover, there is no standard for an acceptable MARD.
The Taguchi Loss Function
One could argue that glucose meters with similar error grid performance do not require further differentiation since if all results are in the A zone, then no harm will be observed, regardless of the location of results so long as they are in the A zone. But one can view this as a manufacturer consumer dilemma. That is, manufacturers test the quality of a product during production by observing some metric with the result that the product either has full value (metric within limits) or zero value (metric outside of limits). The dilemma is that 2 nearby results with one just below and the other just above the limit should have similar value, not full and zero value. The consumer views the product’s value as maximum when the quality metric is exactly between limits and its value decreases as the quality metric approaches its limit. This concept has been expressed as the Taguchi loss function.6-8
Applied to a glucose meter, a clinician must make a dichotomous decision—to treat or not treat the patient based in part of the glucose meter result. Glucose meter errors are considered not to cause harm to the patient if they are within the A zone or will cause harm the patient if they are outside of the A zone. But the likelihood of an incorrect treatment decision based on glucose meter error increases from zero glucose meter error to the error observed at the limit of the A zone. An example of this concept—the Taguchi loss function—is shown in Figure 1 for a glucose meter with a reference value of 96 mg/dL and increasing error up to the upper limit of the A zone in a Parkes error grid.
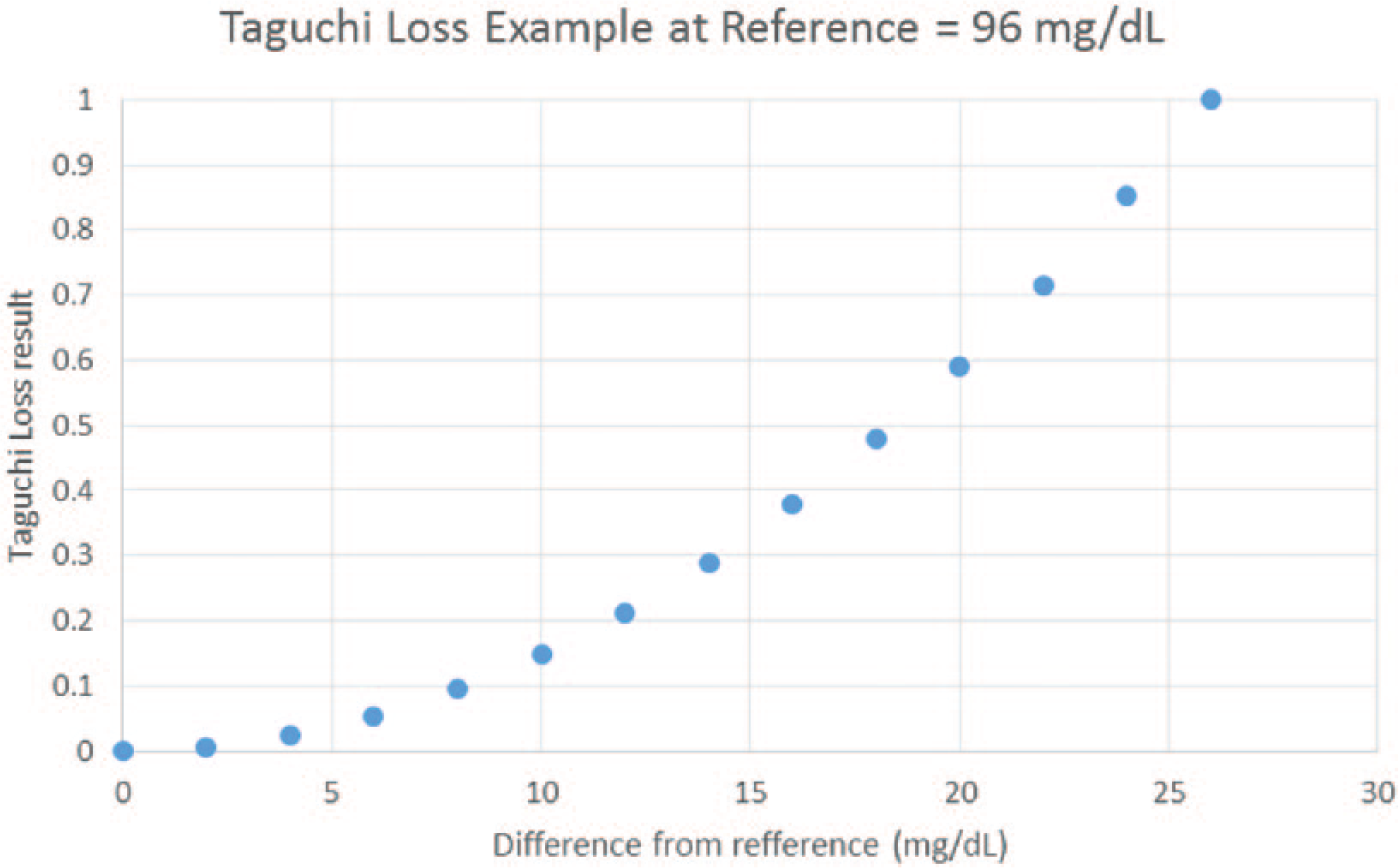
Increasing glucose meter error increases the risk of an incorrect medical decision as one approaches the A zone limit.
The Taguchi loss is expressed as a quadratic loss in value as one goes from zero to maximum error which is defined as the error at the A zone limit. The amount of loss has been scaled by a constant to provide a maximum loss of 1 and a minimum loss of zero. The Parkes error grid was chosen for simplicity but the concept also applies to the surveillance error grid and also for zones higher than the A zone.
Results
These concepts are illustrated with a few examples using simulated glucose meter results. Glucose was increased from 50 to 400 mg/dL in increments of 5 mg/dL (71 observations). These values are “truth.” Candidate glucose meter values were simulated starting with the true values with (normal distribution) precision simulated by using the NORMSINV(RAND( )) function in Excel and bias simulated by using a percentage of truth. Taguchi loss function results were calculated for the A zone using a Parkes error grid with equation 1.
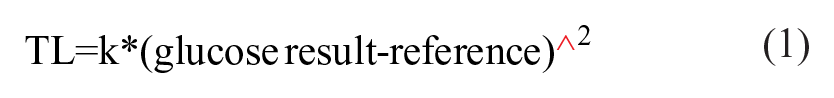
where TL = Taguchi loss
k = a constant so that values at the A zone limit = 1
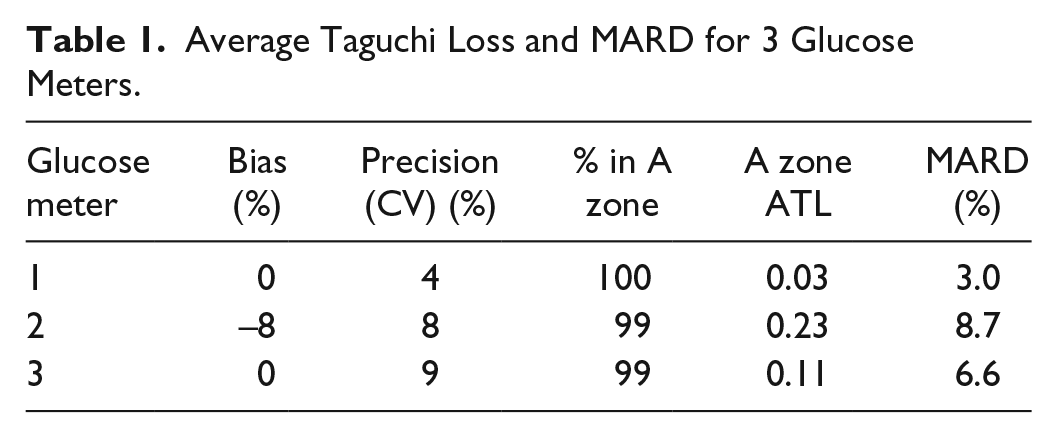
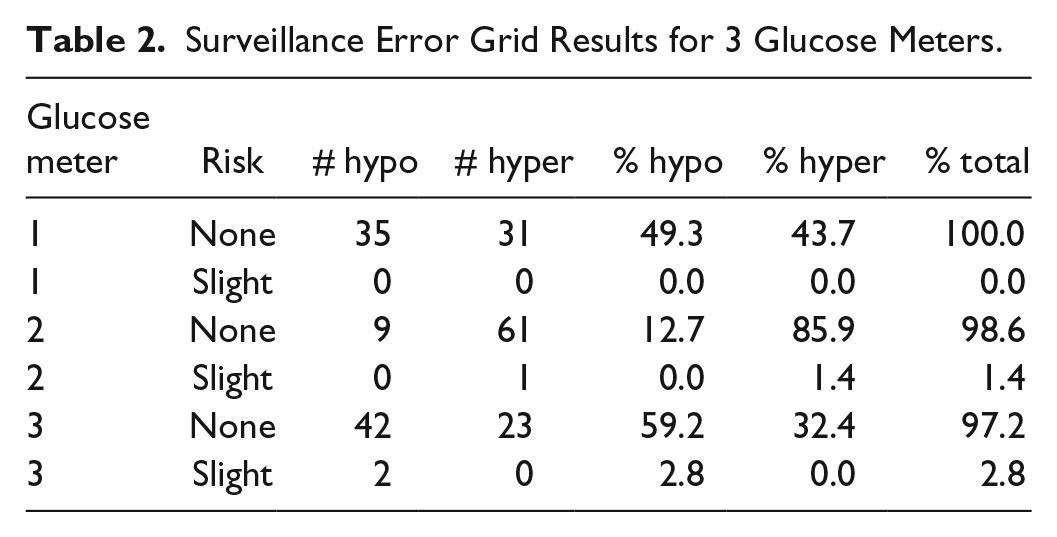
Note that the scaling factor depends on the reference value and the limit of the A zone for that reference value. Since the A zone is not symmetrical, different limits are calculated for positive and negative differences. For each simulation, the Taguchi losses were averaged and results outside of the A zone were excluded. Thus, for the A zone, there were 2 values, the percentage of results within the A zone and the average Taguchi loss (ATL). In addition a MARD value was calculated and the data were also processed through the surveillance error grid software 3 (see http://www.diabetestechnology.org/SEGsoftware). Tables 1 and 2 and Figures 2 to 4 show results for 3 simulated examples.
Average Taguchi Loss and MARD for 3 Glucose Meters.
Surveillance Error Grid Results for 3 Glucose Meters.
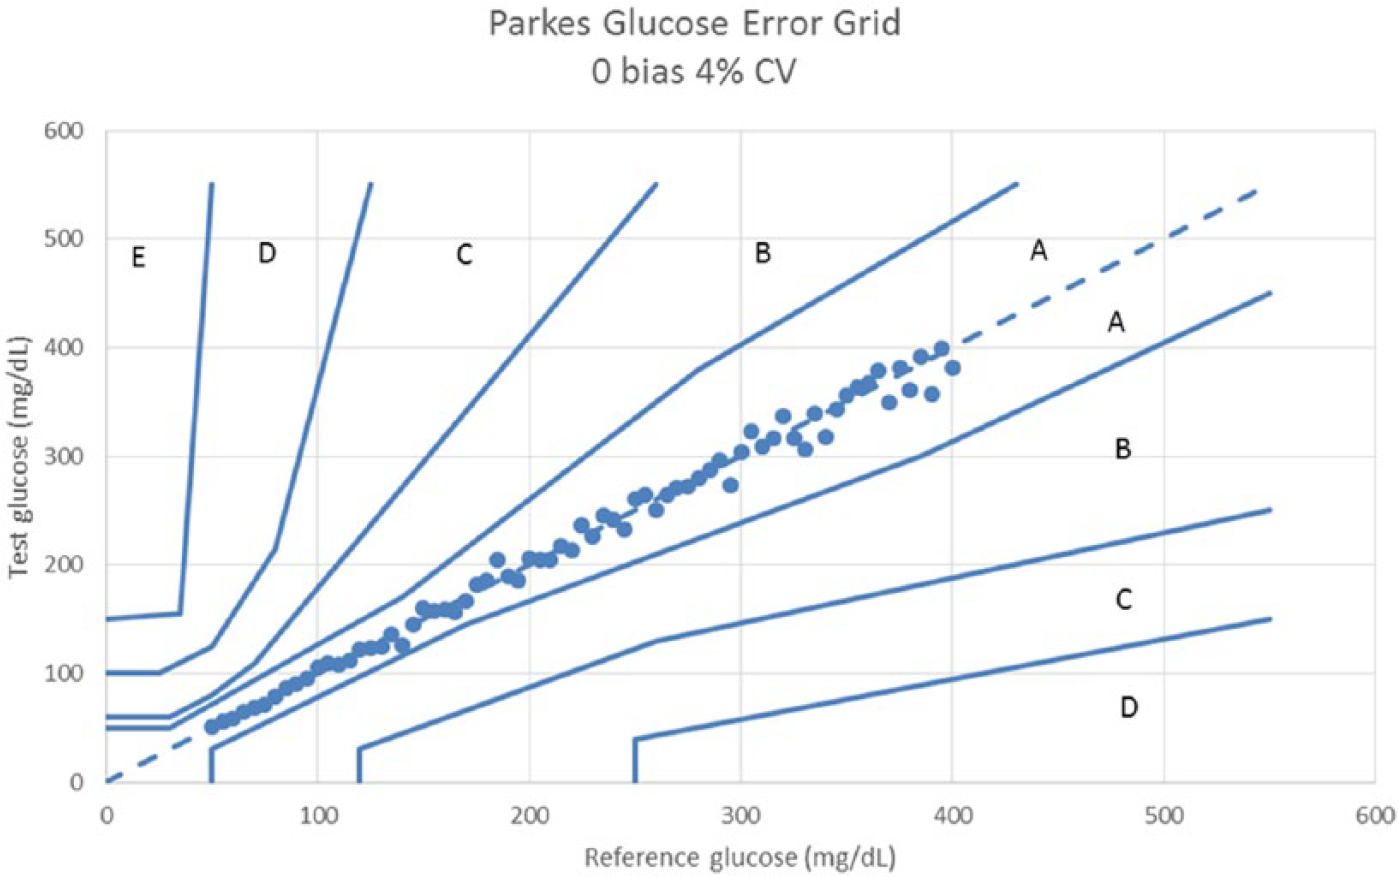
Parkes error grid for a glucose meter with 0 bias and 4% CV.
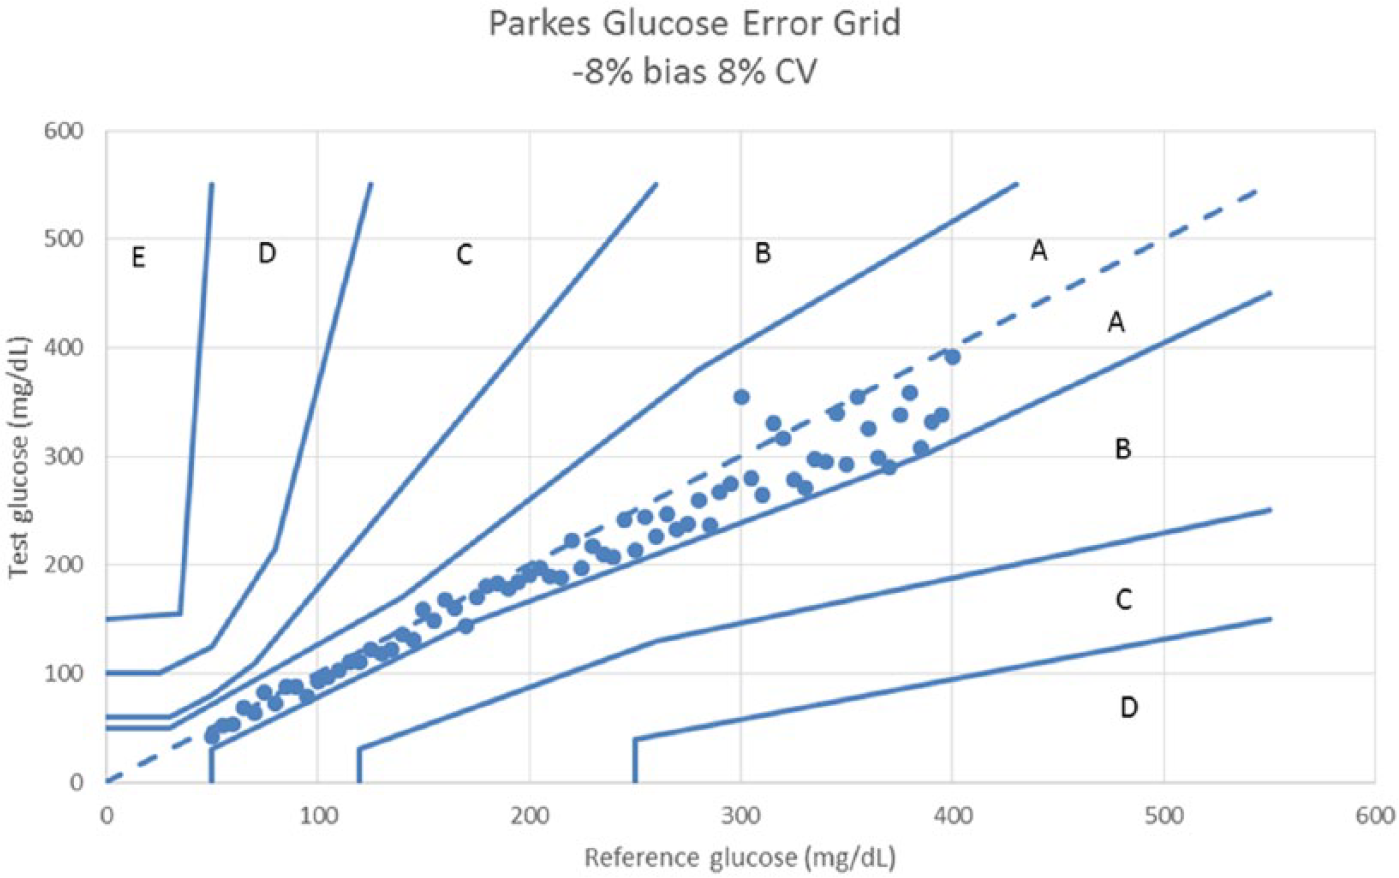
Parkes error grid for a glucose meter with –8% bias and 8% CV.
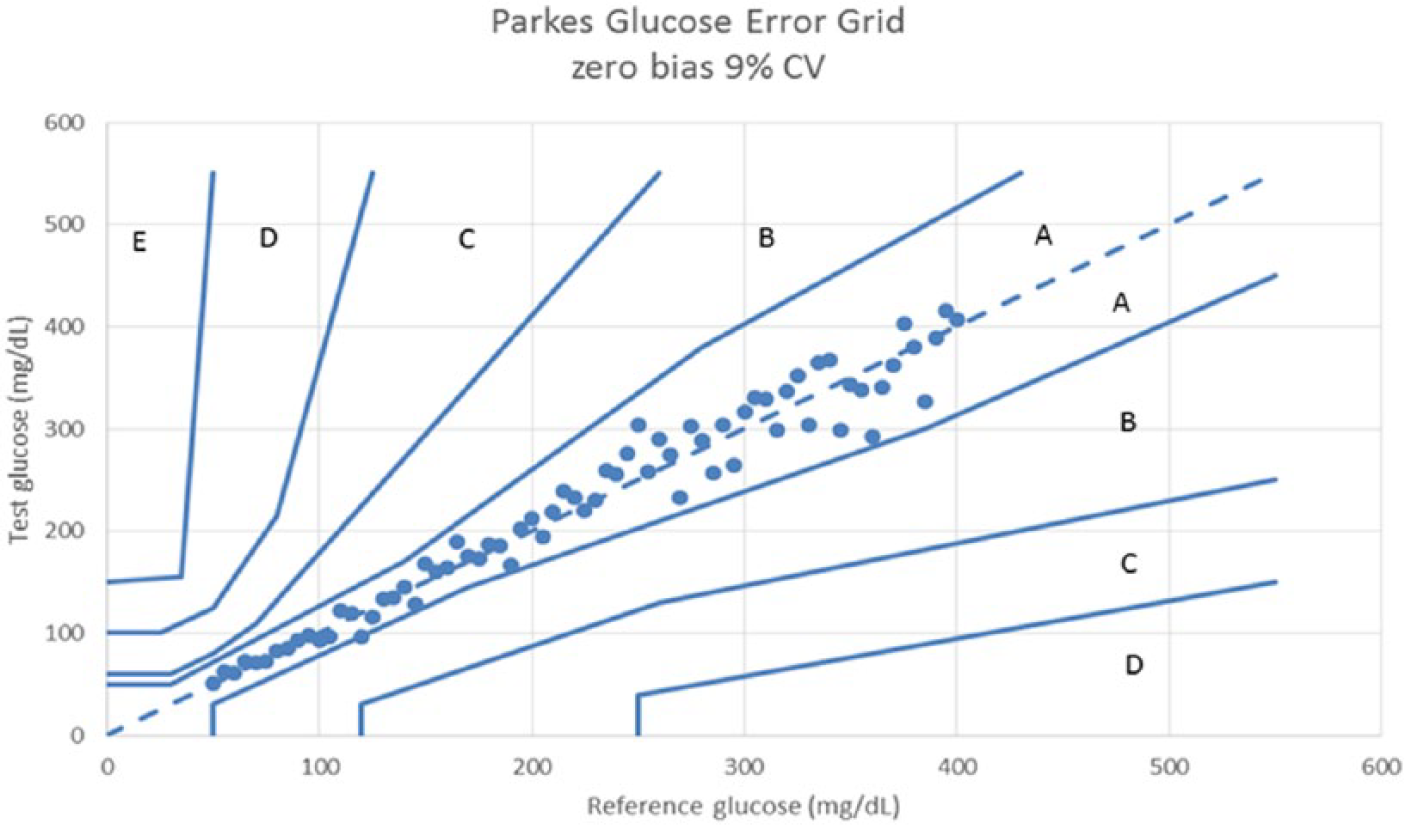
Parkes error grid for a glucose meter with 0 bias and 9% CV.
Discussion
The Taguchi loss function can be viewed as a risk function. That is, as the quality of a glucose meter assay degrades as results approach the limits of the A zone, there is more likelihood that an incorrect medical decision will be made. Using a quadratic function is a simple way to approximate this risk. Of course, one could use other functions as well. Whereas this article focuses on the Taguchi loss function for the A zone, it should be calculated for all error zones. An advantage of the ATL metric is that it is constrained for results in the zone for which they occur, unlike MARD. This can be thought of as a better way of handling outliers. All values are used in an error grid—the percentages in all zones must sum to 100%. Large outliers would be visible in an error grid plot, be reflected in the zone percentages, have separate ATLs for each zone but would inflate MARD without providing any clues as to why. Even though ATL is a squared value, the scaling factors take into account that the lower and upper limits of the A zone are not equally distant from the line of identity and thus different scaling factors are used for lower and upper limits. Thus, a negative difference has a higher TL value than the identical but positive difference. This differs from MARD whereby negative and positive differences produce the same ARD. The examples simulated show a reasonable separation among ATL values and have a greater separation than MARD. For ATL, one could expect a value of 0.5 for data that randomly filled the entire A zone. ATL is most useful for comparing glucose meters with good error grid performance (no or little data in higher zones).
Conclusion
The Taguchi loss function enhances the interpretation of glucose meter error grid results by providing a metric to differentiate quality among glucose meters that have similar percentages of results in the A zone. Unlike MARD, ATL is more directly related to the likelihood of making an incorrect medical decision and does not over summarize the data.
Footnotes
Abbreviations
ATL, average Taguchi loss; CV, coefficient of variation; MARD, mean absolute relative deviation; TL, Taguchi loss.
Declaration of Conflicting Interests
The author(s) declared no potential conflicts of interest with respect to the research, authorship, and/or publication of this article.
Funding
The author(s) received no financial support for the research, authorship, and/or publication of this article.