
Abstract
Background:
About 10% of patients with diabetes discontinue treatment, resulting in the progression of diabetes-related complications and reduced quality of life.
Objective:
The objective was to predict a missed clinical appointment (MA), which can lead to discontinued treatment for diabetes patients.
Methods:
A machine-learning algorithm was used to build a logistic regression model for MA predictions, with L2-norm regularization used to avoid over-fitting and 10-fold cross validation used to evaluate prediction performance. Data associated with patient MAs were extracted from electronic medical records and classified into two groups: one related to patients’ clinical condition (X1) and the other related to previous findings (X2). The records used were those of the University of Tokyo Hospital, and they included the history of 16 026 clinical appointments scheduled by 879 patients whose initial clinical visit had been made after January 1, 2004, who had diagnostic codes indicating diabetes, and whose HbA1c had been tested within 3 months after their initial visit. Records between April 1, 2011, and June 30, 2014, were inspected for a history of MAs.
Results:
The best predictor of MAs proved to be X1 + X2 (AUC = 0.958); precision and recall rates were, respectively, 0.757 and 0.659. Among all the appointment data, the day of the week when an appointment was made was most strongly associated with MA predictions (weight = 2.22).
Conclusions:
Our findings may provide information to help clinicians make timely interventions to avoid MAs.
There are now about 9 500 000 diabetic patients in Japan, 380 000 000 worldwide, and increasing. 1 It is vital for diabetic patients to start medical treatment early and keep regular hospital appointments to control their blood glucose level.2-5 In Japan, about 10% of diabetic patients discontinue treatment, a major problem in diabetic care. 5
Researchers have studied the factors related to treatment discontinuation,2-5 classifying diabetic patients as those continuing and those discontinuing treatment. Using multifactorial data, differences between the two groups were identified as risk factors by testing their statistical significance. Factors like being “men” and “a person with a job” proved to be high risks for treatment discontinuation. 5
This last set of researchers also found that an important risk factor, identified in a previous study, applied to patients in their own study who had discontinued treatment. This risk factor became operative when the amount of time after patients missed a scheduled clinical appointment (MA) crossed a particular threshold—between one day and six months depending on the purpose of each study. However, it’s not easy to set appropriate thresholds for outpatients whose hospital visits are at quite different intervals. In addition, external factors such as the amount of oral diabetic medications a patient had left (because patients feel no need to visit the clinic when they still have medications on hand) may affect a patient’s MA. Therefore, study of all factors that may impact MAs, leading to treatment discontinuation, must be as comprehensive as possible. Furthermore, even if patients at high risk of discontinuing treatment can be identified, clinicians need to identify the MAs that are most likely to lead to treatment discontinuation so they can know when they should intervene to encourage patients at high risk not to miss a predicted MA.
Accordingly, our study focused on diabetic patients’ scheduled clinical appointments to predict MAs most likely to trigger treatment discontinuation. From electronic health records (EHR), we built a prediction model of MAs by using a machine-learning algorithm. Analysis of MAs in the EHR allows for them to be predicted independent of how treatment discontinuation is defined. We included factors from previous studies related to treatment discontinuation and all external factors possibly related to discontinuation. The Institutional Review Board approved the study.
Methods
Nomenclature
“Factors,” which denotes patient characteristics (age, sex, etc.) and phenomena that can affect an MA (how and when an appointment was made, etc.), are called “features” when part of our mathematical models.
Model Design
We designed a logistic regression model that predicts a class
In “Feature design” below, observed values of each quantitative variable, for example, blood test results, were linearly transformed (normalized) to make a variance of each variable = 1 and assigned to vector
Modeling With L2-Norm Regularization
When the training data size, N, is smaller than the dimension of feature vectors, or a training data sampling is biased, maximum-likelihood estimation often overfits a logistic regression model into the training data, leading the model to classify many new appointments inaccurately.
6
We used a machine learning software, Classias,
7
which employs an L2-norm regularization method to mitigate overfitting and improve the model’s generalizability. With the regularization, we estimated w as
Evaluation Method
The receiver operating characteristic (ROC) curve, area under the curve (AUC), precision, recall, and F-measure were used to measure prediction performance.
We used 10-fold cross-validation to assess how accurately the model performed for unknown data. Cross-validation partitions the whole data into 10 subsets and repeats the performance measure 10 times. Each time, one of the 10 subsets is used as the test data, the other subsets as the training data. The model was trained by using the training data and then was tested by using the test data. The final score was the average performance of all 10 performance measures. For each test, we varied the hyper parameter
To determine each feature’s contribution to prediction in the model, we examined the absolute values of each feature’s weight learned by using the whole data. Using 10-fold cross-validation on the whole data, we set
Feature Design
Features from a patient’s EHR were designed to fully cover factors related to treatment discontinuation, one set related to the patient’s clinical condition (X1, n = 29 025), the other to previous findings (X2, n = 97).
Table 1 shows examples of X1. To classify clinical conditions chronologically, we generated two features for each, one fulfilled within 90 days before the target appointment and the other without limit. The X1 group has numerous features but most with a zero value, hence a very sparse construction.
Examples of X1.
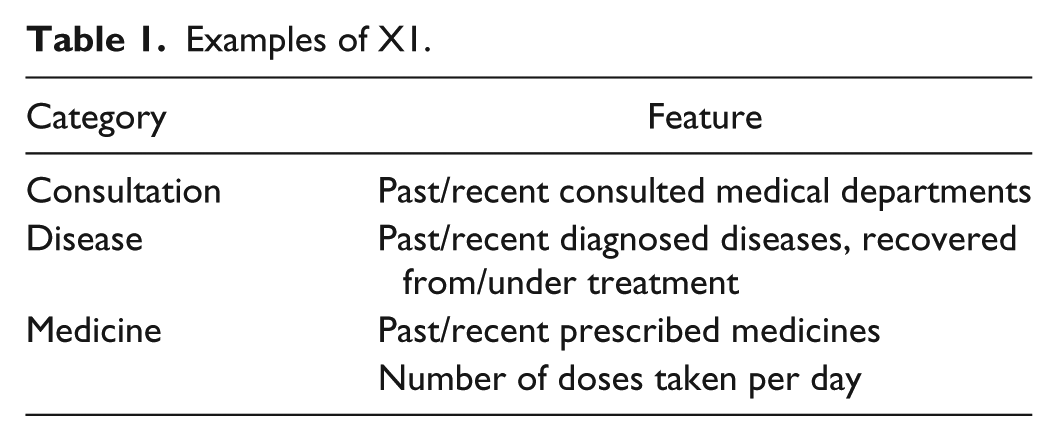
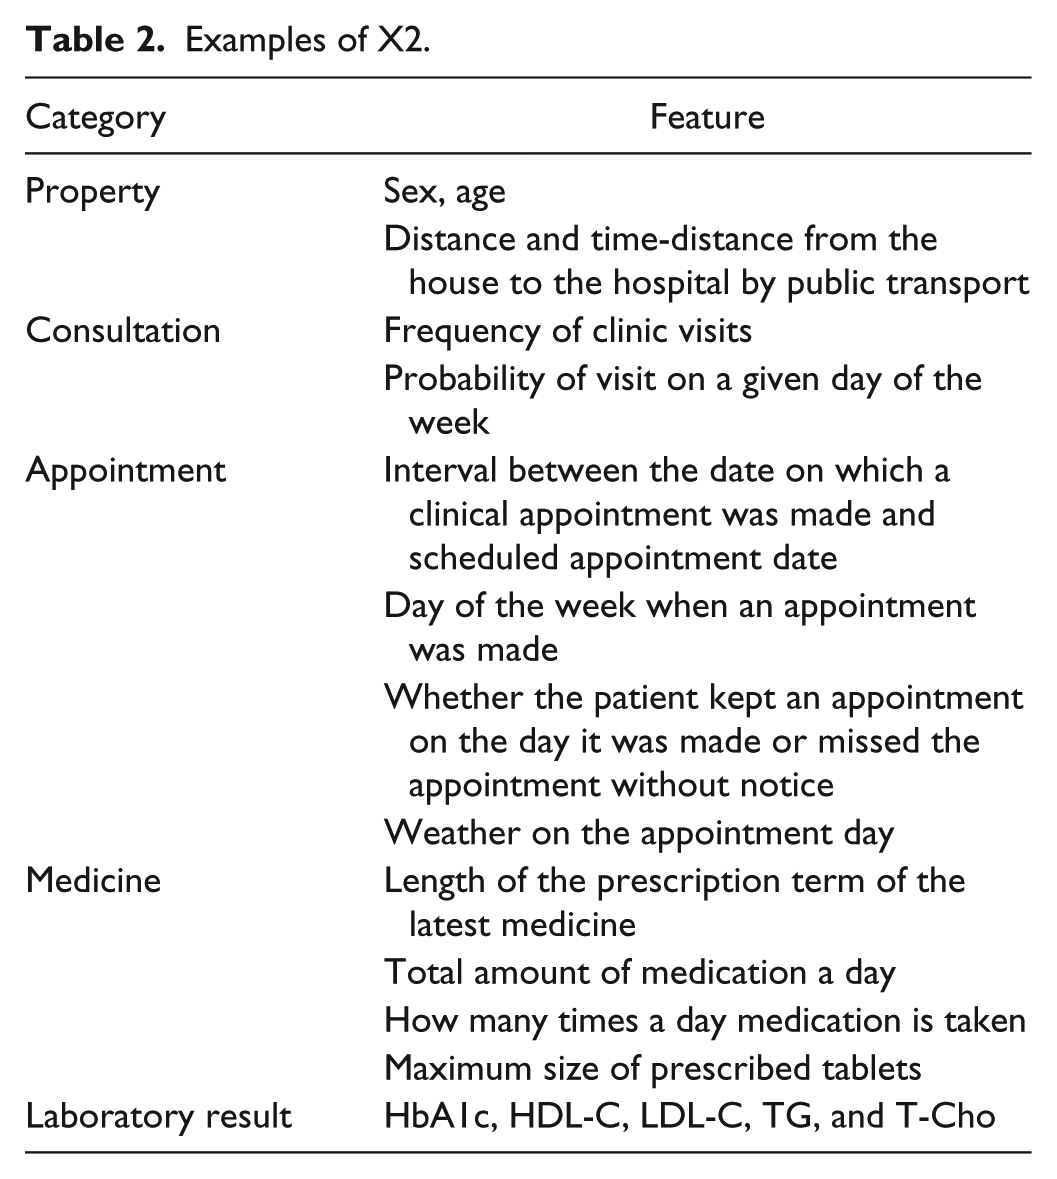
Table 2 lists examples of X2, most of whose features are quantitative variables. In designing X2, we referred to previous research such as examinations of discontinued treatments, interviews with specialists and patients, and human behavior analysis. Since previous research had identified sex, age, distance from house to hospital and travel time, and laboratory results as factors related to treatment discontinuation,2-5 we used them, too. As an example of our design technique, because a diabetes specialist told us that for patients who often forget their medication, the specialist monitored compliance by comparing the intervals between scheduled clinical appointments, length of prescription term, and amount of medication the patient still had, we incorporated this calculation as a check on compliance. Because a diabetic patient told us that the very accumulation of experiences with medical treatment in general stimulated his motivation to continue diabetes treatments, we used the history of clinic visits and number of diagnosed diseases. Because human behavior analysis uses behavior patterns and external factors, we used the day of the week an appointment was scheduled. To classify behavior patterns by medical department, one feature included all departments, the other only the diabetes unit.
Examples of X2.
Class Design
Scheduled clinical diabetes appointments were classified as to whether they were kept or missed. The missed appointments (MAs) had been made but were missed on the scheduled day. The kept appointments (KAs) were kept on the scheduled day. Appointments—not patients—were analyzed because a patient who had missed an appointment at some point might have kept others, so if we had analyzed patients, we would have been unable to distinguish the status of “kept” or “missed” for that patient.
Appointments the patient changed to another day (and kept) were obviously eliminated from the MAs. Also, if a patient missed an appointment but had an appointment in the diabetes department for a later day—and kept it—the first appointment was removed from the MAs.
A few inaccuracies unavoidably tainted the MAs. For example, if patients changed clinics without notice but continued treatment or severe weather or traffic accidents prevented appointments from being kept, such cases do not involve “treatment discontinuation,” so they should be removed from the MAs, but they are so hard to detect in the EHR that they ended up included.
Results
Data Set
All prediction experiments were performed by using records from the University of Tokyo Hospital that included the history of 16 026 clinical appointments scheduled by 879 patients whose initial clinical visit had been made after January 1, 2004, who had diagnostic codes indicative of diabetes, and whose HbA1c had been tested within 3 months after their initial visit. The records were dated between April 1, 2011 and June 30, 2014. The 879 patients kept 15 104 of the 16 026 appointments scheduled, and the average number of appointments per patient was 17.4 with a standard deviation of 11.0. Hence, 922 appointments were missed by 285 patients, the average number per patient was 3.2, and the standard deviation was 3.9. Of the 285 patients, 207 had fewer MAs than the average (3.2), and their MAs accounted for about 40% of the total.
Prediction Performance
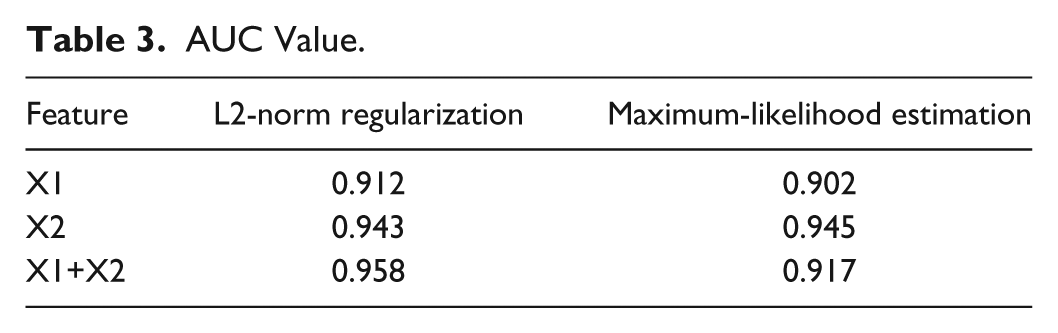
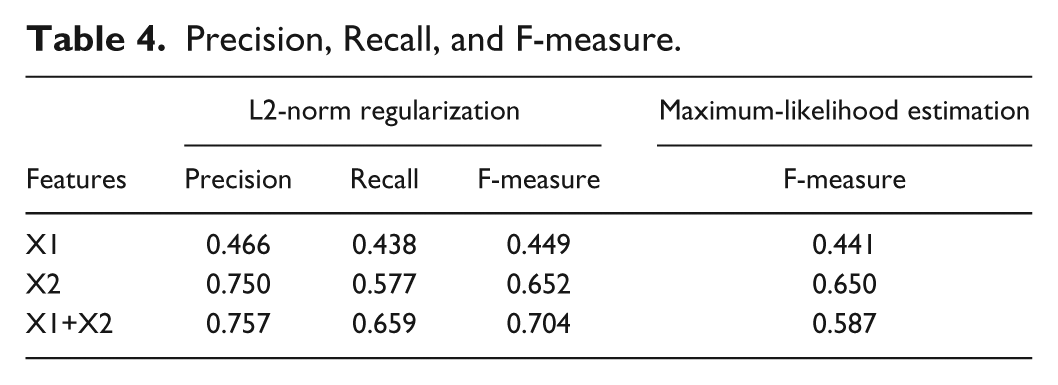
We examined the difference in prediction performance between models by using the X1, X2, and X1+X2 groups. Figure 1 and Tables 3 and 4 show the prediction performance. The X2-group model (AUC = 0.943) predicted the MAs with higher accuracy than did the X1 group (AUC = 0.912), and using both the X1 and X2 groups (AUC = 0.958) yielded even greater accuracy. The precision, recall, and F-measure of the model when using both X1 and X2 groups were, respectively, 0.757, 0.659, and 0.704. For reference, Tables 3 and 4 show, respectively, the AUC value and F-measure of the models learned by maximum-likelihood estimation (
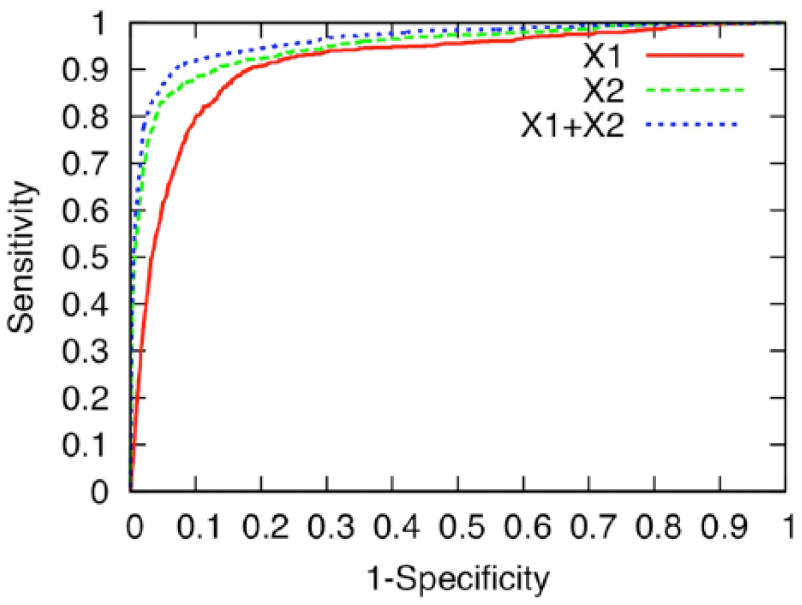
ROC curve that measures the prediction performance of the logistic regression model with L2-norm regularization by using the X1, X2, and X1+X2 groups. The axes of the ROC curve consist of 1-specificity (TN/(FP+TN)) and sensitivity (TP/(TP+FN)), where TN = true negative, FP = false positive, TP = true positive, and FN = false negative.
AUC Value.
Precision, Recall, and F-measure.
Figures 2 and 3 show AUC and F-measure scores obtained with 10-fold cross-validation of the whole data when
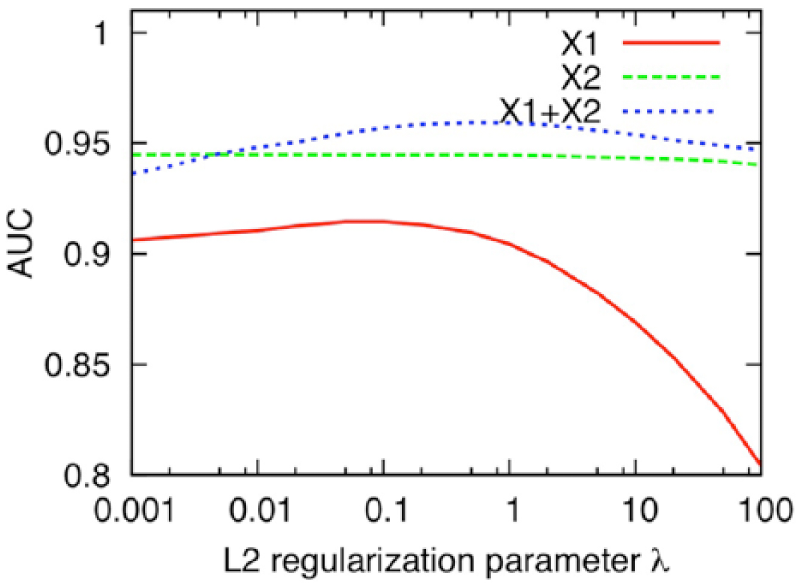
AUC scores obtained with 10-fold cross-validation of the whole data when
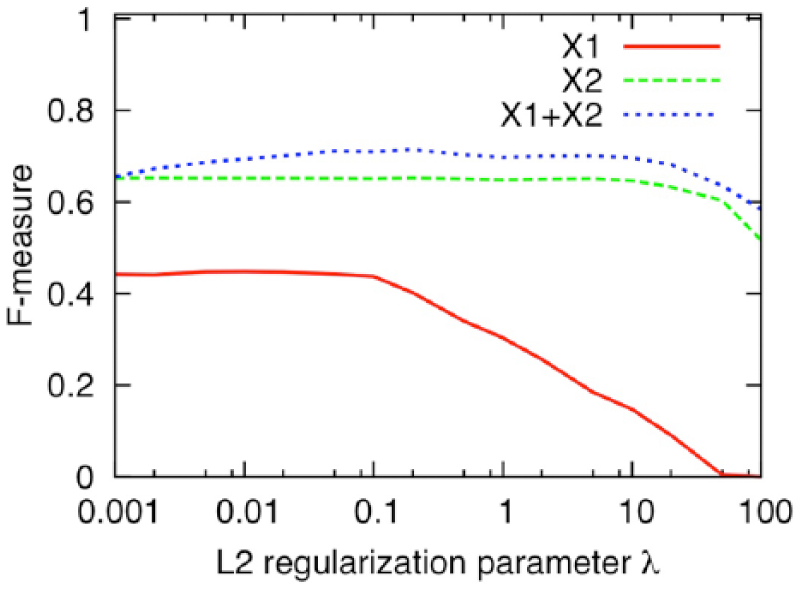
F-measure scores obtained with 10-fold cross-validation of the whole data when
Discussion
Ours is the first study to use machine learning to build a model that can predict MAs most likely to result in discontinuation of treatment for diabetes by using EHR, although some groups have used machine learning for various other aspects of diabetes research.8-10 The accuracy of prediction was validated.
Prediction Model’s Performance and Future
Our model performed well in predicting MAs, with an AUC at 0.958—an AUC value over 0.9 is considered to be an excellent prediction score. 11 This promises to make the model a powerful tool for showing clinicians the suitable timing for intervening to keep patients continuing hospital visits.
Of course, earlier prediction of MAs is required to prevent discontinuation of treatment. We will need to improve our current model by adding new features such as changes of diabetes treatment over time and progression of diabetes. Furthermore, the quality of interaction perceived by the patient may be another factor determining whether the patient returned; we plan to evaluate this in a future model. If we can predict MAs early enough for clinicians to encourage diabetic patients to continue treatment, the number of MAs will decrease significantly, and diabetes care will be also improved.
One of our authors found that “DialBetics,” the telemedicine diabetes self-management system that can automatically give advice on the basis of a diabetic patient’s input and registry data, led patients to improve their dietary habits.12,13 We will combine DialBetics with our model and investigate whether coordination of clinical appointments with our model more effectively motivates patients to keep clinical appointments.
General Applicability
Our model was evaluated with outpatient EHR from one hospital in Japan. To assess its general applicability, we must evaluate the model with patients at other hospitals in several different countries that have different demographics and regional characteristics. We will also evaluate our model with patients who suffer from other diseases, like asthma and other chronic diseases, that require similarly continual outpatient treatment, and we will investigate the differences in features.
Design of Features in the Model
The features we deemed possibly relevant to MAs (X2 group) rendered a higher prediction accuracy compared with those related to patients’ clinical condition (X1 group). This suggests that features derived from knowledge about and experience with the diabetes treatment of clinicians is more effective for improving accuracy in predicting MAs. Nevertheless, X1 is also valuable since use of both X1 and X2 resulted in a higher prediction accuracy. Therefore, in a future study, we will identify the most contributive features in X1 to construct a simpler model with fewer features.
Machine Learning of Features’ Weight
The highest prediction accuracy was obtained by the model constructed by machine learning without maximum-likelihood estimation but with L2 regularization using only the X1 group or both X1 and X2 groups. Since the number of features in these groups exceeds that of the training data, it carries a high risk of overtraining a part of the training data. We confirmed that L2 regularization reduced over-fitting well. The accuracy of the model that learned with L2 regularization was almost the same as that of the model constructed with only the X2 group using maximum-likelihood estimation because overfitting was effectively suppressed by regularization reducing the number of features to under 1% of the whole training data.
The appointment records we used were possibly uneven because of records obtained from patients who made many appointments. We will consider the relationship between prediction accuracy and the uniformity of appointment records.
Machine learning is generally applied to “bigger” data than we used in this study (16 026). 14 The prediction accuracy will be improved by using more data because machine-learning generalization increases as the number of training data increases. 15 SS-MIX2, which is currently being developed to standardize medical data stored in the EHR systems of hospitals, will enable us to use “big data” and improve the prediction accuracy of our model in the near future.16,17
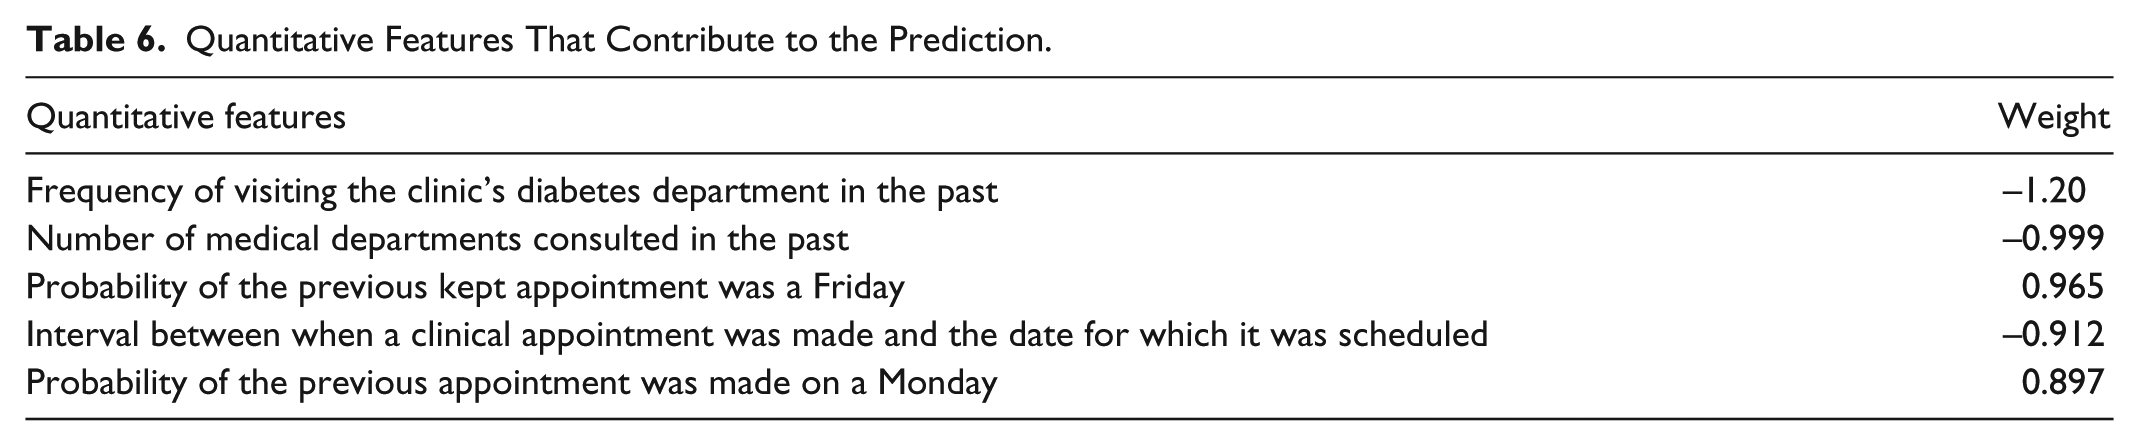
How Features Contribute to MA Predictions
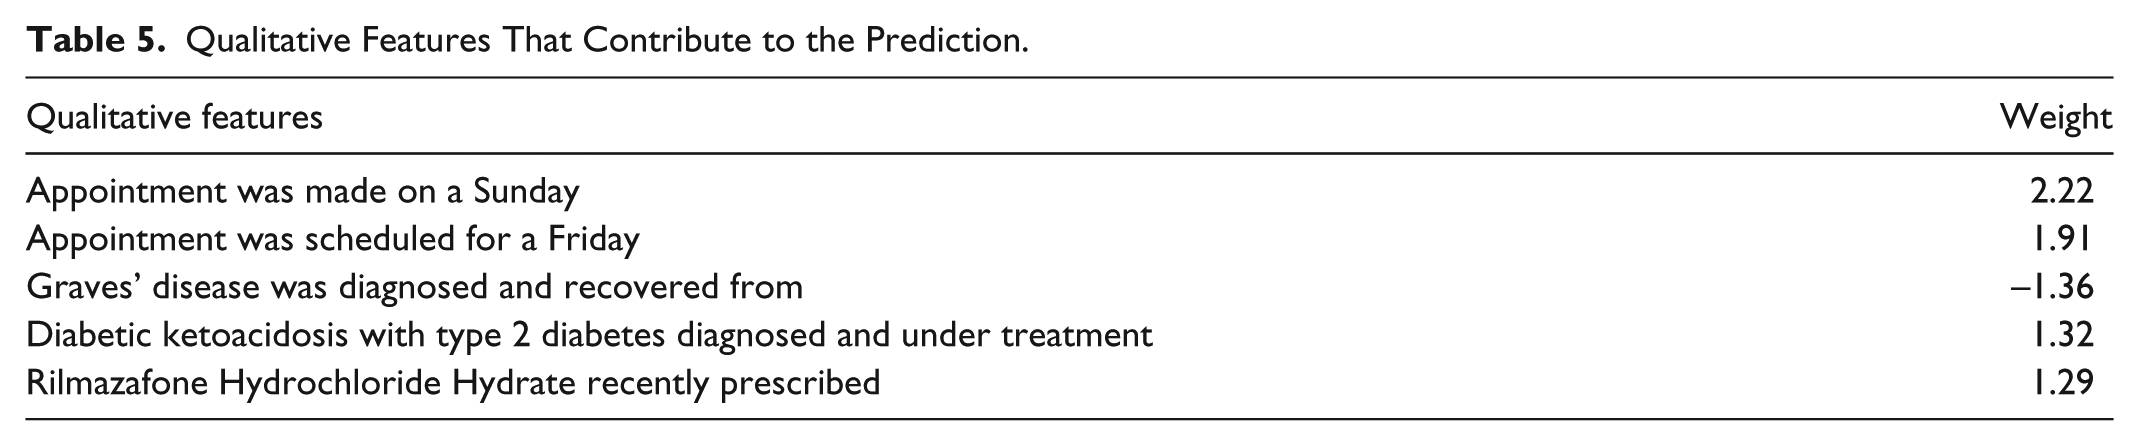
Tables 5 and 6 show the top five qualitative and quantitative features, respectively. These features were given the largest absolute weights in our trained model and thus contributed strongly to MA prediction. We found that features related to when and how appointments were made, rather than to patients’ clinical condition, influenced the accuracy in predicting MAs. It would seem that irregularly scheduled appointments are more apt to be missed. We examined the largest qualitative/quantitative features in detail.
Qualitative Features That Contribute to the Prediction.
Quantitative Features That Contribute to the Prediction.
The largest qualitative feature was “Appointment made on a Sunday.” In all, 164 (about 1%) of total appointments were made on Sundays; 73 (44.5%) of those appointments were MAs. The percentage of MAs in the appointments made on Sunday was much higher than that of the total appointments (5.75%). Physicians do not usually make appointments on Sundays, so consultations on Sunday are very unlikely except for visits to the emergency room. This means that those 164 Sunday appointments were made for the patients who needed to have a follow-up visit and be examined by the physicians who examined them in the emergency room. It seems that some patients came on a Sunday because they had used up their medications: the prescription for their latest medicine of 39 of the 73 MAs was expired. Another possibility is that appointments made on Sundays, and appointments made only 8 days after a previous one, suggest a sicker patient or more complex condition. The reason the rest of the appointments were missed is not clear. Further investigation is needed to clarify why the appointments made on Sundays are more likely to be missed.
The qualitative feature “Appointment scheduled for a Friday” was second largest: 493 (17.4%) of 2831 appointments scheduled for a Friday were MAs. We examined the previous appointments of the KAs scheduled for a Friday and compared them with the previous appointments of MAs. Generally, the previous appointments of the KAs were likewise scheduled on Fridays, suggesting that KA patients incorporated visits to the hospital for diabetes treatment into their life as a matter of routine. In contrast, the previous appointments of MAs were less likely to have been scheduled on a Friday, suggesting that Friday was not their regular hospital-visit day. This suggests that the same day of the week as the patient’s previous hospital visits should be considered when making an appointment.
Last, we examined appointment intervals, which is the fourth largest quantitative feature (the third largest involved diabetes history). The average interval in the case of KAs was 45 days, while that in the case of MAs was only 8 days. Next appointments in the case of KAs are usually made on the day of patients’ hospital visits. Of course, the interval between appointments is dictated by a patient’s health status; but, in practice, it generally falls between one and two months. As expected, most MAs were made on a day when a patient did not visit the hospital according to our examination. This suggests that appointments should be made on days when patients have a hospital visit.
We will analyze other of the largest features related to clinical condition. For example, the feature, “Rilmazafone Hydrochloride Hydrate recently prescribed,” may indicate that those patients had a sleep disorder, which might suggest a useful hypothesis about why appointments are missed.
Conclusion
We designed a model that can predict with high accuracy when a diabetic patient is likely to miss a scheduled hospital appointment, possibly leading to discontinuation of treatment. This is the first study utilizing machine learning to design this kind of model. Our model should be a powerful tool for letting clinicians know when they must intervene to prevent treatment discontinuation. We plan to conduct a prospective predictive study based on our findings to establish the usefulness of the current findings.
Footnotes
Abbreviations
AUC, area under the ROC curve; EHR, electronic health record; KA, kept appointment; MA, missed clinical appointment; ROC, receiver operating characteristic.
Declaration of Conflicting Interests
The author(s) declared the following potential conflicts of interest with respect to the research, authorship, and/or publication of this article: Kayo Waki, one of the authors, belongs to the Department of Ubiquitous Health Informatics, supported by the University of Tokyo and NTT DOCOMO, Inc.
Funding
The author(s) disclosed receipt of the following financial support for the research, authorship, and/or publication of this article: This work was funded by the University of Tokyo and Nippon Telegraph and Telephone Corporation (NTT) as a joint research in the University of Tokyo COI (Center of Innovation), Sustainable Life Care, Ageless Society dedicated to Self-managing Healthcare in Aging Society of Japan.