
Abstract
Keywords
Hemoglobin A1c has a predictable correlation to blood glucose, and is used to estimate average glucose for the previous 2-3 months. 1 Hemoglobin variants may invalidate HbA1c results in vitro by analytical interference or in vivo by altering RBC lifespan or glycation rate. Several researchers have examined analytical reproducibility in heterozygous Hemoglobin AS (HbAS) samples, i.e. from subjects with sickle cell trait (SCT), and determined which assays provide reproducible results.2-5 No study to date has compared HbA1c to 3 months of glucose measurements in persons with SCT and diabetes. We asked if the correlation between HbA1c and average glucose was altered by the presence of SCT.
Five non-Hispanic black women with SCT and type 2 diabetes collected fasting and postprandial glucose (PPG) (Contour Glucose Meter, Bayer HealthCare, Daphne, AL) over a 3-month period. The average number of fasting measurements per person was 21.4 (SD = 1.9). The average number of postprandial (lunch or dinner) measurements was 18.6 (SD = 3.8). HbA1c was measured 4 times over a 4-month period (Siemens DCA 2000, Tarrytown, NY). The DCA 2000 is traceable to the Diabetes Control and Complications Trial (DCCT) and is reproducible in the presence of SCT. 5 Hemoglobin electrophoresis (Beckman Coulter, Fullerton, CA) was used to identify variant hemoglobins. HPLC (D-10 Biorad, Hercules, CA) was used to confirm the samples with SCT.
HbA1c from the third month was correlated with average fasting and PP glucose by linear regression. Chi-square analysis was used to compare the intercept and slope of both regression lines to control groups of non-Hispanic blacks (n = 22), non-Hispanic whites (n = 29), and both groups combined (n = 51). All controls were adults with type 2 diabetes; none had a hemoglobin variant.
Average age of the SCT subjects was 61.0 years (SD = 11.0). Their average HbA1c was 7.1% (SD = 0.6), with a range of 6.3-7.9%. In all, 51.7% of the white control group and 77.3% of the black control group were women. Average HbA1c for control subjects was 7.0% (SD = 1.4) for whites and 6.9% (SD = 1.1) for blacks.
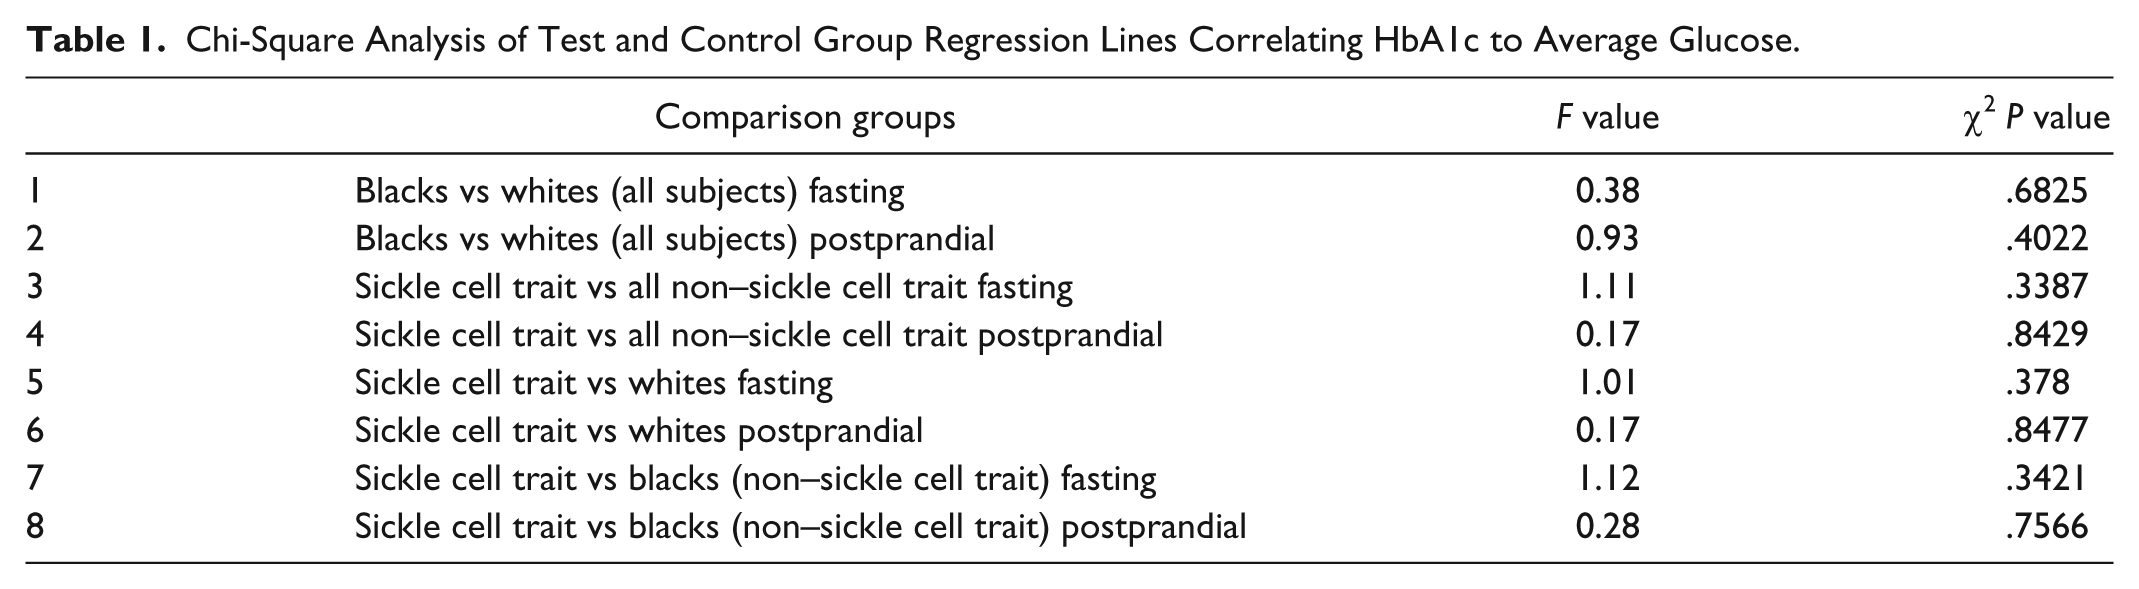
We had previously reported the correlation between glucose and HbA1c in this control group. 6 We determined a PPG correlation of PPG mg/dL = Exp[(1.261 × ln(A1c)) + 2.555], R2 = .614, P < .0001. For fasting glucose we reported a linear relationship of FG mg/dL = (18.939 × A1c) – 1.864, R2 = .586, P < .0001. Table 1 shows the chi-square F value and P value comparing the slope and intercept of the HbA1c to glucose regressions between the SCT and control groups. Significantly, the correlations of HbA1c to glucose for the SCT group were not different from any other group.
Chi-Square Analysis of Test and Control Group Regression Lines Correlating HbA1c to Average Glucose.
In this study, 5 individuals with SCT and type 2 diabetes had a predictable correlation between HbA1c and average glucose. Since the participants in the study were middle-aged adults in otherwise good health, these results might not be generalizable to individuals with other comorbidities or to children. However, our study demonstrates that at least in some cases, the correlation of HbA1c to average glucose is predictable for individuals with SCT.
Footnotes
Abbreviations
DCCT, Diabetes Control and Complications Trial; HbAS, Hemoglobin S heterozygote; HbA1c, hemoglobin A1c; PPG, postprandial glucose; SCT, sickle cell trait; SD, standard deviation.
Declaration of Conflicting Interests
The author(s) declared no potential conflicts of interest with respect to the research, authorship, and/or publication of this article.
Funding
The author(s) disclosed receipt of the following financial support for the research, authorship, and/or publication of this article: Bayer Diabetes Care provided glucose meters and test strips. The study was funded by grants from the American Society for Clinical Laboratory Science and the University of West Florida.