
Abstract
The so-called big data revolution provides substantial opportunities to diabetes management. At least 3 important directions are currently of great interest. First, the integration of different sources of information, from primary and secondary care to administrative information, may allow depicting a novel view of patient’s care processes and of single patient’s behaviors, taking into account the multifaceted nature of chronic care. Second, the availability of novel diabetes technologies, able to gather large amounts of real-time data, requires the implementation of distributed platforms for data analysis and decision support. Finally, the inclusion of geographical and environmental information into such complex IT systems may further increase the capability of interpreting the data gathered and extract new knowledge from them. This article reviews the main concepts and definitions related to big data, it presents some efforts in health care, and discusses the potential role of big data in diabetes care. Finally, as an example, it describes the research efforts carried on in the MOSAIC project, funded by the European Commission.
Following the definition endorsed by the working group on “big data analytics and data mining” of the International Medical Informatics Association, big data is data “whose scale, diversity, and complexity require new architecture, techniques, algorithms, and analytics to manage it and extract value and hidden knowledge from it.” 1 Such definition contains the main ingredients of big data: on one hand their multifactorial nature, on the other hand the technological change that they imply. More precisely, it is widely agreed that the term “big data” is related to concurrent presence of the V properties, the most important being volume, variety and velocity, 2 but also including veracity and variability. While volume is somehow obvious since such data are “large” in size, variety is related to the different format in which the data are collected, from structured information to text, from images to signals. Velocity is related to the need of processing data at a pace that is fast enough to support decision making. Veracity is related to the uncertain nature that is often connected to data of large volumes, very often or collected with limited quality control or without preprocessing. Finally, variability is associated with the time variance of the data, especially in case they are collected from real-time processing or in case of continuous data streams. Since what defines big data is the contemporaneous presence of 2 or more of the factors reported above, a direct consequence is to change the technological architecture used to manage the data and the algorithms designed to analyze them. Different domains have different “comfort zones” in terms of technologies and algorithms. For example, astrophysics informatics solutions are designed to deal with very large images and signals but are not optimized to manage textual reports, while health information systems work well with data with high variety but not with large data sets to be processed in real time.
From an IT point of view, 3 main types of big-data oriented solutions are now available and increasingly adopted. First, cloud computing provides affordable solutions to obtain high computational performances. 3 Second, parallel programming is progressively becoming easier and more efficient: “MapReduce,” a programming model that allows implementing algorithms on distributed environments, now represents a very successful and widely used paradigm. 4 Finally, new database technologies, such as No-SQL databases, are now available to address both the variety and the scalability problems. 5
The interest in big data management from researchers and funding bodies, such as NIH, EU, and others, is related to 3 joint facts: (1) health care is collecting large amounts of data from EHRs, home monitoring, and biomedical research, including -omics; (2) thanks to the advances in technologies and methods for data management and to the new analytics also coming from the private sector, we are able to store, retrieve, analyze, and extract knowledge from big data collections; 6 (3) if we merge those large data collections we may obtain even larger data sets, holding the promise to improve our understanding of diseases at a considerable higher pace than today. 7
The NIH Big Data to Knowledge (BD2K) Initiative is now fostering several activities to support the full exploitation of the large collection of data available in health care. 8 A fundamental step is the training of young data scientists, provided with the skills necessary to store, process, and analyze very large and diverse data sets. Moreover, the NIH is funding big data excellence centers, which will be in charge of translating ideas into actionable tools and case studies. Finally, BD2K is now promoting the sharing of the data sets, through the creation of a data discovery index, an indexing system that should facilitate using and citing data sets within secure data management architectures.
A number of research initiatives and directions are already gaining benefits from the big data technologies. Large data integration efforts have started to improve outcome research, such as PCORI in the United States. 9 Moreover, collaborative efforts are designed not only to share data but also to disseminate large-scale analytics to bring out the value of observational health data, such as the Observational Health Data Sciences and Informatics (OHDSI) Research Network (http://www.ohdsi.org/).
Large image repositories and data sharing instruments are available, 10 as well as systems to reuse administrative and clinical information. 11 Moreover, increasing attention is devoted to the capability of including in the health care data ecosystem also new data sets, such as the data coming from smart homes, mobile sensors, and wearable devices12,13 or those coming from Social Media, which may enable to better understand patients’ behavior or even to discover drug adverse reactions or unforeseen side effects. 14 An interesting area that may successfully exploit big data technologies is electronic phenotyping, that is, a set of complex computerized queries to an EHR system or clinical data repository that allows ascertaining a clinical condition or characteristic (phenotype).15,16
Genomics data repositories are naturally dealing with big data. General resources such as DBGAP (http://www.ncbi.nlm.nih.gov/gap) 17 and the Cancer Genome Atlas (TCGA) (http://cancergenome.nih.gov/) are important data sources that now also contain phenotype and genotype information. A peculiar project is the eMERGE network, which was designed to combine -omics biorepositories with electronic medical record (EMR) data for supporting genetic research (https://emerge.mc.vanderbilt.edu/). 18
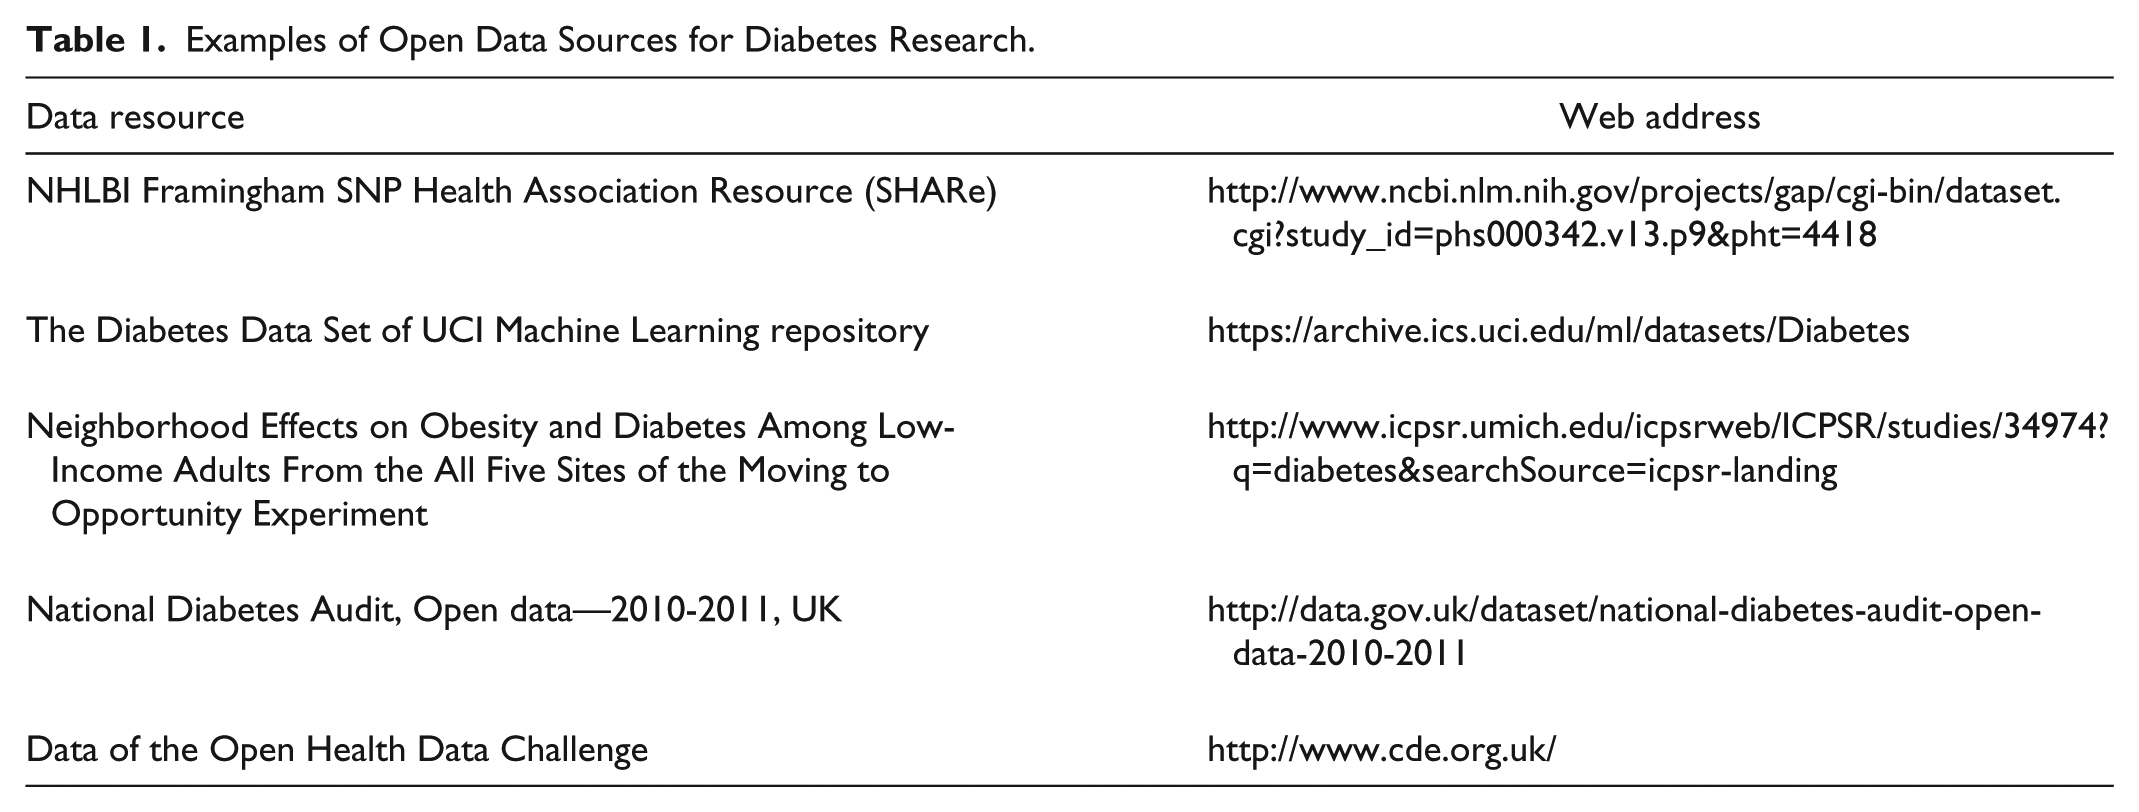
Finally, an interesting direction is provided by the open availability of large data repositories involving patients, which can be used to foster research; see, for example, “Patients Like Me” (http://www.patientslikeme.com/). In the area of diabetes, the T1D Exchange Clinic Network, involving 67 clinics in the United States, has implemented a shared electronic registry that collects data coming from more than 26,000 patients. This initiative has already enabled a large number of studies exploiting the collected data,19,20 and such data are openly available to researchers. Table 1 reports an example set of useful data resources in diabetes.
Examples of Open Data Sources for Diabetes Research.
There are, of course, several caveats when dealing with the big data. The IT architectures and studies have to deal with privacy and data protection issues, which may hamper the practical implementation of a large data integration plan.2,21,22 Moreover, the heterogeneous quality of the data that may be integrated and collected can lead to overconfident conclusions. 23 Finally, the reproducibility of the results obtained may need to be carefully assessed. 2
In summary, the issue of dealing with big data is certainly a hot topic in health care. This requires proper understanding of the issues and case studies to assess the real benefits that the new technologies may provide. In the following sections we deepen the insight on the impact that we may expect to see in diabetes management and we will describe some running projects.
Big Data and Diabetes Management
In the area of diabetes management, we can identify a number of applications where big data technologies can be beneficial either to improve current systems or to generate new ones.
Data Mining and Data Integration
The availability of health care data in electronic format collected by different providers and suitably reconciled, as possible in countries with national health care services, allows performing large-scale statistical studies. For example, in Khalid et al 24 the rates of hospitalization have been estimated starting from a cohort of more than 97,000 type 2 DM patients followed for 4 years, thanks to the linkage of the UK General Practice Research Database to the English Hospital Episode Statistics registry. Moreover, in Curkendall et al 25 , it has been shown that databases of health care administrative claims can be used to predict medical adherence in type 2 DM. A very interesting case study is represented by the work in Dixon et al, 11 where clinical, billing, and patient-entered data have been jointly used to assess medication adherence, a topic that is of extreme interest for clinical and public health purposes.
When analyzing very large long-term monitoring data, novel data analysis methods need to be designed, 26 including both exploratory 27 and prediction tools. 28 This area promises strong developments in the upcoming years.
Home Monitoring and Distributed Data Management
One of the most important aspects of the big data revolution is related to the need of distributing data processing. The goal is to “move” data analysis close to the site where the data are generated, since the data are too cumbersome to be jointly analyzed. This is the case of home monitoring, where data processing and knowledge-based data compression may be essential to provide sustainable telemedicine services, in which clinical systems, including clinicians and case managers, are not overwhelmed by the amount of data generated and transmitted. 29 The artificial pancreas (AP) projects have already shown the need of advanced IT architecture relying on agent-based technologies able to distribute data storage and computing.30,31 Furthermore, cloud-based solutions have been exploited to ensure a secure and reliable exchange of information between AP and the clinics when needed. 32 In the near future, all IT-based home monitoring systems will need to be adaptive, i.e. they will have to modify their characteristics to the changing behavior and requirements of the patients in their daily lives. 33 To this end, novel algorithms will have to be developed, able to continuously assess the patients’ conditions 34 and to properly configure the system and its communication behavior accordingly.
Monitoring Behavior and Environment—Toward a Holistic Approach
The joint availability of wearable monitoring devices, wireless telecommunication, algorithms, and tools able to manage big data opens the possibility of obtaining a holistic view of the diabetic patients’ conditions. The geo-referencing of the information provides the possibility of understanding the role of the environment, in its broadest sense, in the progression of the disease.35,36 The capability of interpreting the data, including in particular continuous glucose monitoring data, taking into account the context of measurement and the patient’s behavior may provide a clear boost in the understanding of the disease and in the improvement of therapy planning. In this area, a first noteworthy application has been presented in Wendel and Heintzman, 37 where data from an insulin pump, a continuous glucose monitor, and a wearable device with GPS and a monitor of heart rate, speed, pace, and elevation were integrated with open sources databases for geo-localization to provide a full visualization of the phenomena occurring to diabetes patients during exercise.
In the following we will describe the main features of a project called Mosaic (Models and Simulation Techniques for Discovering Diabetes Influence Factors), funded by the EU, designed to integrate big data sources, including environmental ones, to provide decision support in diabetes management.
An Example: The MOSAIC Project
MOSAIC is an EU-funded project aimed at providing an innovative approach for the diagnosis and the follow-up of the chronic diabetic population, to improve the characterization of patients and to help in evaluating the risk of developing type 2 DM related complications. Within the project, 10 clinical and technical partners, from 5 European countries, actively collaborate to reach this common goal, which has been designed on several steps:
Define a new “model-based” strategy to better predict type 2 DM
Define novel methods for assessing the risk of diabetes complications
Integrate models in current decision support systems
Multiple databases from hospitals, local health care agencies, and population studies represent the project pillars. Such databases, once integrated, have been used as the basis for the modeling activities. For this reason, MOSAIC represents an interesting case where a big data oriented approach may be profitable.
Considering the data gathered at the IRCCS Fondazione S. Maugeri hospital (FSM) in Pavia, Italy, one of the partners included in the project, the records of about 2.000 patients have been retrospectively collected along 10 years from 3 sources:
The Data Warehouse of the Pavia Local Health care Agency, containing the administrative (billing) health care information of all citizens of the Pavia area. Such data encompass hospitalizations (DRG codes, ICD9/CM codes, time stamp and duration), drugs purchases (ATC codes, defined daily doses, amount, time stamp), and outpatient encounters (time stamp, regional codes).
The EMR of the FSM diabetes unit. In this case comprehensive clinical information is available (from laboratory tests results to lifestyle information, from complications to screening visits). Such data are related to periodic follow-up visits or to hospitalizations at FSM.
The environmental data available from the Regional Environmental Protection Agency (ARPA) and the data of the satellite Landsat 8 (http://landsat.usgs.gov/) of northern Italy. Such data enable to evaluate the pollution of the air as well as the temperature of the different cities in the Pavia area.
The data are characterized by moderate volume, high variety, and low variability. A total of 183,405 data records concerning more than 20,000 concepts have been collected so far, coming from about 5,000 visits. Such data have been gathered relying on one of the state-of-the-art open source tools available to collect multidimensional data from different sources: the Informatics for Integrating Biology and the Bedside (i2b2) Data Warehouse (DW). 38 Within the MOSAIC project, the i2b2 framework has been implemented to aggregate the data repositories in a unique data model. i2b2 gives the possibility to store multidimensional data in a star relational database and provides a query tool interface to extract sets of interesting patients relying on a hierarchical structure of the query concepts. 39
Once multiple streams of data are integrated, the goal is to build the most complete and tailored patients’ histories, to derive risk profiles specific for the single clinical center.
The joint use of clinical and administrative data sources gives the opportunity of mapping and comparing events occurring at the same time but from different points of view. For example, if on one hand it is possible to describe acute events, routine processes (like follow up visits) and therapy plans from clinical data flows and interactions with specialists, on the other hand administrative data streams supply corresponding information about hospitalizations, outpatient services and actual drug purchases, which take place outside the hospital.
Risk stratification in the MOSAIC project is based on the combination of standard risk calculators 40 and temporal and process mining techniques. The latter methods are useful to automatically detect and reconstruct the most frequent clinical temporal pathways patients underwent. 41 The identification of patients with similar care histories allows deriving clusters of temporal trajectories and reassess risk profiles on this basis. Moreover, the inclusion in the model of the stages of disease evolution, depicted as cumulative adverse events (ie, complications and related hospitalizations), allows forecasting how the care process may evolve and identifying the best diagnostic and treatment pathways for a certain population.
The last step in the risk stratification process regards the detection of behavioral patterns as population markers. In particular, the data coming from the local health care agency can be used to stratify the population on the basis of subjects’ purchasing attitude. According to these behaviors, it is possible to extract well-defined groups of patients that follow specific patterns of therapy adherence and discontinuation. Merging these findings with clinical values seems a promising method to highlight individuals at high risk of complications. This extensive approach is one of the main features of the project, where variety aspects are emphasized by the exploitation of administrative data to identify patterns able to explain clinical conditions.
To allow the data analytics capability described above, big data technologies have been successfully applied. Figure 1 presents the technological components in the MOSAIC system. These are the following:
The Dashboard. This component allows the interaction between end users and the whole system. This interaction allows stratifying the chronic population and showing the results of the Temporal and Process Mining Algorithm performed on the selected subset.
The i2b2 DW. As already mentioned, this component collects and merges heterogeneous data coming from the hospital EMR for diabetic patients, administrative data from the local health care agency and environmental data from regional databases.
The Query Engine. This is a big data oriented Java back-end service that provides a logical layer between the user and the data. It is a back-end query module that retrieves data from the i2b2 DW and uses services exposed by the Data Mining Module to send data back to the Dashboard in an asynchronous way. To enable fast queries on large amounts of data it also relies on a big-data oriented no-SQL database called Mongo-DB, which stores partial data and previous results as JSON documents.
The Data Mining Module. This module implements the analytics algorithms through which it is possible to retrieve meaningful patterns in patients’ follow-up and the distribution of diabetes-related complications in specific groups. In particular, for each patient group selected by the user, it will be possible to analyze the most frequent patterns in terms of hospitalizations, visits, drug purchases, cardiovascular risk and disease evolution stages.
The Temporal Abstraction module. This specialized data analytics module takes as input raw quantitative data stored in the i2b2 DW, extracts a set of temporal patterns in which a certain condition on the data holds (eg, an increasing trend in HbA1c) and stores them in the DW. This module is used during the population and the update of the i2b2 DW.
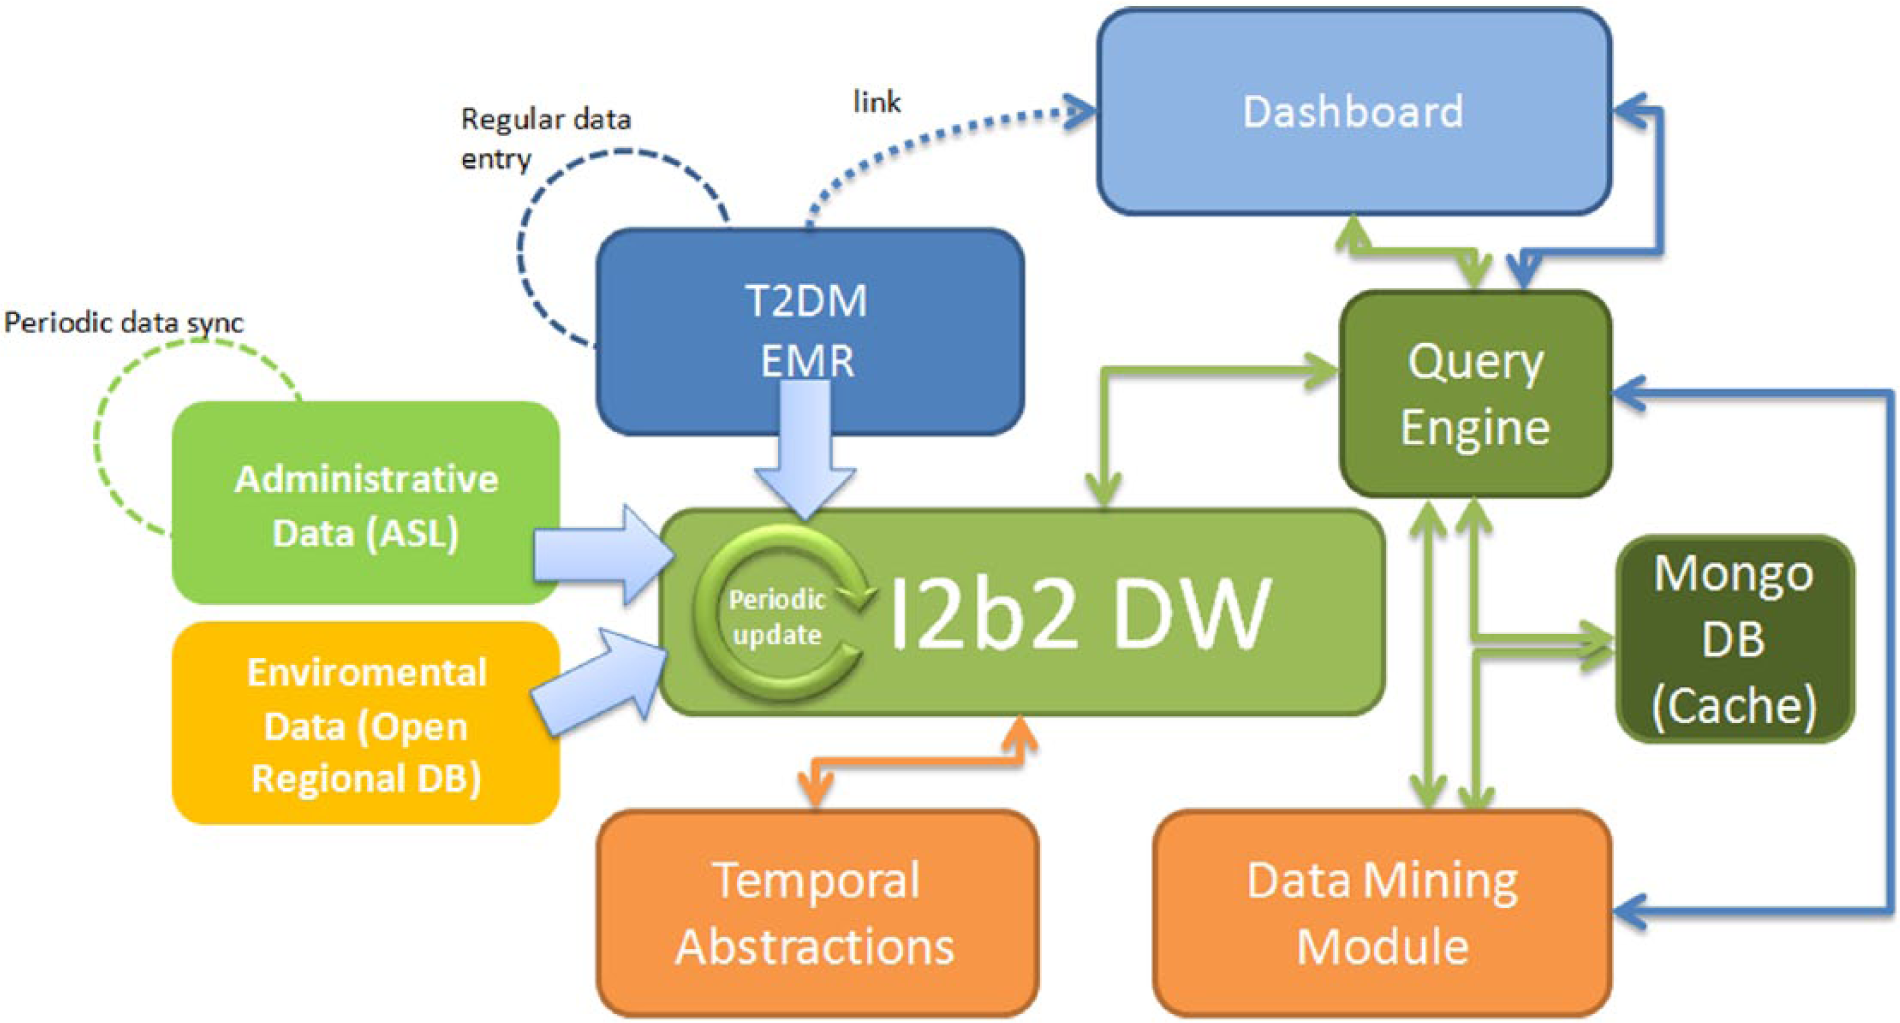
The IT architecture of the MOSAIC project implemented at the IRCCS Fondazione S. Maugeri Hospital, Pavia.
At the present level of implementation, a synchronization process, with a monthly schedule, has been developed to keep the i2b2 DW updated. During this process, the patterns coming from the Temporal Abstractions module are stored in the i2b2 DW together with the raw data used as input. Using the drill down approach within the dashboard, it is possible to view the evolution of the temporal patterns already processed by the Data Mining module on demand: once the system user selects the patient set of interest, the query engine retrieves from the i2b2 DW the necessary information, then the Data Mining module is invoked to perform the Temporal Data Mining analysis before returning the control to the dashboard to display the processed data. In practice, the MOSAIC architecture is already available for a routine use to obtain statistics on the diabetes center and to compute patient-tailored risk indexes.
In addition to temporal clinical features, the MOSAIC data set includes geo-referenced clinical data; thanks to administrative data streams each patient is associated with a precise municipality code, so that it is possible to geographically locate each subject. In particular, geo-referenced clinical data have been exploited to study the effects of being exposed with air pollutants thanks to air quality maps acquired from remotely sensed data. The joint analysis of air quality maps and geo-localized clinical events gave the possibility to observe multiple patterns varying over time. At the current stage of the project, correlations between hospitalizations and changes in the air quality have been observed. Such correlations are now under further investigation by increasing the data set and considering also other retrospective air pollution data. This environmental data will be integrated in the i2b2 DW during the forthcoming activities of the MOSAIC project.
Discussion and Conclusions
Data integration projects, such as MOSAIC, give the opportunity of looking at health care processes from novel perspectives, emphasizing temporal patterns of care and taking into account more properly the “contextual” information, such as environmental data, which has often a key impact on disease progression. This is only a first step toward a big data enabled diabetes management strategy. As a matter of fact, diabetes technologies, from novel glucose sensors to metabolic monitoring, from AP to telemedicine, can be easily seen, in a big data perspective, both as data generators and as data processors. It will be therefore crucial to exploit such technologies to increase the capability of intelligently coordinate the data flows and distribute computing and analytics. This will require building computational strategies that move computation “closer” to the data, that is, close to the site or the device that collects the information, and that will properly compress, filter, and summarize the gathered information. Moreover, existing clinical protocols, guidelines, and best practices will have to be modularly represented in chunks of knowledge ready to be used “at the point of care”, to orchestrate data processing and data management for the benefit of every single patient.
Of course, big data collections hold the promise of extracting new evidence to better understand the disease and to discover new knowledge. The large number of data that can be gathered and integrated may pinpoint unobserved factors or highlight multifaceted aspects, which can be of great interest in health care, in general, and in diabetes and chronic care management, in particular. However, big data will enable to collect observational, “nonexperimental” information. The potential biases and confounding factors hidden in the data will have to be carefully taken into account. 23
As it is often happening in the present times, when also media play an important role in emphasizing the importance of new concepts and ideas and thus in creating public expectations (that often reflect in research funding strategies), the attitude toward big data may be overenthusiastic or too skeptical. The reality is that the technology for managing data has consistently grown together with the capability of collecting them. It is now time for the development of new methods, tools, and architectures that may help to fully exploit the opportunity that the data deluge is providing to us.
Footnotes
Acknowledgements
We gratefully acknowledge the Mosaic Consortium for their work and support.
Abbreviations
AP, artificial pancreas; ARPA, Regional Environmental Protection Agency; ATC, anatomic, therapeutic, chemical classification of drugs; BD2K, Big Data to Knowledge; DB, database; DBGAP, database of genotypes and phenotypes; DM, diabetes mellitus; DRG, diagnostic-related groups; DW, Data Warehouse; EHR, electronic health record; eMERGE, Electronic Medical Records and Genomics; EMR, electronic medical record; EU, European Union; FSM, Fondazione Salvatore Maugeri; GPS, Global Positioning System; I2b2, Integrating Biology and the Bedside; ICD9/CM, International Classification of Diseases, 9th version, Clinical Modifications; IRCCS, Istituto di Ricovero e Cura di Carattere Scientifico; IT, information technology; JSON, JavaScript; MOSAIC, Models and Simulation Techniques for Discovering Diabetes Influence Factors; NIH, National Institutes of Health; NO-SQL, not only standard query language; OHDSI, Observational Health Data Sciences and Informatics; PCORI, Patient-Centered Outcomes Research Institute; TCGA, Cancer Genome Atlas; UK, United Kingdom.
Declaration of Conflicting Interests
The author(s) declared the following potential conflicts of interest with respect to the research, authorship, and/or publication of this article: RB and DS hold shares of the company Biomeris, involved as software provider in the Mosaic project.
Funding
The author(s) disclosed receipt of the following financial support for the research, authorship, and/or publication of this article: The work was supported by the European Commission Grant 600914—Mosaic, Models and Simulation Techniques for Discovering Diabetes Influence Factors.