
Abstract
Background:
The role of blood glucose (BG) measurement frequency on the domains of glycemic control is not well defined.
Methods:
This Monte Carlo mathematical simulation of glycemic control in a cohort of critically ill patients modeled sets of 100 patients with simulated BG-measuring devices having 5 levels of measurement imprecision, using 2 published insulin infusion protocols, for 200 hours, with 3 different BG-measurement intervals—15 minutes (Q15’), 1 hour (Q1h), and 2 hours (Q2h)—resulting in 1 100 000 BG measurements for 3000 simulated patients. The model varied insulin sensitivity, initial BG value and rate of gluconeogenesis. The primary outcomes included rates of hyperglycemia (BG > 180 mg/dL), hypoglycemia (BG < 70 and 40 mg/dL), proportion of patients with elevated glucose variability (within-patient coefficient of variation [CV] > 20%), and time in range (BG ranges 80-150 mg/dL and 80-180 mg/dL).
Results:
Percentages of hyperglycemia, hypoglycemia at both thresholds, and patients with elevated glucose variability as well as time outside glycemic targets were substantially higher in simulations with measurement interval Q2h compared to those with measurement interval Q1h and moderately higher in simulations with Q1h than in those with Q15’. Higher measurement frequency mitigated the deleterious effect of high measurement imprecision, defined as CV ≥ 15%.
Conclusions:
This Monte Carlo simulation suggests that glycemic control in critically ill patients is more optimal with a BG measurement interval no longer than 1h, with further benefit obtained with use of measurement interval of 15’. These findings have important implications for the development of glycemic control standards.
Keywords
The divergent results of the trials of intensive insulin therapy (IIT) conducted in various populations of critically ill patients1-6 may have been due, in part, to issues relating to blood glucose (BG) monitoring. Analytic inaccuracies associated with meter-based technologies, used in some studies, have been well described;7-9 other authors have described strengths and limitations of blood gas analyzers used for BG monitoring in the critically ill.10-14 Low frequency of BG monitoring undoubtedly also contributed to the lower than expected BG “time in range” and to the observed high rates of hypoglycemia, which are independently associated with increased risk of mortality in each of 2 randomized controlled trials (RCTs)15,16 and several large observational cohort studies.17-20 The protocols used in the trials of IIT mandated BG measurement every 1-4 hours, time intervals certainly long enough to have been associated with unrecognized (“missed”) excursions into the hyperglycemic as well as hypoglycemic range. 21 In addition, this frequency of BG monitoring may be associated with the development of increased BG variability, a “domain” of glycemic control not contemplated in the design of the trials of IIT, but subsequently shown to be independently associated with mortality in RCTs 15 as well as in several large observational cohort studies.22-25 In fact, a recently published international cohort investigation involving 9 centers and 23 different ICUs reported BG measurement intervals ranging from 2.6 to 8.6 hours, 26 reflecting the reality that intermittent monitoring imposes a heavy work burden on the nursing staff as well as the risk of exacerbating blood loss anemia. 27
A new generation of continuous or near-continuous BG monitors is under development to overcome the limitations imposed by current technologies. 28 An expert committee convened at the 2012 congress of the International Society of Intensive Care and Emergency Medicine advised that the analytic precision of new monitors may need to approach that of arterial blood gas analyzers. 29 A second expert committee convened at the 2013 congress, however, suggested that the trend of near continuous monitors may be more important than point accuracy. 30
Previously published simulation studies 31 have modeled the effect of BG measurement error on the ability to control glycemia, using the published Yale and University of Washington protocols as examples.32-34 These studies 31 demonstrated deleterious effects of BG measurement error on glycemic control. The conclusions of the study have been confirmed 35 in 2 very recent studies that used 2 independently developed models based on patient data from ICUs.36,37
We hypothesize that increased frequency of BG measurements may effect improvement in hyperglycemia, hypoglycemia, and BG variability—as well as a fourth domain of glycemic control, time in targeted BG range—even using technology with worse levels of measurement imprecision than seen with arterial blood gas analyzers. To test our hypothesis we have performed simulation modeling comparing the effect of BG measurement intervals of every 15 minutes (Q15’), 1 hour (Q1h), and 2 hours (Q2h) at varying degrees of analytical imprecision (expressed as coefficient of variation [CV]), as well as varying levels of insulin sensitivity, on metrics of glycemia.
Methods
This investigation is a Monte Carlo simulation38,39 of 100 modeled patients for each selected level of modeled imprecision (CV) and frequency of glucose measurement. Each modeled patient was followed for 200 hours. We varied the following parameters in the simulation.
Conditions Applied During the Simulation
Insulin was administered via continuous intravenous infusion, with hourly changes in infusion rate determined by the treatment protocol in use. Neither insulin dosing protocol allows for bolus dosing of insulin, in accord with US standard of care. The model did not use bolus glucose injections except for treatment of hypoglycemic episodes as dictated by the treatment protocols.
In the simulations using the Q15’ measurement interval the 4 values preceding the insulin dosing change were used to derive the estimate of the true BG at the end of the hour by regression analysis.
The hourly increase in BG from gluconeogenesis (see below) was offset by an hourly decrease of BG determined by the insulin sensitivity multiplied by the insulin dose as calculated from the insulin infusion rate during the hour (see the equations in the online supplemental materials).
Hypoglycemia was treated with bolus glucose infusion per guidelines of the protocol in use. We calculated the BG increment resulting from intravenous administration of 12.5 g glucose in 50% glucose solution (D50) by assuming an average volume of distribution of 7.25 liters, and an average increment per 5 g glucose = 56.4 mg/dL. 40
Parameters Varied in the Simulation
Insulin Infusion Protocols
Insulin infusion was guided by 2 different published protocols for BG treatment.33,34 The Yale protocol has a BG target of 100-140 mg/dL;32,33 the University of Washington protocol has a BG target of 80-180 mg/dL.32,34 The model modifies the 2 protocols by considering only hourly adjustment of insulin infusion when BG is measured hourly or more frequently, whereas both protocols allow longer measurement interval if BG control is considered stable. For simulations in which BG is measured every 2 hours, insulin infusion rates are reevaluated, and adjusted if needed, every 2 hours.
Measurement Intervals
We assessed 3 BG measurement intervals—every 15 minutes, 1 hour, and 2 hours.
Imprecision and Bias
Measurement bias was held at zero, and measurement imprecisions (expressed as percentage CVs) were 0%, 5%, 10%, 15%, and 20%. We used the BG measurements to determine the next insulin dosage hourly according the treatment protocol being used.
Initial BG Value
We based the initial BG simulated in each patient on a mixed Gaussian distribution, with median initial BG 171 mg/dL, to provide a distribution of initial BG values that is similar to that observed in a recent publication describing glycemic characteristics of an heterogeneous cohort of critically ill patients (see the online supplemental materials for the equations). 41
Insulin Sensitivity
For each patient, we randomly set the initial insulin sensitivity to a glucose responsivity of between 10 and 32 mg/dL per hour per unit of insulin administered. We increased insulin sensitivity every 24 hours by a random increment (from 0 to 5 mg/dl per hour per unit of insulin) that remained constant for a given patient during the first 96 hours, and then maintained insulin sensitivity at the level reached at 96 hours for the remainder of the 200-hour simulation trial. Increases in insulin sensitivity have been observed in critically ill patients responding appropriately to therapy. 42
Gluconeogenesis and Exogenous Glucose Administration
We increased BG for an individual patient hourly by a randomly selected normally distributed increment of 30 ± 10 mg/dL (mean ± SD) to approximate the contribution of gluconeogenesis, glycogenolysis, exogenous glucose administration, and the action of endogenous insulin secretion. The increment was offset each hour by the glucose-lowering effect of insulin infusion (see the online supplemental materials for the equations). 40
These permutations resulted in a total of 5 analytic conditions (5 separate CVs, all with zero bias), each modeled in a set of 100 patients. Each of these 500 simulations was assessed using 3 different testing intervals and 2 treatment protocols, yielding 3000 separate simulated patients, modeled over 200 hours, resulting in 1 100 000 BG measurements for the entire simulation.
Glucose Metrics
We tracked the true BG concentration for each patient hourly, and used this information to tally the frequencies or percentages of results in the following categories: Hypoglycemia
<40 mg/dL
<70 mg/dL
Hyperglycemia
>180 mg/dL
Glucose variability
percentage of patients having glycemic variability (expressed as CV) > 20%
Time in range
between 80 and 150 mg/dL
between 80 and 180 mg/dL
Because this study used a mathematical model that did not include human subjects, there was no need to obtain informed consent.
Results
Hypoglycemia
Figures 1a-b display the effects of measurement imprecision and measurement interval on the frequency of severe hypoglycemia, defined as BG < 40 mg/dL, occurring during the simulations for the 2 protocols. Severe hypoglycemia was uncommon, especially with CV 0%, 5%, and 10%, reflecting low measurement imprecision. The occurrence of any hypoglycemia, defined as BG < 70 mg/dL, increased substantially with higher measurement imprecision (CV ≥ 15%), as detailed in Figures 2a-b. Measurement frequency impacted these relationships. There was a modest increase in hypoglycemic events at both thresholds comparing Q15’ and Q1h and a larger increase in hypoglycemic events comparing Q1h and Q2h measurement intervals.
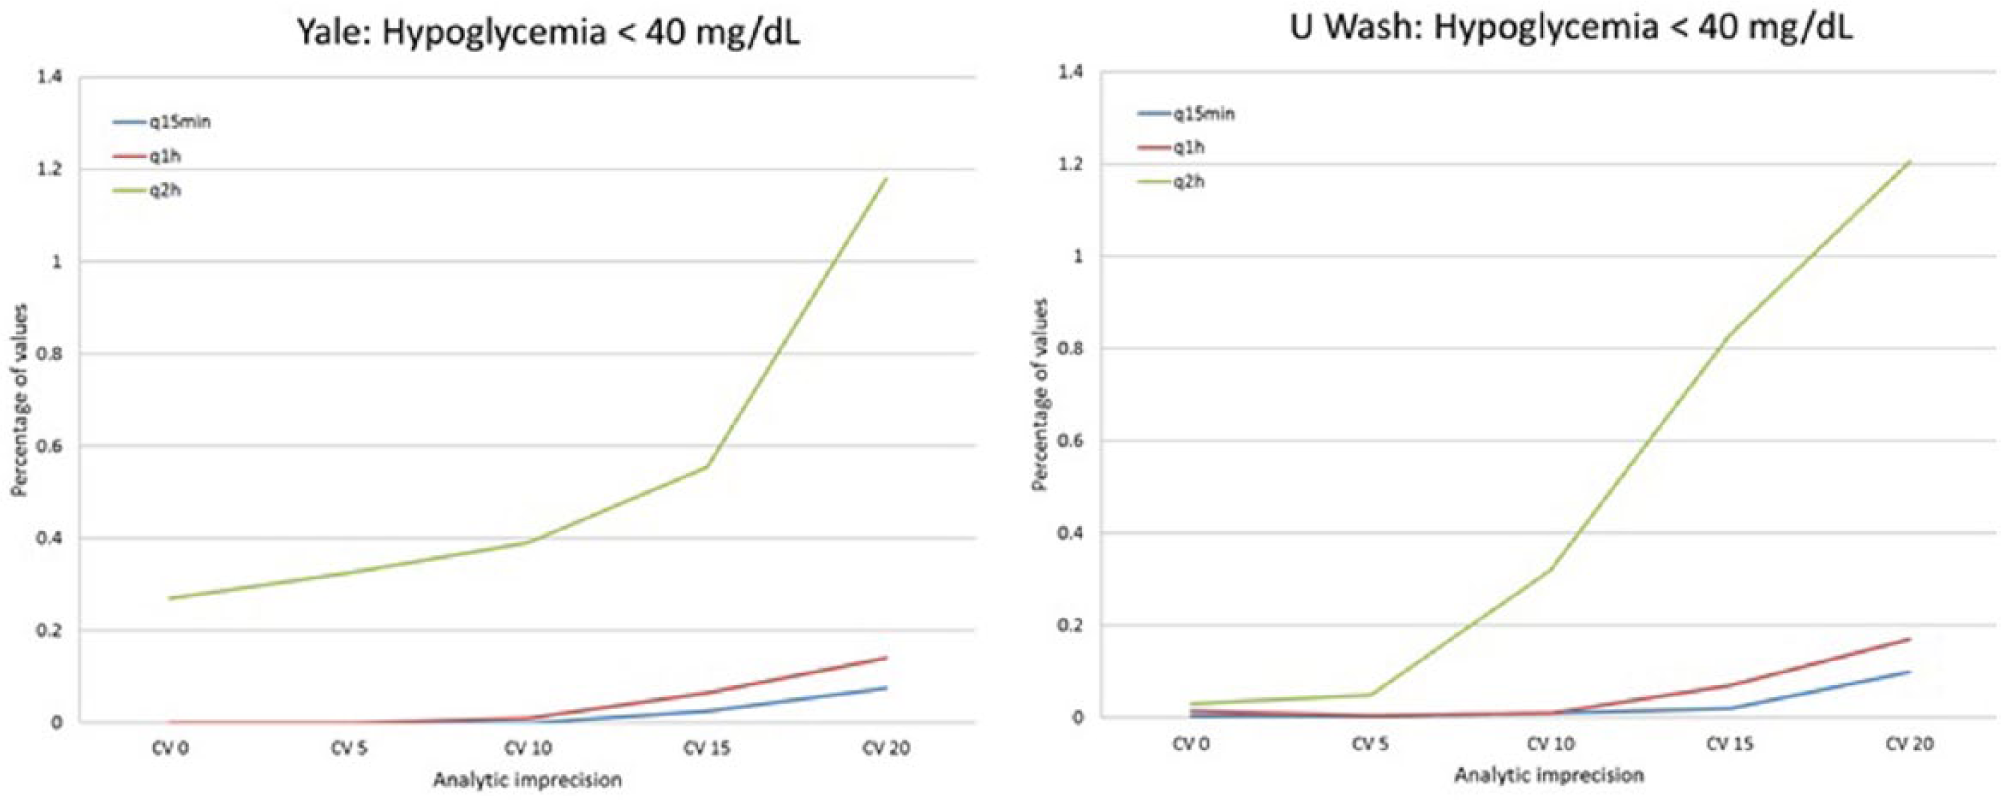
Percentage of values with BG < 40 mg/dL, at varying levels of analytic imprecision, 0 bias, and 3 different measurement intervals, Yale model, University of Washington model.
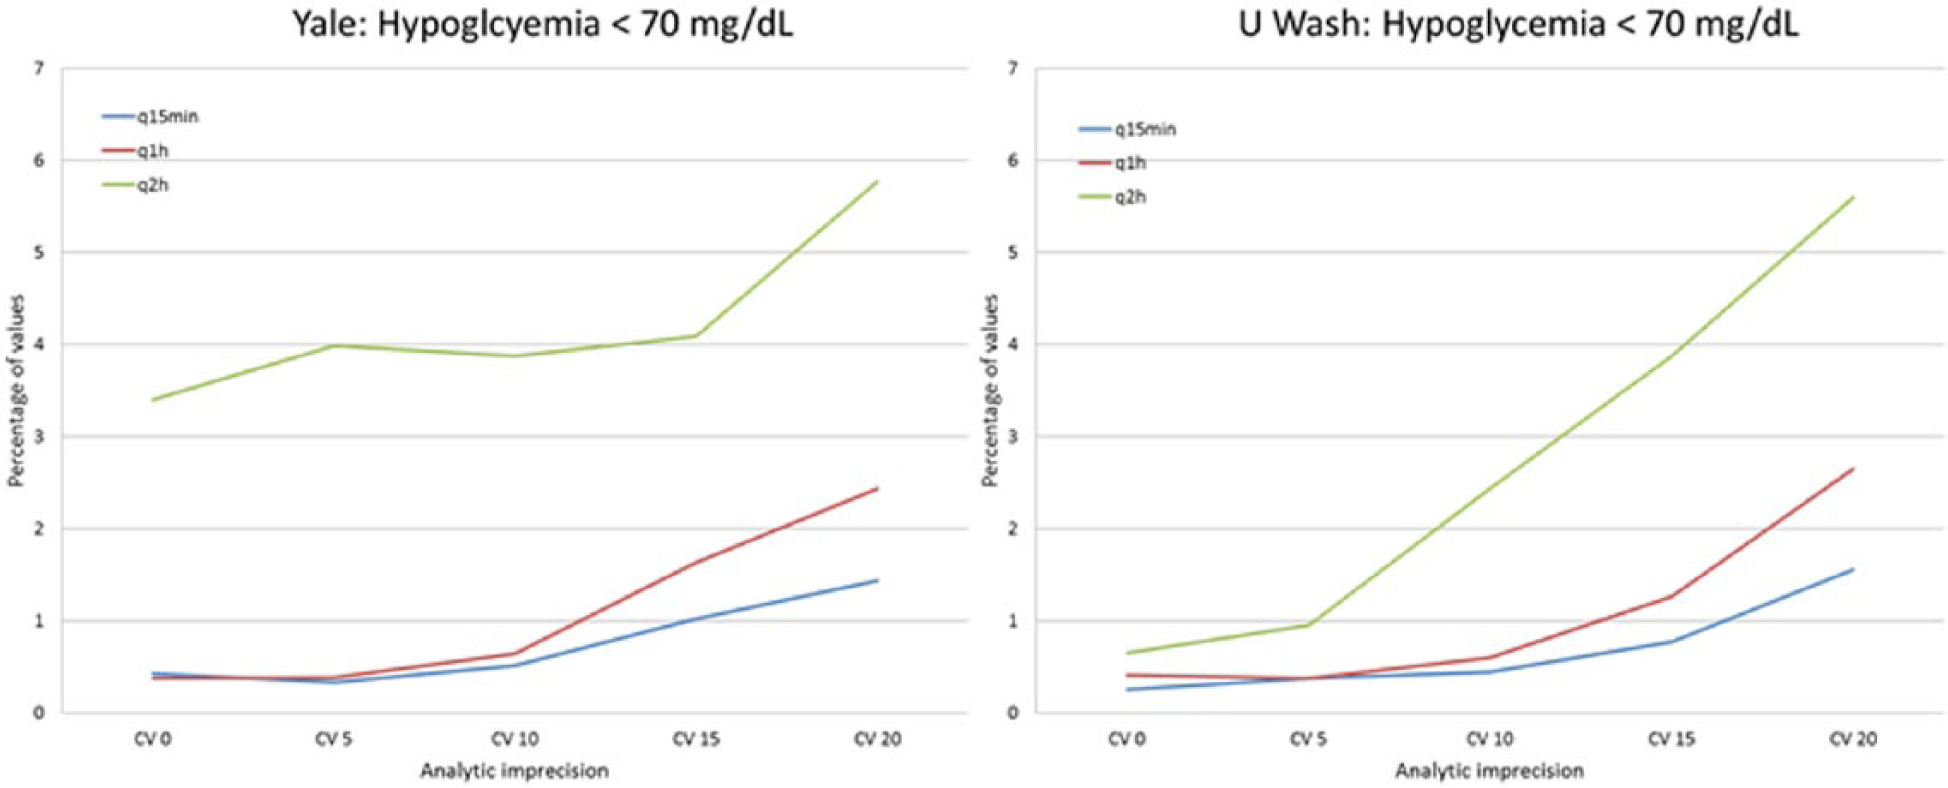
Percentage of values with BG < 70 mg/dL, at varying levels of analytic imprecision, 0 bias, and 3 different measurement intervals, Yale model, University of Washington model.
Hyperglycemia
Figures 3a-b display the effects of measurement imprecision and measurement interval on the frequency of hyperglycemia, defined as BG > 180 mg/dL, occurring during the simulations for the 2 protocols. There was a nonlinear relationship of measurement imprecision to hyperglycemia for both protocols, with modest increases in hyperglycemia as CV increased from 0% to 10%, but substantially higher frequencies for models using CV > 10%. Measurement interval impacted these outcomes. The frequency of hyperglycemia was similar for measurement intervals of Q15’ and Q1h in models using low measurement imprecision, but higher in models using Q1h measurement with CV > 10%. In contrast, further increase in measurement interval to Q2h led to substantially higher rates of hyperglycemia at all levels of measurement imprecision, especially with CV ≥ 15%.
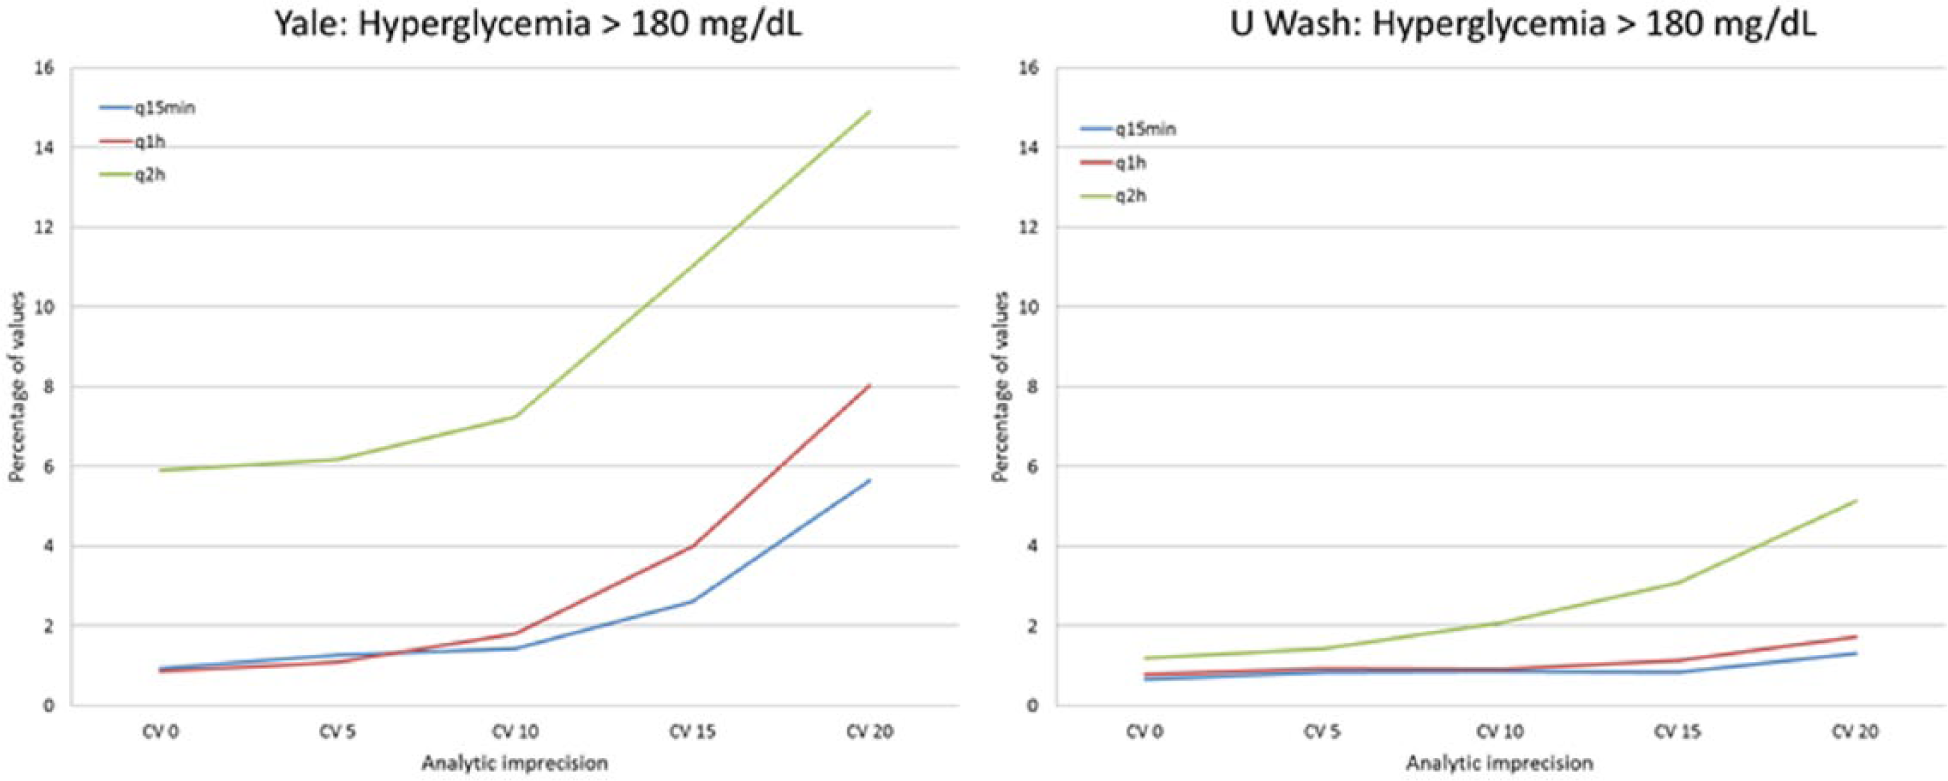
Percentage of values with BG > 180 mg/dL, at varying levels of analytic imprecision, 0 bias, and 3 different measurement intervals, Yale model, University of Washington model.
Glucose Variability
Figures 4a-b display the effects of measurement imprecision and measurement interval on the frequency of high glucose variability, defined as the percentage of patients in whom glycemic variability had a CV > 20%. Neither protocol effectively prevented high glucose variability with measurement Q2h; this was especially notable using the Yale protocol. The occurrence of high glucose variability was similar comparing measurement intervals of Q15’ and Q1h at conditions of low measurement imprecision, but with high measurement imprecision, high glucose variability was considerably more frequent using a measurement interval of Q1h compared to when using a measurement interval of Q15’.
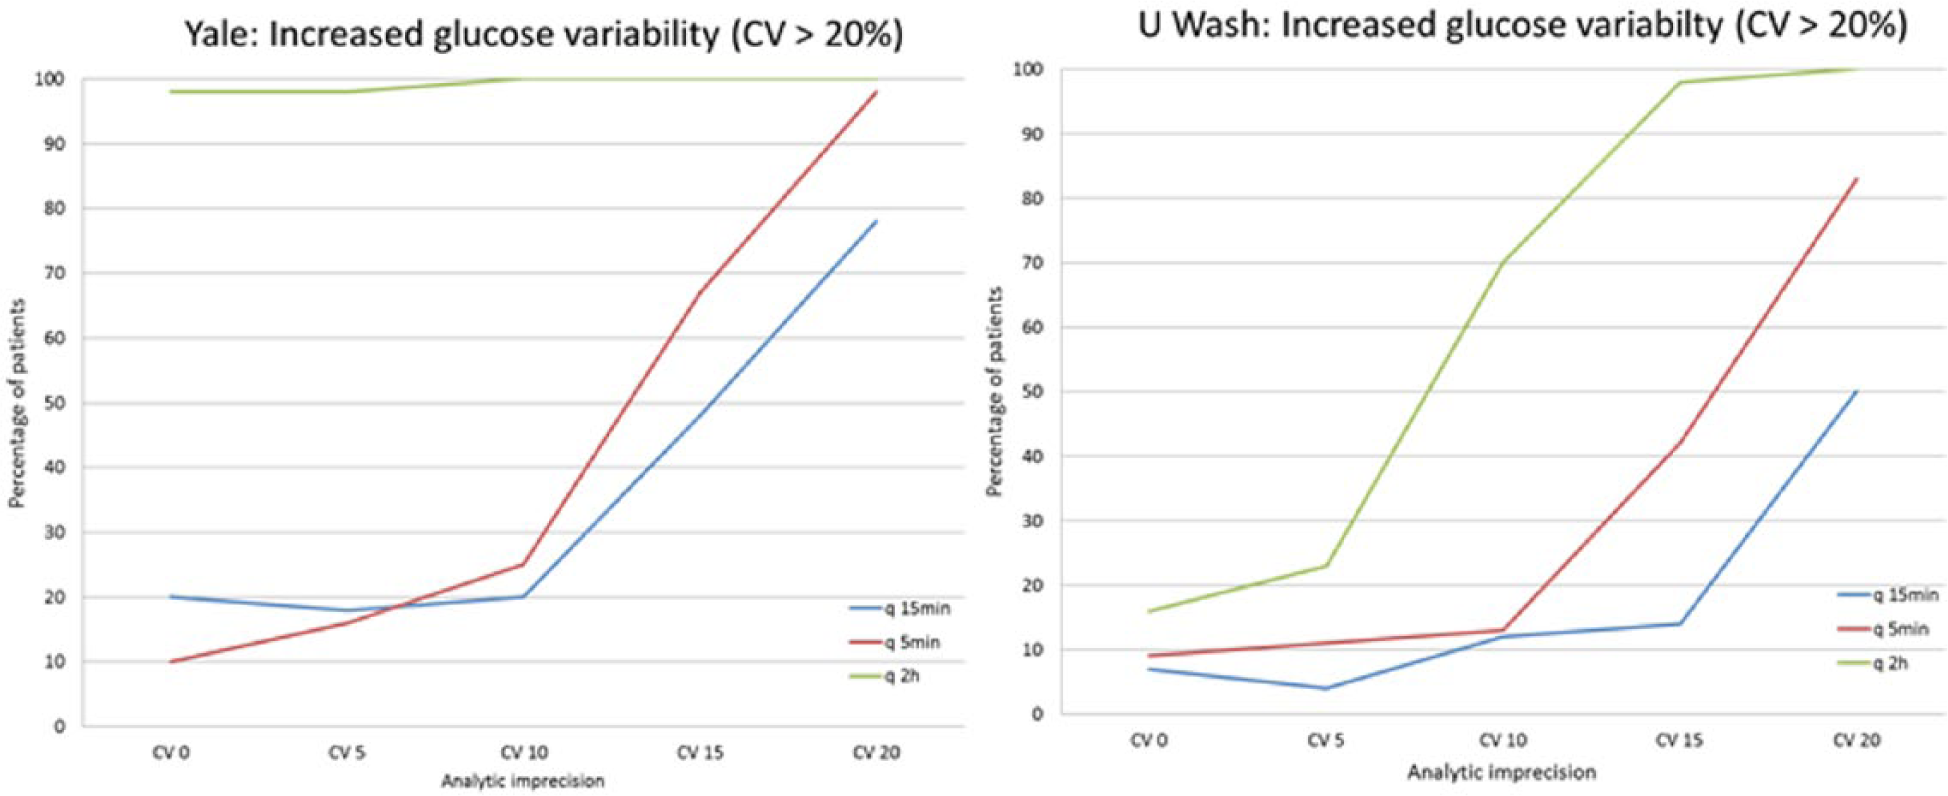
Percentage of patients with increased glucose variability, defined as per patient CV > 20%, at varying levels of analytic imprecision, 0 bias, and 3 different measurement intervals, Yale model, University of Washington model.
Increasing glycemic variability was seen as measurement CV increased. This fundamental relationship was not changed by altering the time interval between glucose measurements.
Time in Range
Figures 5a-d display the effects of measurement imprecision and measurement interval on the percentage of glucose values within 2 target intervals, 80-150 mg/dL and 80-180 mg/dL. There was a nonlinear relationship of measurement imprecision to percentage of values in both ranges for both protocols, with modest increases in frequencies of values outside of range as CV increased from 0% to 10%, but substantially higher frequencies for models using CV ≥ 15%. Measurement interval impacted these outcomes; while there was only a modest decrease in percentage of values in range comparing Q15’ to Q1r, the Q2h simulations led to substantially reduced percentages of values in range.
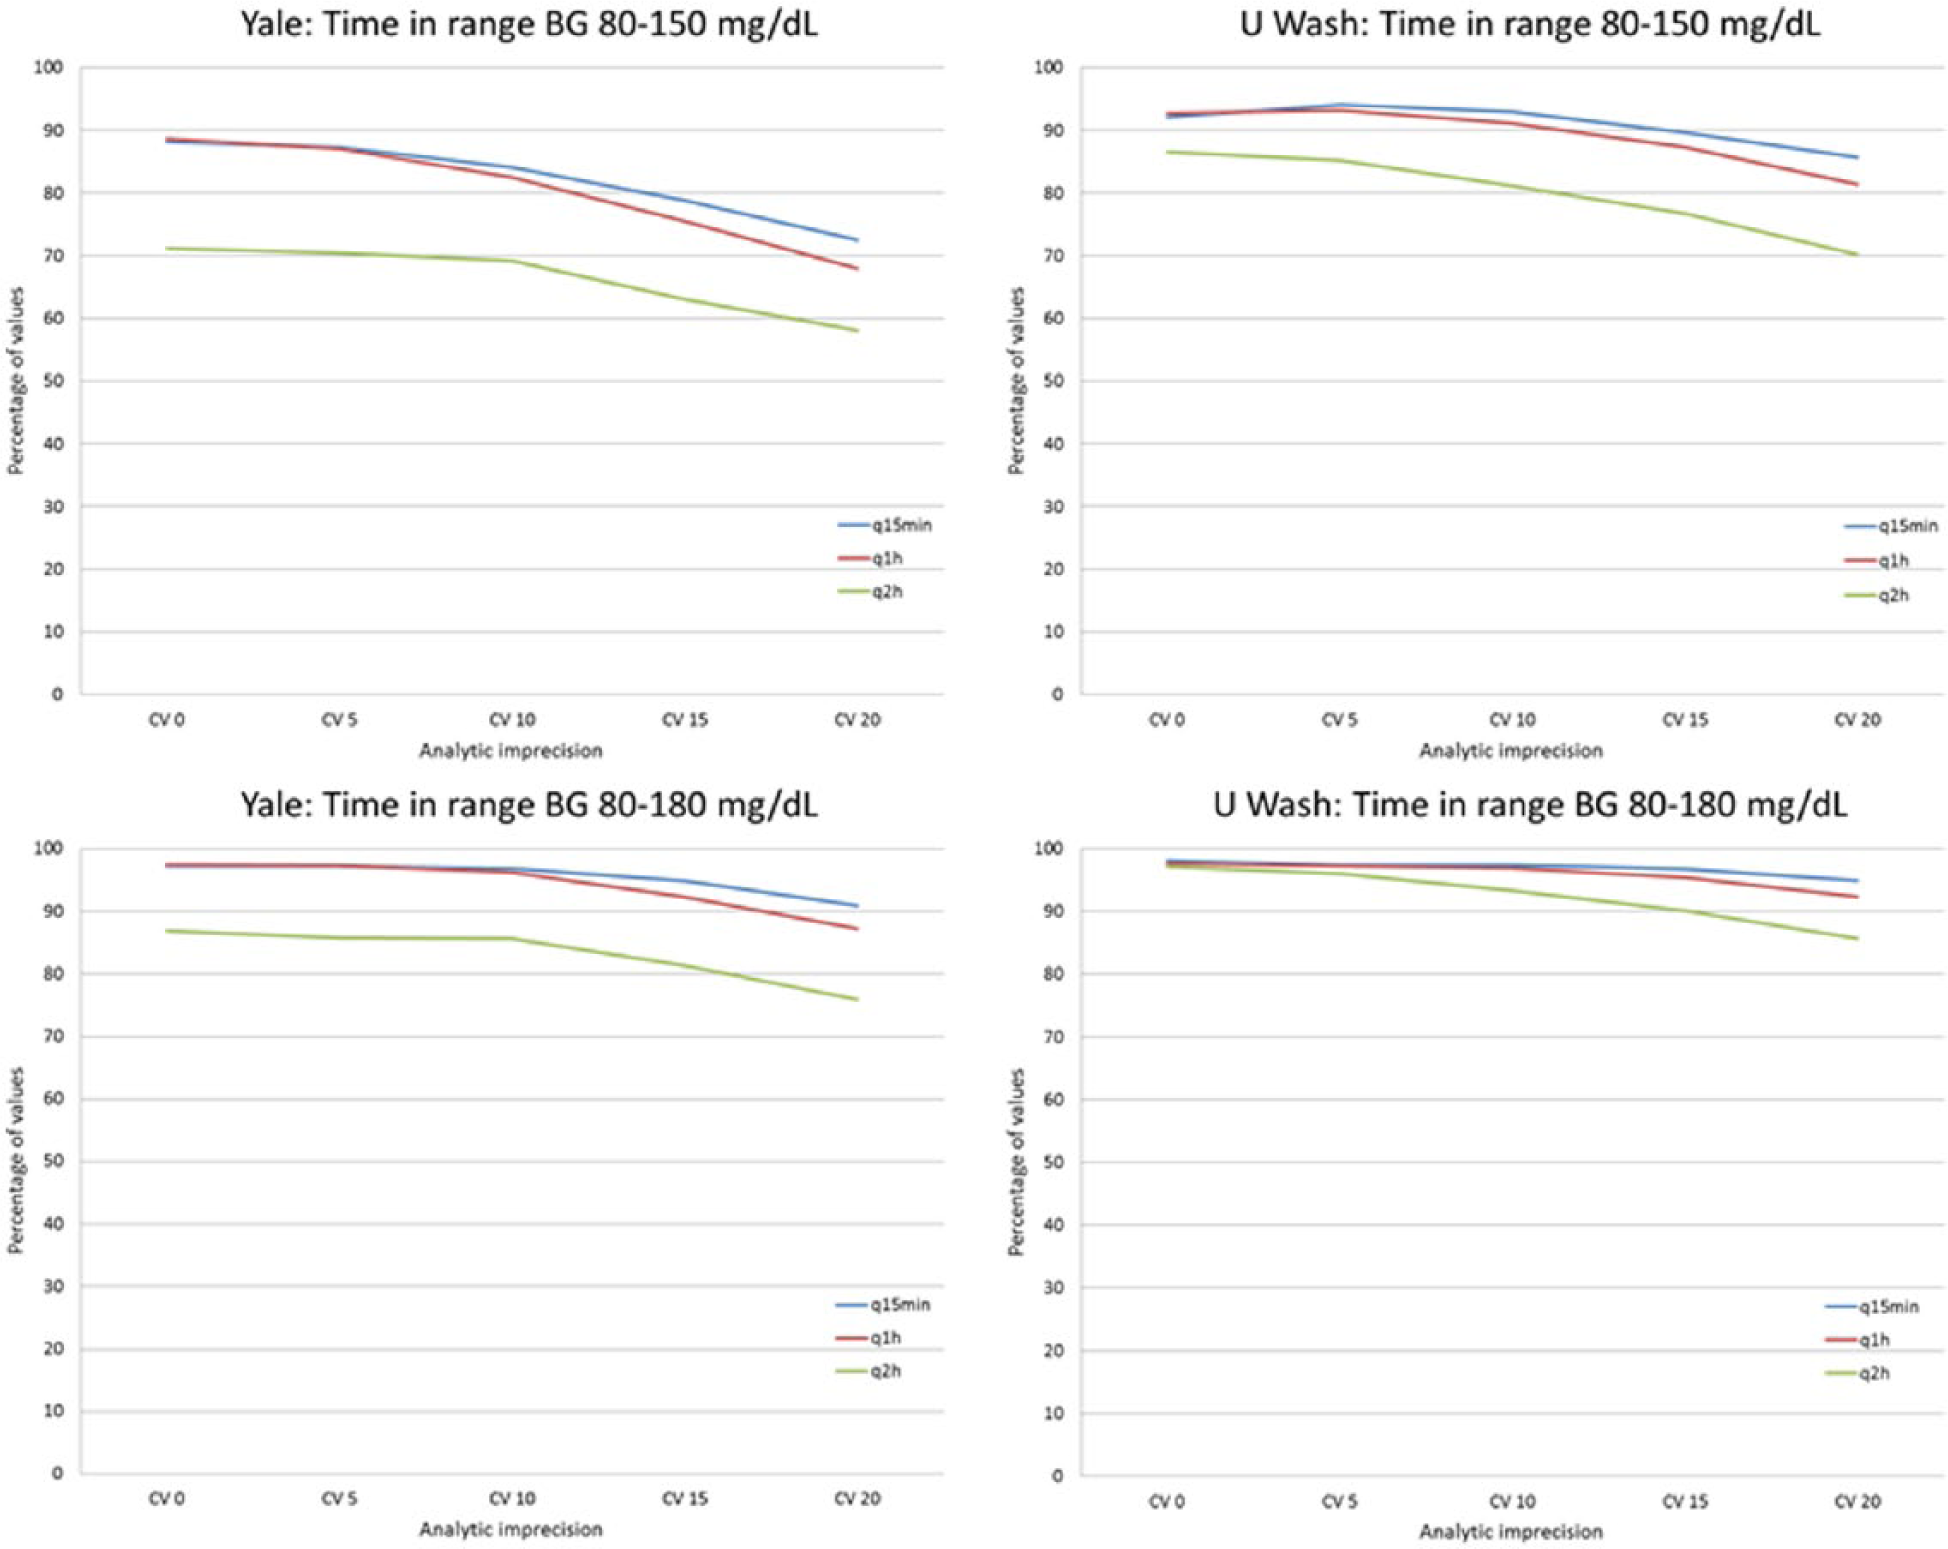
Percentage of values with BG 80-150 mg/dL and 80-180 mg/dL, at varying levels of analytic imprecision, 0 bias, and 3 different measurement intervals, Yale model, University of Washington model.
Discussion
Salient Findings
This robust Monte Carlo simulation, which included 1 100 000 BG values, modeled the impact of different BG measurement intervals on the occurrence of hypoglycemia, hyperglycemia, glucose variability and time in a range. The salient finding of this investigation is that increasing measurement frequency had a substantial impact on all 4 domains of glycemic control. The differences between Q15’ and Q1h measurement intervals were modest, with the shorter measurement interval consistently producing superior results for all 4 domains of control. However, further increases in measurement interval to Q2h resulted in marked deterioration in all 4 domains of control. Moreover, use of smaller measurement intervals ameliorated the deleterious effect of high measurement imprecision, defined as analytical CV ≥ 15%.
Comparison of BG Management Protocols and Comparison of Measurement Intervals
It was not the aim of this investigation to explicitly compare the performance of the Yale and University of Washington protocols. The much higher rates of hyperglycemic events with the Yale protocol were seen at high imprecision (high CVs) and at the Q2h frequency of measurement. We believe that the greater susceptibility of the Yale protocol to imprecision is predictable. The Yale protocol chooses insulin infusion rates based on differences between 2 measurements. As the difference includes errors from imprecision in both methods, compounding the effects of imprecision of the measuring system. The use of differences creates problems at the Q2h frequency for a different reason. The algorithm assumes that measurements are made hourly. Thus insulin infusion rates may be too high or too low, depending on the direction of change of BG, degrading the time in range. Note that at Q1h, when the CV is 0% or 5%, the Yale and University of Washington protocols produce similar rates of hyperglycemia (~1%) and time in range (~90%).
In addition, the incremental improvement of Q15’ versus Q1h frequency is best seen with simulations including low analytic imprecision (CV 15-20%), during which rates of hyperglycemia and hypoglycemia are often reduced in half. At low levels of analytic imprecision (CV 5-10%) the rates of hyperglycemia and hypoglycemia are not dramatically different than those seen with perfect measurement accuracy, at any measurement frequency.
Relationship to Previous Literature
Hyperglycemia during ICU stay is independently associated with mortality in numerous studies of critically ill patients,43,44 and treatment of hyperglycemia has been the subject of several randomized trials of IIT.1-6 The current investigation clearly demonstrates the impact of measurement interval on the development of hyperglycemia, with a sharp increase in hyperglycemia and a marked reduction of percentage of values in the 2 modeled BG target ranges associated with a measurement interval of Q2h compared to that seen with Q1h. Similarly, hypoglycemia during ICU stay is independently associated with risk of death, a consistent finding from RCTs15,16 and large observational cohort studies.17-20,26 In the current investigation measurement interval strongly impacted rates of hypoglycemia, with modest increases noted as measurement intervals increased from 15’ to 1h, especially in simulations with high measurement imprecision, and large increases in hypoglycemia with further increase in measurement intervals to 2h. Finally, increased glucose variability during ICU stay has been independently associated with increased risk of death in the Leuven RCTs 15 as well as in large observational cohort studies.22-26 The current investigation demonstrates that 2h BG measurement interval led to high glucose variability, defined as per-patient CV > 20%, in nearly 100% of simulations using 1 protocol, and in the majority of simulations in the other. Moreover, for this domain of glycemic control, Q15’ measurement was clearly superior to Q1h measurement.
Clinical Relevance of the Mathematical Model and Improvements From Earlier Studies
The current investigation significantly extends the findings of an earlier investigation by modifying the parameters of the mathematical model in clinically important ways. 31 First, while the earlier investigation used Q1h as the longest measurement interval, the current study extends the model to include Q2h measurements to better reflect current practice. The 2-hour interval may be the shortest interval feasible in most ICUs, given the realistic constraint of current, manual technologies. Indeed, the central conclusion that one must have 1-hour interval testing (recommended in guidelines promulgated by the Society of Critical Care Medicine 45 ) is not typically achieved in clinical practice, 26 and there is limited evidence to support its need prior to this Investigation. In addition, the earlier work modeled only a traditional continuous glucose monitor (CGM) with its 5’ interval. 46 Calibration error is a serious concern, capable of causing harm over the period of calibration of devices that use such short measurement intervals. The use of a 15’ measurement interval in this investigation models a CGM that does not require calibration. 47 Second, the current model based initial BG on a mixed Gaussian distribution to simulate the distribution of values observed in a recent publication describing glycemic characteristics of an heterogeneous cohort of critically ill patients, 40 with median initial BG 171 mg/dL, whereas the earlier study used initial BG values randomly chosen between 40-600 mg/dL; in this earlier study the median initial BG was 320 mg/dL. Third, we modeled patients for 200 hours instead of 100 hours. Fourth, the previous study used randomly assigned insulin sensitivity that remained constant throughout the patient’s course. In contrast, the present study simulated the changing insulin sensitivity observed in critically ill patients responding appropriately to insulin therapy. 41 Fifth, the current investigation defines hypoglycemia at 2 thresholds, < 40 mg/dL and < 70 mg/dL, as is done in many recent publications describing glucose metrics,16,20,29 instead of < 60 mg/dL, and adds increased glucose variability (defined as CV > 20%), consistent with recent literature. 26 Finally, the range of measurement imprecisions used in this investigation mirror those of BG measurement devices currently in clinical use, or under development.9,46-48
Limitations of the Model
The model used in this investigation has certain limitations that warrant discussion. First, the model does not include correction for sensor drift, an issue that hampers clinical application of chemistry based sensors. 46 Second, the model assesses glycemic control performance using only 2 protocols; it is possible that other insulin infusion protocols in clinical use would perform differently. Third, the model assumes perfect implementation of these 2 protocols, without the introduction of human error such as preanalytic inaccuracies, including incorrect handling of blood (for example, dilution of capillary blood from fingerstick prick, prior to insertion of the blood into a bedside glucose meter); missed readings; insulin dosing errors, including delayed measurements, found to be associated with the majority of hypoglycemic events in a large cohort of critically ill patients; 49 and other factors that degrade glycemic control performance. As such, the model’s results must be considered as “best-case” scenarios, and likely underestimate the impact of measurement frequency on the domains of glycemic control at the 2-hour and 1-hour intervals, which would be performed using manual techniques. Fourth, although our model includes an increase in insulin sensitivity occurring during the first 96 hours of the model, consistent with data from heterogeneous critical care populations, 38 we acknowledge that subsets of patients may experience changes in insulin sensitivity during critical illness different than modeled in this investigation. Finally, the model does not formally include a term for effects of endogenous insulin secretion or other hormones that alter glucose homeostasis. This limitation is offset by use of the random variable “gluconeogenesis,” which represents the net effect, during 1 hour of gluconeogenesis, glycogenolysis, glucose infusion, and endogenous hormones, including the effect of endogenous insulin. In addition, insulin sensitivity is varied as described above. Perhaps even more important, predictions of our model have been confirmed in very recent studies by others who used 2 independently developed models based on data from patients in 2 different ICUs.35-37
Implications for Clinical Practice
We acknowledge that it is impossible for any mathematical model to completely capture the complex interplay of factors, including the analytic accuracy of the glucose measurement device, the frequency of measurements, and the performance of the BG management protocol, that impact glycemic control in the clinical setting. 35 Notably, time in targeted BG range increased with the use of a computerized protocol compared to that achieved by the highly trained team using their nurse drive protocol glycemic control in the Leuven ICU 36 and the use of a computer driven insulin protocol has been demonstrated to markedly reduce hypoglycemia rates. 49
Nevertheless, we believe that this investigation modeling BG measurement frequency has important clinical implications. First, optimal control of the domains of glycemia in the critically ill—minimizing hypoglycemia, hyperglycemia and glucose variability, and maximizing time in range—requires a minimum measurement frequency of Q1h. Further reduction in measurement interval results in additional benefit, especially regarding glucose variability. This measurement interval was not achieved in the major RCTs of IIT, and it is very far from what is achieved in contemporary practice. 26 Second, while there was minimal incremental improvement in these parameters of glycemic control under conditions of low analytic imprecision, CV < 10%, when comparing Q15’ and Q1h measurement interval, higher analytic imprecision, CV ≥ 15%, exacerbated the degradation in glycemic control associated with Q2h measurement interval. This suggests that high analytic precision, such as that achieved by more accurate blood gas analyzers, is essential for optimal glycemic control using protocols with measurement intervals greater than Q1h. Third, a reduction of monitoring interval mitigates the deleterious effect of high measurement imprecision, defined as CV ≥ 15%. Fourth, this investigation sheds light on the varied results of the major RCT of IIT and may help inform the design of future interventional trials as well as for the development of standards relating to performance of glucose measuring devices and the development of clinical practice guidelines.
Conclusions
This clinically relevant Monte Carlo simulation model of glycemic control in critically ill patients, including 1 100 000 BG values, demonstrated that BG measurement interval had a substantial effect on 4 domains of glycemic control—hypoglycemia, hyperglycemia, glucose variability, and time in range. Optimal glycemic control required a measurement interval no longer than 1h, with further benefit obtained using measurement interval of 15’. These results have important clinical implications for the development of glycemic control standards, and for any future interventional trials.
Footnotes
Abbreviations
BG, blood glucose; CV, coefficient of variation; ICU, intensive care unit; IIT, intensive insulin therapy; RCT, randomized controlled trial.
Declaration of Conflicting Interests
The author(s) declared the following potential conflicts of interest with respect to the research, authorship, and/or publication of this article: JSK reported receiving consulting fees from Edwards Life Sciences, Medtronics, and OptiScan Biomedical. DEB reported receiving research support from Edwards Life Sciences and OptiScan Biomedical. JCB reported receiving research support from Edwards Life Sciences and OptiScan Biomedical.
Funding
The author(s) disclosed receipt of the following financial support for the research, authorship, and/or publication of this article: Modeling was supported by a grant to DEB from OptiScan Biomedical.
References
Supplementary Material
Please find the following supplemental material available below.
For Open Access articles published under a Creative Commons License, all supplemental material carries the same license as the article it is associated with.
For non-Open Access articles published, all supplemental material carries a non-exclusive license, and permission requests for re-use of supplemental material or any part of supplemental material shall be sent directly to the copyright owner as specified in the copyright notice associated with the article.