
Abstract
Background:
The use of near-continuous blood glucose (BG) monitoring has the potential to improve glycemic control in critically ill patients. The MANAGE IDE trial evaluated the performance of the OptiScanner (OS) 5000 in a multicenter cohort of 200 critically ill patients.
Methods:
An Independent Group reviewed the BG run charts of all 200 patients and voted whether unblinded use of the OS, with alarms set at 90 and 130 to 150 mg/dL to alert the clinical team to impending hypoglycemia and hyperglycemia, respectively, would have eliminated episodes of dysglycemia: hypoglycemia, defined as a single BG <70 mg/dL; hyperglycemia, defined as >4 hours of BG >150 mg/dL; severe hyperglycemia, defined as >4 hours of BG >200 mg/dL and increased glucose variability (GV), defined as coefficient of variation (CV) >20%.
Results:
At least one episode of dysglycemia occurred in 103 (51.5%) of the patients, including 6 (3.0%) with hypoglycemia, 83 (41.5%) with hyperglycemia, 18 (9.0%) with severe hyperglycemia, and 40 (20.0%) with increased GV. Unblinded use of the OS with appropriate alarms would likely have averted 97.1% of the episodes of dysglycemia: hypoglycemia (100.0%), hyperglycemia (96.4%), severe hyperglycemia (100.0%), and increased GV (97.5%). Point accuracy of the OS was very similar to that of the point of care BG monitoring devices used in the trial.
Conclusion:
Unblinded use of the OS would have eliminated nearly every episode of dysglycemia in this cohort of critically ill patients, thereby markedly improving the quality and safety of glucose control.
Keywords
Introduction
The differences in outcomes observed among the major interventional trials of intensive insulin therapy in critically ill patients can be explained in part by the quality or aggressiveness of glucose control practiced by the participating centers.1,2 Post hoc investigations of studies from randomized clinical trials demonstrated that moderate and severe hypoglycemia as well as increased glucose variability (GV) were independently associated with an increase in mortality.3,4 In addition, a low percentage of time in targeted blood glucose (BG) range is also independently associated with an increase in mortality in large observational studies.5,6
The impact of frequency of glucose monitoring may explain much of the difference between the quality of glucose control throughout intensive care unit medicine, independent of the choice of insulin adjustment algorithm. Guidelines differ as to the frequency of point of care blood glucose (POC BG) measurements with minimum intervals of every one to six hours between measurements. 7 More recently, a multi-center randomized trial showed that an intervention that resulted in obtaining a POC BG every 2.3 hours instead of every 3.0 hours (P < .001) improved time in targeted BG range, without increasing hypoglycemia. 8 However, contemporary practice limits the frequency of testing in nonresearch settings as a result of the insufficiency of nursing time. 9 Even hourly frequency has been associated with a greater risk of hypoglycemia if the measurement was delayed. 10 In silico models of monitoring frequency have demonstrated that a measurement interval of every 15 minutes markedly reduced these manifestations of dysglycemia, independent of the treatment protocol that was used11,12 this measurement frequency has been recommended by expert panels. 13 In a recent prospective, cluster-randomized, cross-over study, a fourfold decrease in the rate of hypoglycemia was recorded when a CGM-guided strategy was used to adapt the insulin infusion rate every 30 to 60 minutes. 14
A recently published 200-patient pivotal multi-center FDA-regulated investigation completed in four US academic centers (“MANAGE IDE” [NCT02211300]) evaluated the performance of the OptiScanner (OS) 5000, a continuous inline monitor that utilizes mid-infrared spectroscopy to directly measure glucose levels in plasma. 15 Glucose control was guided by (POC) glucose meters, with a mean (SD) measurement frequency of every 4.9 (3.3) hours.
As dysglycemia has been shown to clearly impact outcome in critically ill patients, we asked the question of whether or not the unblinded use of the OS would have mitigated the occurrence of dysglycemia in these critically ill patients. In order to achieve this objectively and minimize bias, a group independent of the Principal Investigators of the Manage IDE Trial met (Independent Group, IG). This group used consensus voting to establish metrics for dysglycemia, and whether the unblinded OS data plus its alarms could have mitigated the identified dysglycemia. Thereafter, the trial’s Principal Investigator reviewed and confirmed the findings.
Methods
Patients and BG Measurements
Details of the design of the MANAGE IDE trial have been published. 15 In brief, this trial was conducted in four US academic centers and included 200 critically ill adult patients. The OptiScanner 5000 (OptiScan Biomedical, Hayward, CA, United States) is a bedside monitoring system that automatically draws blood from the proximal port of a centrally inserted intravenous line, centrifuges the blood, and measures glucose concentrations in plasma using mid-infrared spectroscopy. Sampling is completed every 15 minutes and the corresponding glucose value is displayed on the monitor’s screen in real time, with the patient’s recent glucose results shown graphically on-screen to provide visualization of trending. The device retains 0.17 mL of blood per sample and returns the rest to the patient.
The clinical teams in the four centers were blinded to these data during the conduct of the trial, and the data were stored for accuracy and safety purposes. Blinding was required because the device was not cleared for clinical use at the time of trial. Glucose control in the trial was accomplished in each center using one of the two handheld glucose meters, the Roche Accu-Chek Inform II (Roche Diagnostics, Indianapolis, IN, United States) and the Nova Stat Strip (Nova Biomedical Corporation, Waltham, MA, United States), consistent with contemporary care in the United States. The BG target range in each of the four centers was 80 to 150 mg/dL. Each center used a different insulin dosing algorithm. Blood glucose from each of these samples was also measured in the lab reference Yellow Springs Instrument (YSI) 2300 stat analyzer (YSI Life Science, Yellow Springs, OH, United States). Comparative BG samples for the YSI were obtained as close as possible to the OS draws (within two minutes); these samples were collected at least 1 hour apart and with a maximum of 12 samples per 24 hours.
Figure 1 illustrates the OS’s Graphic User Interface (GUI). The GUI has a colorized display: red for values outside of the target range and green for values inside of it; these values are set by the clinician. The device calculates time in targeted BG range and provides an alarm when the upper or the lower limit of the range has been breached.
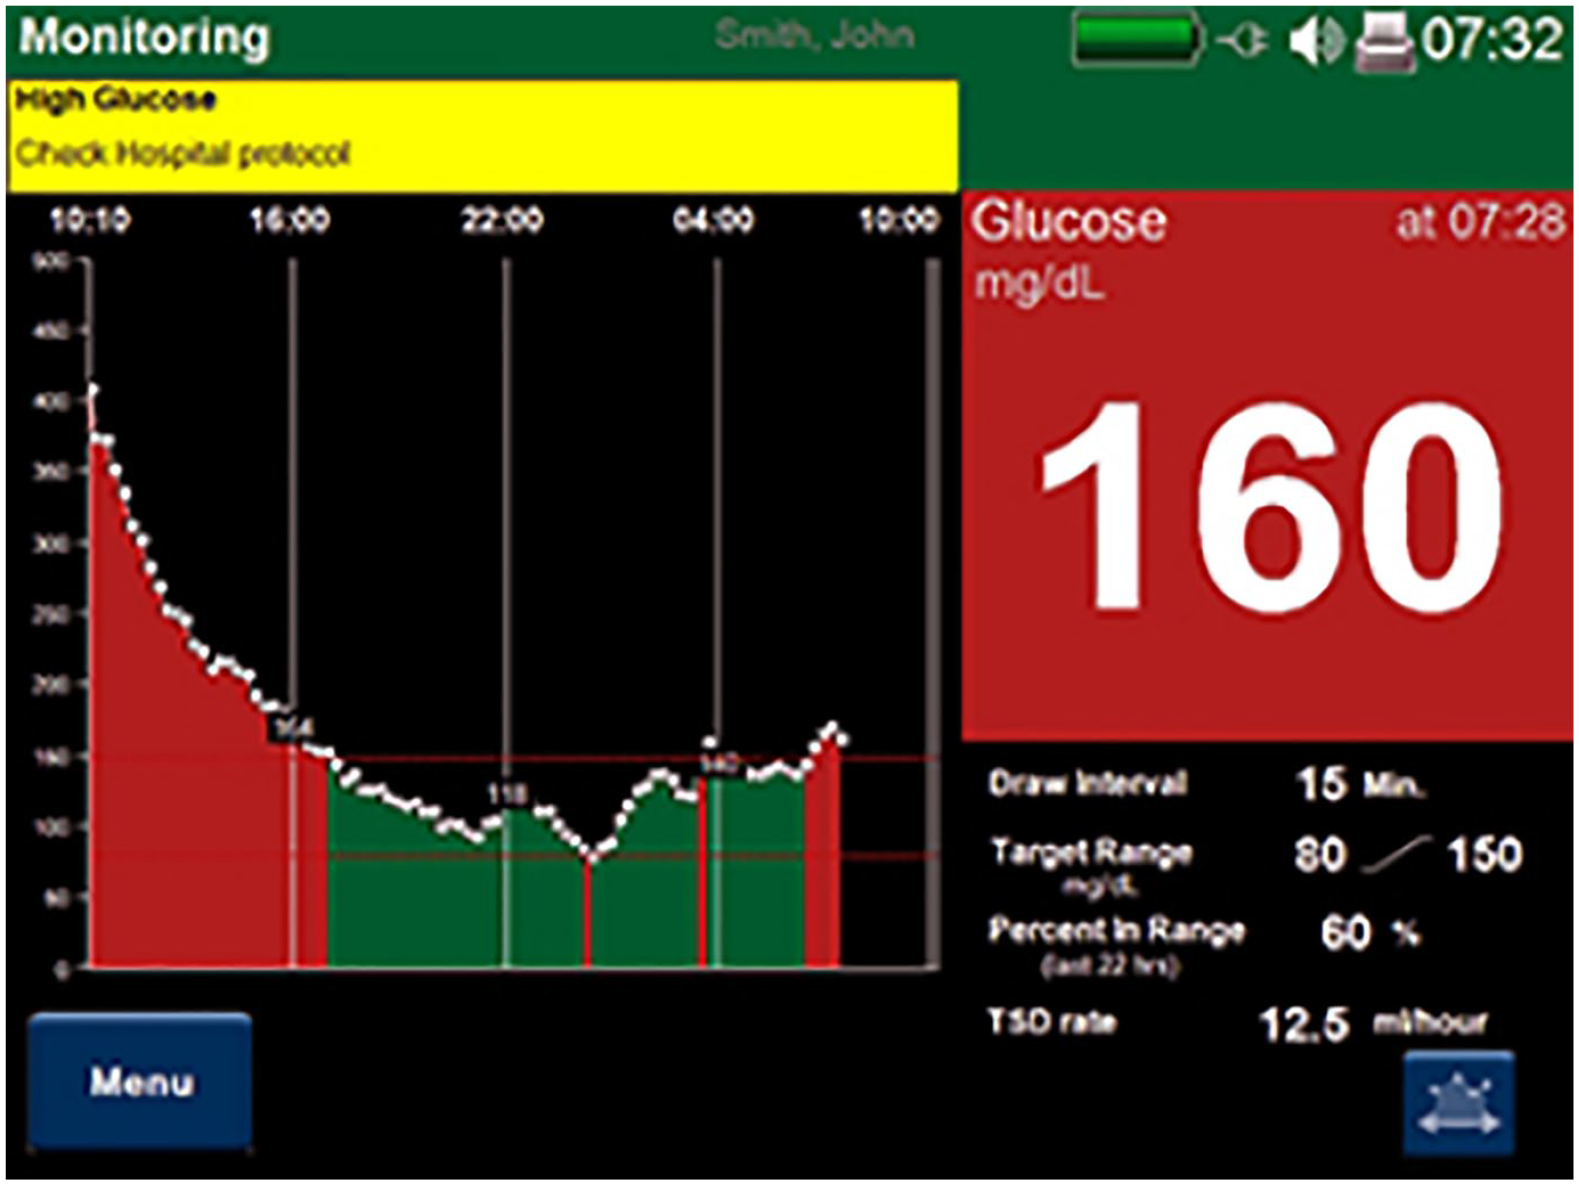
Illustration of the OptiScanner Graphic User Interface. In this example, the chosen target blood glucose range is 80-150 mg/dL. The patient initially spent over six hours outside of the range, then a period of time inside the range, and subsequently had another hyperglycemic excursion. The visual alarm reports hyperglycemia (yellow text box stating “high glucose”) and the current blood glucose (160 mg/dL) is within a red text box, demonstrating to the clinical team that intervention is indicated. The OptiScanner audibly alarms when the range has been breached.
Post hoc Analysis by IG
The group’s mandate was to evaluate the performance of the OS in each of the 200 patients and to determine the potential impact of the device on the occurrence of dysglycemia if its results had been available to clinicians during the trial. The review consisted of detailed examination of run charts that included all BG values obtained by OS, POC devices, and YSI. Examples of the run charts are included in the “Results” section. MATLAB version R2015b (MathWorks, Natick, MA, United States) was used to generate patient-specific run charts.
The IG adopted the following definitions of dysglycemia, chosen to conform to definitions of glycemia adopted by guideline and consensus groups13,16: * Hypoglycemia, defined as a single YSI BG value <70 mg/dL. * Hyperglycemia, defined as ≥4 hours of BG ≥150 mg/dL, using YSI BG values. Patients whose BG values were between 150 and 160 mg/dL; the majority of the time were considered to have clinically negligible hyperglycemia and were not counted as being hyperglycemic. * Severe hyperglycemia, defined as ≥4 hours of BG ≥200 mg/dL. For each of the hyperglycemia diagnoses, interpolation between successive YSI values was used. * Increased GV, defined as coefficient of variation (CV, defined as the quotient of the standard deviation of patient’s YSI glucose values and the mean of the patient’s YSI glucose values) ≥20%. A patient was not considered to be “eligible” for increased GV unless there were at least 10 YSI values available for analysis.
The IG assessed whether these manifestations of dysglycemia, based on YSI output, occurred in each of 200 patients. In addition, the IG determined, by unanimous vote after discussion of each record, whether dysglycemia would have been averted by unblinded use of the OS, with hypoglycemia alarms at a threshold of 90 mg/dL and hyperglycemia alarms at a threshold of 150 mg/dL. The IG characterized each patient run chart as falling into one of the four categories: OS would have provided potential benefit; OS would have led to potential harm; OS use would have provided neither benefit nor harm; and meter use was associated with major inaccuracy.
Results
The MANAGE IDE trial evaluated 200 patients, with median (IQR) age of 65 (56-73) and median (IQR) Acute Physiology and Chronic Health Evaluation II score of 14 (10-19). A total of 58 (29.0%) patients had diabetes and 39 (18.5%) were diagnosed with either sepsis or septic shock.
The trial included 3735 paired glucose measurements between the OS and the YSI. The mean (SD) BG of the YSI values was 138 (38) mg/dL. The mean (SD) hourly rate of change of BG values was 9.2 (6.1) mg/dL, with maximum hourly rate of change of 117 mg/dL. The highest mean hourly rate of change among 200 patients was 42.3 mg/dL.
Occurrence of Dysglycemia and Its Potential Mitigation by Unblinded Use of OS
At least one manifestation of dysglycemia was observed in 103 (51.5%) of the patients; these are summarized in Table 1.
Manifestations of Dysglycemia.
Either hyperglycemia or severe hyperglycemia.
Dysglycemia resulted in increased POC measurement frequency. However, as demonstrated in Figure 1, even measurements conducted every two hours were associated with dysglycemia.
The IG determined that, had the OS output been visible to the clinical teams, including visible alarms set at 90 mg/dL for hypoglycemia (alerting the nurse to discontinue the insulin infusion) and 150 mg/dL for hyperglycemia (alerting the nurse to consider increasing the insulin infusion rate), 100 of 103 (97%) patients with dysglycemia would have derived benefit from its use. Specifically, dysglycemia would likely have been averted in 6 of 6 (100%) patients with hypoglycemia, 80 of 83 (96.4%) patients with hyperglycemia, 18 of 18 (100%) patients with severe hyperglycemia, and 39 of 40 (97.5%) patients with high GV.
There were three patients (1.5%) in whom use of the OS may have resulted in potential harm.
Examples of Individual Patient Run Charts
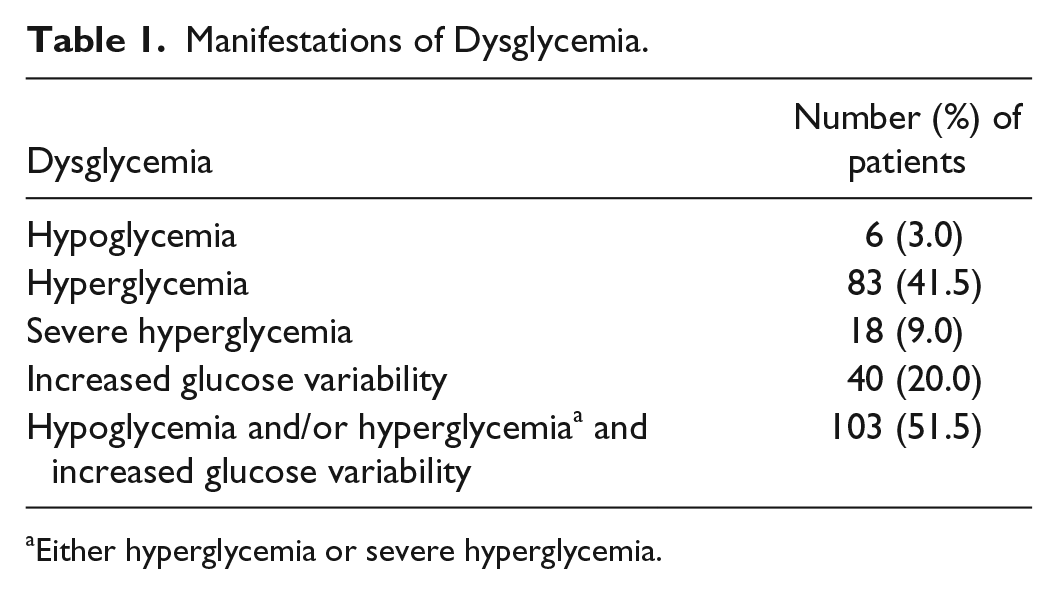
Figures 2(a) and (b) demonstrate how unblinded OS use with an alarm set at 90 mg/dL could have prevented hypoglycemia. For each of these figures, MARD = mean absolute relative difference; PCV = patient coefficient of variation; YSI = Yellow Spring Instrument (results blinded from clinicians in the trial); OS = OptiScanner (results blinded from clinicians in the trial); and POC = point of care device.
(a) and (b) demonstrate how unblinded OptiScanner use with an alarm set at 90 mg/dL could have prevented hypoglycemia.
In this case, the POC measurements by the BG meter were not made frequently enough to promptly identify the hypoglycemia. The OS would have alarmed prior to the first hypoglycemic value, validated with the reference analyzer. Unblinded OS use would likely have prevented hypoglycemia.
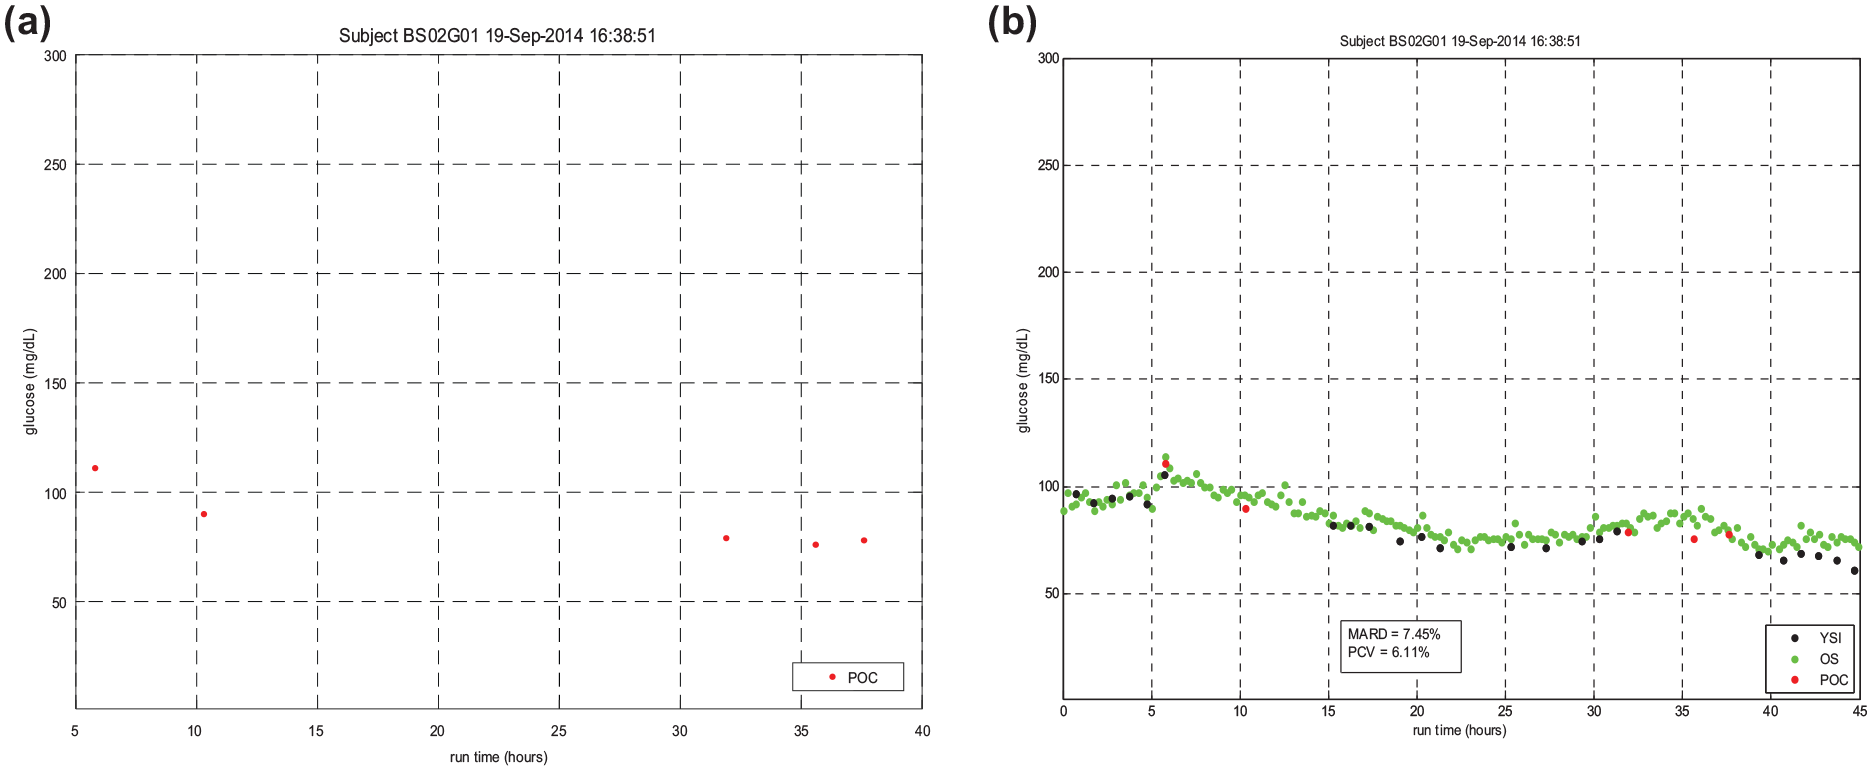
Figures 3(a) and (b) demonstrate how unblinded OS use could have prevented hyperglycemia. In these run charts, it is difficult to discern a clear pattern from the POC measurements. The OS elucidates the trending behavior of the glucose levels and informs more timely insulin adjustments to prevent the severe hyperglycemia seen at 40 hours. This is an example of both untreated severe hyperglycemia and high glycemic variability leading to very low time in targeted BG range. Unblinded use of OS would likely have mitigated these manifestations of dysglycemia.
(a) and (b) demonstrate how unblinded OptiScanner use could have prevented hyperglycemia. In these run charts, it is difficult to discern a clear pattern from the point of care measurements. The OptiScanner elucidates the trending behavior of the glucose levels and informs more timely insulin adjustments to prevent the severe hyperglycemia seen at 40 hours.
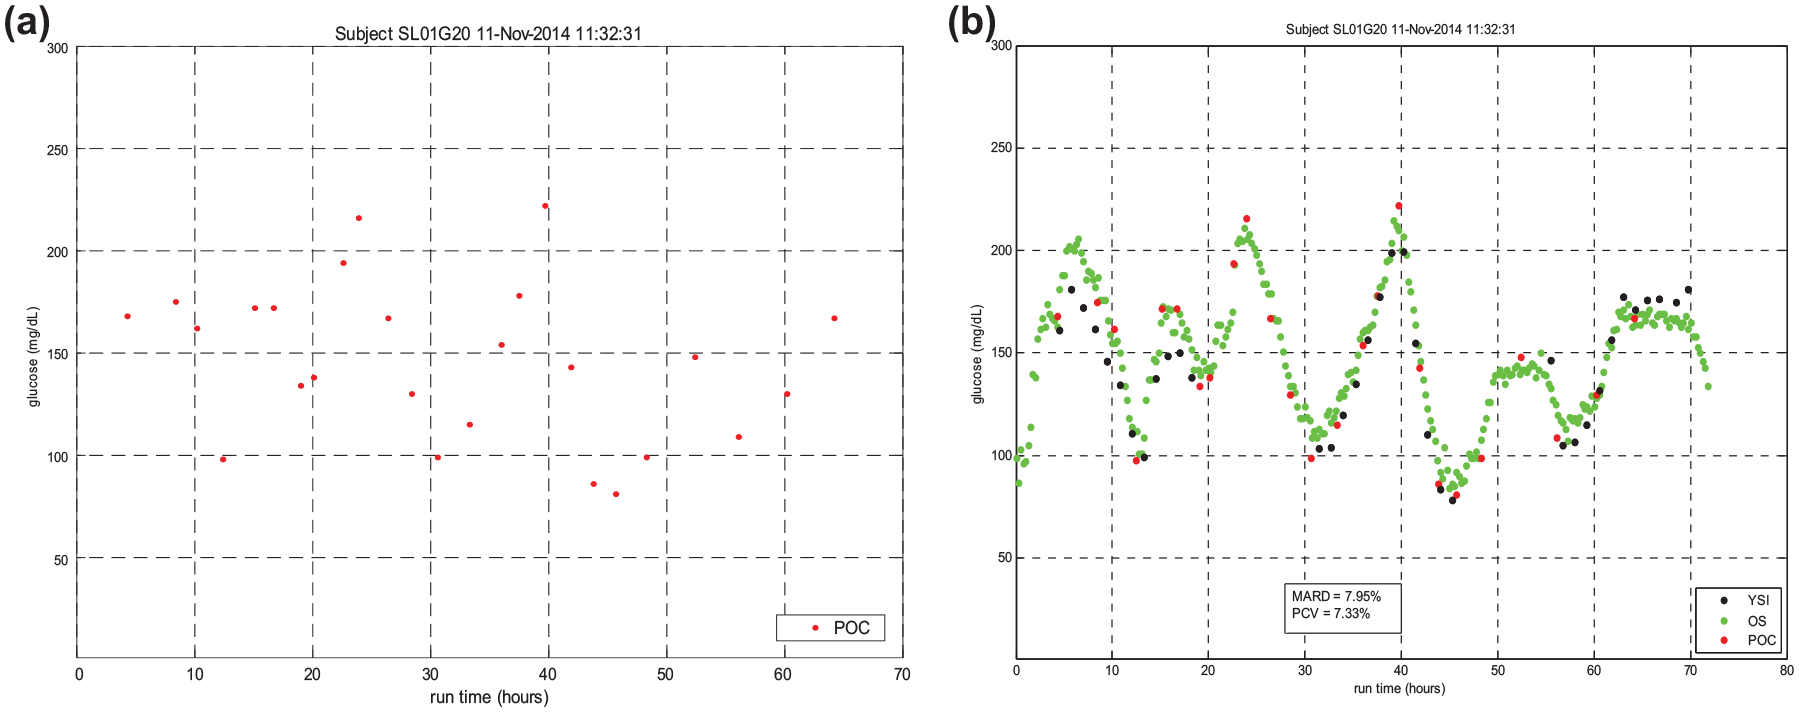
Figures 4(a) and (b) demonstrate how infrequent measurement leads to dysglycemia. There is a large difference in BG values in the POC readings between hour 60 and 67, and it is likely that the treating team considered the BG value at hour 67 to be an outlier, leading to further excursion into the hyperglycemic range. The frequent OS measurements would have made the increasing BG values evident.
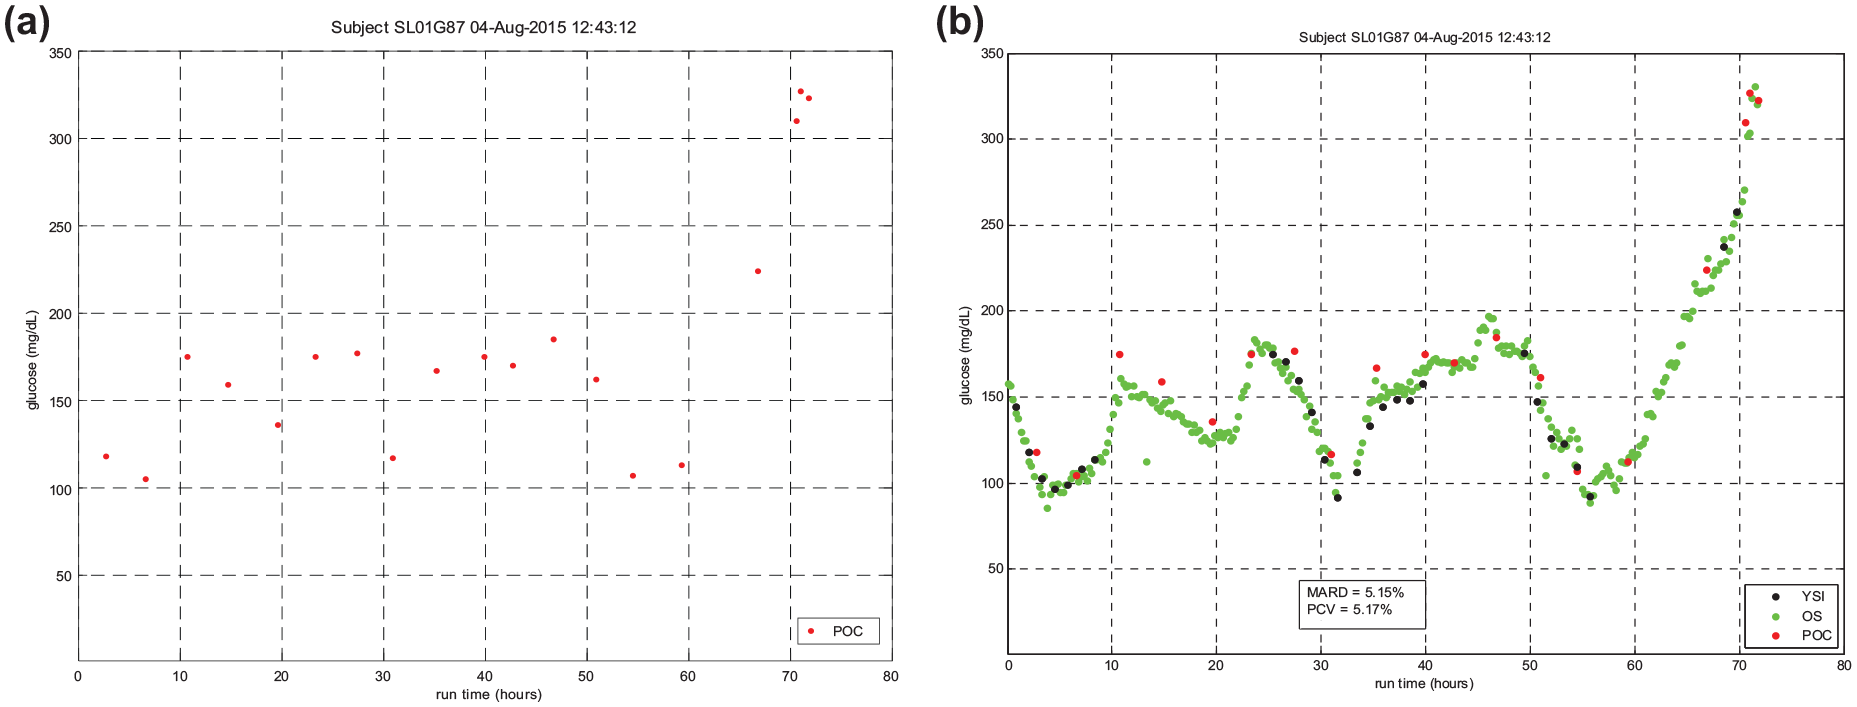
(a) and (b) demonstrate how infrequent measurement leads to dysglycemia. There is a large difference in blood glucose values in the point of care readings between hour 60 and 67, and it is likely that the treating team considered the blood glucose value at hour 67 to be an outlier, leading to further excursion into the hyperglycemic range. The frequent OptiScanner measurements would have made the increasing blood glucose values evident.
Sensitivity of the Alarm Settings and Point and Trend Accuracy of OS
Table 2 displays the sensitivity of hypoglycemia and hyperglycemia alarms at different threshold values. An appropriate response of the clinical team to an alarm setting of 90 mg/dL would have eliminated all episodes of hypoglycemia and appropriate response to alarm settings of 130 to 160 mg/dL would have eliminated the vast majority of BG values >150 mg/dL.
Sensitivity of Alarm Settings in Preventing Hypoglycemia and Hyperglycemia.
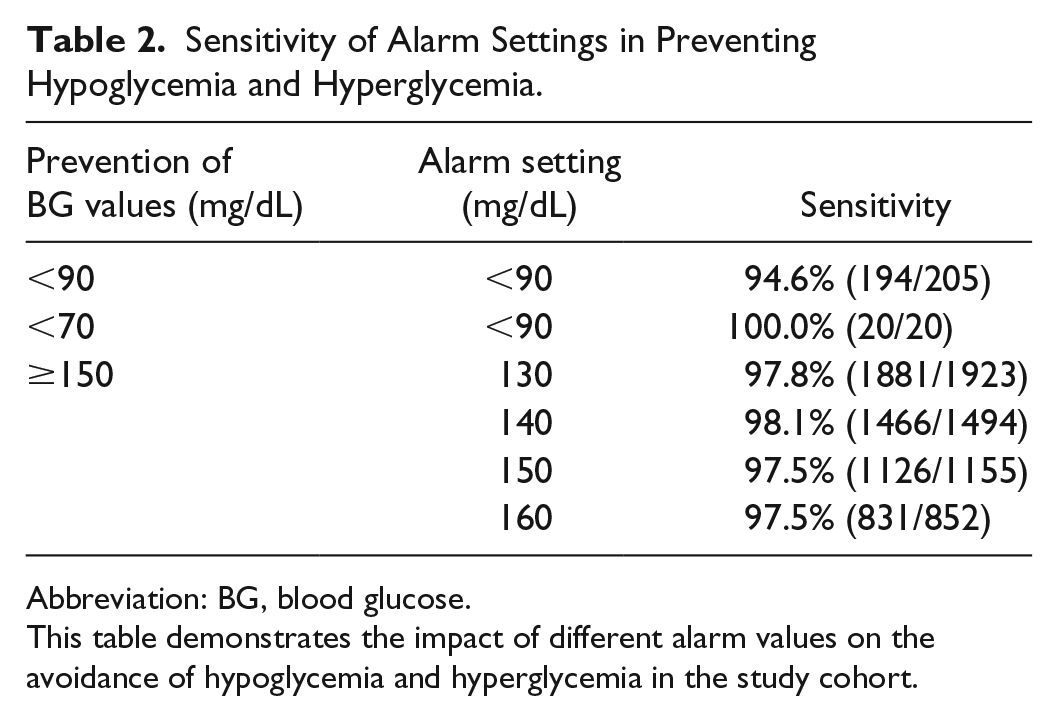
Abbreviation: BG, blood glucose.
This table demonstrates the impact of different alarm values on the avoidance of hypoglycemia and hyperglycemia in the study cohort.
Table 3 demonstrates the similar accuracy of the POC meters and OS as compared to the YSI.
Comparison of Accuracy of Point of Care Devices and OptiScanner.
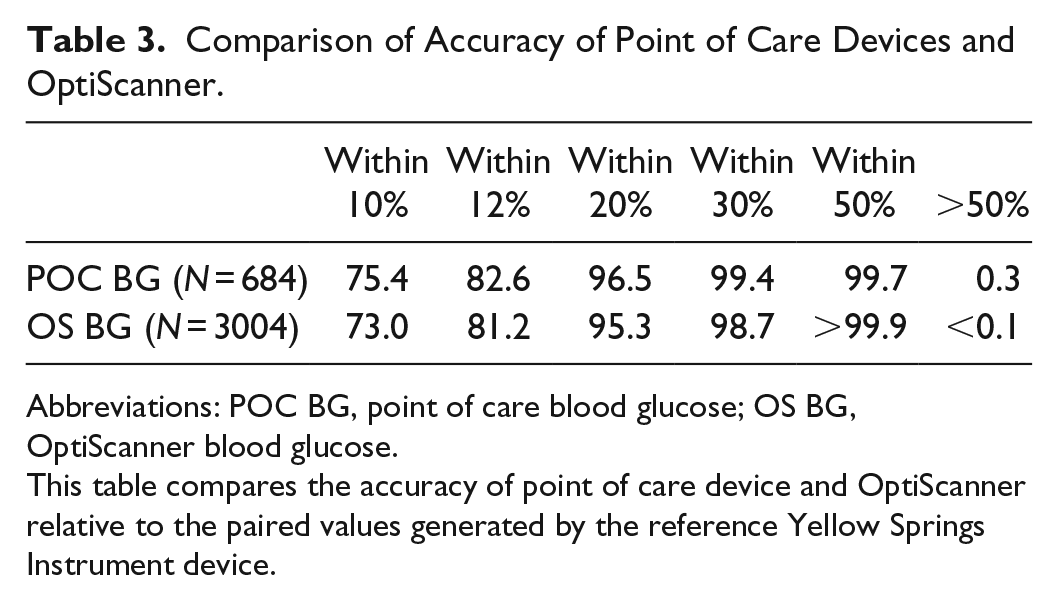
Abbreviations: POC BG, point of care blood glucose; OS BG, OptiScanner blood glucose.
This table compares the accuracy of point of care device and OptiScanner relative to the paired values generated by the reference Yellow Springs Instrument device.
Finally, trend accuracy can be quantified by an assessment of agreement between OS and YSI values. For one-hour interval, the agreement between devices at rates of change of >10, >20, and >30 mg/dL was 94.2%, 97.7%, and 100.0%, respectively.
Discussion
This study evaluates data from MANAGE IDE, an FDA-regulated pivotal multicenter trial in 200 critically ill patients, of the OS 5000, a bedside, inline, continuous glucose monitor that measures glucose in plasma using mid-infrared spectroscopy. There are two salient findings from the trial during which the treating clinicians were blinded to the OS and the reference analyzer’s output. First, dysglycemia (hyperglycemia, hypoglycemia, or increased GV) occurred in 51.5% of the patients. Second, unblinded use of the OS output, using alarm thresholds of 90 mg/dL for hypoglycemia and 150 mg/dL for hyperglycemia, would likely have averted episodes of dysglycemia in 97.1% of the patients who had dysglycemia.
An emerging literature has evolved describing the relevance of paper- and software-guided protocols, as well as measurement frequency, on the quality of glucose control in critically ill patients. Increased frequency of glucose measurement is associated with improved glucose control. Sauer et al compared glucose metrics in a single-center, before-and-after cohort study including 110 patients treated with a paper protocol and 87 patients treated using a computer-guided algorithm for insulin infusion. 10 Measurement of BG in patients using the paper protocol occurred every hour until the BG level was consistently in the desired range and then every two to four hours. Measurement frequency in the software-guided group was dictated by the application’s algorithm. These parameters resulted in 8 vs 17 BG measurements per day in the paper-protocol and computer-guided groups, respectively. Patients treated with the software-guided algorithm had a significantly higher time in targeted BG range (90-135 mg/dL in this study), lower mean BG, lower GV, and less hypoglycemia. The LOGIC-1 single center randomized controlled trial in 300 critically ill patients compared nurse-driven and a software-guided algorithm to achieve a more stringent BG target of 80 to 110 mg/dL. 16 The percentage time in targeted BG range was 60.1 vs 68.6 (P < .0001). The proportion of hypoglycemic values was higher in the nurse-driven group—3.8% vs 2.3% (P < .0001)—as was the percentage of patients with hypoglycemia – 48.3% vs 32.2% (P = .0048). The number of BG measurements was also lower in the nurse-driven group—9.6 vs 10.9 per 24 hours. A subsequent 1550-patient, two-center randomized controlled trial, LOGIC-2, compared nurse-driven and computer-guided BG control. 8 The study included two different BG targets—80 to 110 mg/dL (Leuven, Belgium) and 90 to 145 mg/dL (three centers in the Netherlands). The percentage time in targeted BG range was significantly higher in the computer-guided group—67.1 vs 47.0 (P < .001)—and measures of hyperglycemia were significantly lower. The proportion of hypoglycemic values was higher in the nurse-driven group, but the percentages of patients with hypoglycemia were similar. The number of BG measurements in LOGIC-2 was lower in the nurse-driven record—8.0 vs 10.4 per 24 hours (P < .001).
A large body of observational studies as well as data from interventional trials of intensive insulin therapy has demonstrated that hypoglycemia, hyperglycemia, increased GV, and time in targeted BG range are independently associated with mortality in critically ill patients.3,4,17-23 The interventional trials used intermittent BG monitoring and their time in targeted BG range was explicitly disclosed in only one study. 24 However, based on their achieved mean and standard deviation of the mean, one can infer that the time in targeted BG range was likely <50% in all but one study. 2 The number of BG measurements in the interventional trials was explicitly disclosed in only one study, 24 but was likely fewer than 8 per 24 hours, based on review of the studies’ methods.
It is notable that dysglycemia occurred in more than half of the patients in the MANAGE IDE trial. The four academic centers participating in the trial, and their local primary investigators, have had a longstanding interest in glucose control. This is reflected by the mean BG during the trial, with a targeted range of 80 to 150 mg/dL, of 138 mg/L, using YSI data. This is in sharp contrast to the results of a large US survey of BG control practice in 55 275 patients admitted to 575 US centers in which the mean BG in three days prior to discharge from the ICU was 176 mg/dL. 25
In silico modeling of the impact of measurement frequency on the quality of glucose control suggests that the improved glucose control (lowest rates of hypoglycemia, lowest GV, and highest time in targeted BG range) is achieved when BG measurement frequency is increased from hourly to every 5 or 15 minutes.11,12 Moreover, at least one study has demonstrated that these findings are consistent regardless of the insulin infusion treatment protocol. 12 In fact, higher measurement frequency overcame analytic inaccuracy. In other words, a model using glucose-measurement technology with low analytic performance (10% analytical CV) and high measurement frequency (every 15 minutes) performed better than did a model using glucose measurements with high analytic performance (5% CV) but low measurement frequency (every two hours). Zhou and coinvestigators performed an in silico analysis of the impact of hourly BG monitoring on the performance of the STAR glycemic control protocol in 236 patients and suggested that this monitoring frequency was not associated with an increase in hypoglycemia. 26 However, analysis of the MANAGE-IDE data suggests that hourly BG monitoring is not optimal. The hourly rate of change among the patients was as high as 42.3 mg/(dL·h); hourly BG monitoring would be incapable of mitigating excessive GV in this setting. In addition, it is unrealistic to expect that the BG monitor would have a 0% “no-read” rate; therefore, in expected clinical use, a percentage of BG values will not be displayed. In view of the fact that there is at most a 30 mg/dL “buffer” to keep a patient in an 80 to 140 mg/dL target range, hourly BG measurements would be suboptimal. Moreover, while 30-minute BG measurement intervals may be sufficient, this interval does not allow the treating clinician to use adjacent values to adjudicate a potential outlier without increased risk of dysglycemia.
Numerous prior studies have described analytic inaccuracy associated with POC glucose meters, and as expected, the use of the glucose meters in the MANAGE IDE trial did not satisfy point accuracy guidelines proposed by the FDA in 2016 (https://www.fda.gov/downloads/medicaldevices/deviceregulationandguidance/guidancedocuments/ucm380325.pdf). As shown in Table 3, the accuracy of the OS was equivalent to the accuracy of the state-of-the-art meters that were in use during this trial and the trend accuracy was very high as reflected by the data on directional slope agreement. Nonetheless, despite imperfect point accuracy, with an automated glucose measurement every 15 minutes, OS data would have benefitted 97.1% of the patients who exhibited dysglycemia in this study. Finally, the 15-minute measurement frequency standard has been supported for adoption in a recent international consensus conference of experts in BG control in the critically ill patients. 27 Future work should compare unblinded use of this technology to the current standard of care to confirm the hypothesis that near-continuous BG monitoring reduces dysglycemia.
Conclusion
The MANAGE IDE trial demonstrated that even in centers highly experienced in glucose control, more than half of the patients experienced significant dysglycemia. Measurement frequency of every two to four hours was found to be insufficient to prevent dysglycemia. The use of OS 5000, with automated glucose measurements every 15 minutes, combined with the use of alarms for hypoglycemia and hyperglycemia, would likely have mitigated the vast majority of dysglycemic episodes, resulting in marked improvement in BG control. These results shed considerable light on the discrepant results of the interventional trials of intensive insulin therapy and create a new equipoise to retest the hypothesis that intensive insulin therapy in critically ill patients saves lives. This real-world study suggests that, with similar analytic accuracy, increased frequency of glucose measurements has a profound effect on the incidence and management of dysglycemia in the critically ill population.
Footnotes
Authors’ Contributions
GB, SN, LM, EN, and KB led the MANAGE IDE trial and wrote the publication reporting its results; GB was the study’s Principal Investigator. JK wrote the initial draft of the current manuscript and GB, JB, DB, IH, and JCP assisted with critical revisions. All authors read and approved the final manuscript.
Declaration of Conflicting Interests
The author(s) declared the following potential conflicts of interest with respect to the research, authorship, and/or publication of this article: Grant Bochicchio has served as a consultant and investigator for OptiScan Biomedical Corp. Stanley Nasraway has served as an advisor and investigator for OptiScan Biomedical Corp. and as an advisor for Medical Decision Network, for the Glucostabilizer. L. Moore, Anthony Furnary, E. Nohra, and Kelly Bochicchio have nothing to disclose. James C. Boyd has received research funding from and served as a consultant or on advisory boards for Edwards Life Sciences and OptiScan Biomedical Corp. and serves as Deputy Editor, Clinical Chemistry, American Association for Clinical Chemistry. David E. Bruns has received research funding from and served as a consultant or on advisory boards for Edwards Life Sciences and OptiScan Biomedical Corp. Irl B. Hirsch has received research funding from Medtronic Diabetes and has been a consultant for Abbott Diabetes Care, Bigfoot, Roche, and Becton Dickinson. Jean-Charles Preiser has served as a consultant or on advisory boards for Medtronic, Edwards Life Sciences, and OptiScan Biomedical. James S. Krinsley has served as a consultant or on advisory boards for Medtronic, Edwards Life Sciences, Roche Diagnostics, and OptiScan Biomedical Corp.
Funding
The author(s) disclosed receipt of the following financial support for the research, authorship, and/or publication of this article: This work was funded by OptiScan Biomedical.