
Abstract
Aims:
In type 1 diabetes (T1D), repeated hypoglycemic episodes may reduce hormonal defenses and increase the risk for severe hypoglycemia. In this work, we investigate the effect of a structured hyper/hypoglycemic metabolic challenge on the postintervention glucose variability in T1D subjects studied at home.
Methods:
Thirty T1D subjects using insulin pump were monitored with blood glucose meters (SMBG) during a 1-month observation period. After 2 weeks of monitoring, participants were admitted at the University of Virginia Clinical Research Unit to undergo an 8-hour metabolic challenge. The intervention was designed to create hyperglycemia shortly followed by hypoglycemia, mimicking a real-life scenario of underbolused meal followed by overcorrection. After the intervention, subjects were monitored for 2 more weeks. Glycemic variability was assessed before and after the challenge using the low blood glucose index (LBGI). Glucagon counterregulation (GCR) response to induced hypoglycemia was also measured. LBGI variation and GCR were linked to prior exposure to hypoglycemia.
Results:
Subjects significantly exposed to hypoglycemia in the 2 weeks before the intervention had a significant increase of postchallenge LBGI (P < .001) and lower GCR response (P < .05). Recent occurrence of hypoglycemia and number of years not using an insulin pump were identified as significant predictors of postchallenge LBGI (P < .001).
Conclusion:
Glycemic swings, a common result of suboptimal insulin treatment, have a significant impact on future (days) glycemic control in T1D subjects with a recent history of hypoglycemia, as measured in the field. Choice of past insulin therapy may also mediate this effect.
In type 1 diabetes (T1D), the autoimmune destruction of pancreatic beta-cells results in practically absent endogenous insulin secretion. T1D subjects are therefore treated with exogenous insulin to keep their blood glucose (BG) level within a safe euglycemic range, but imperfect insulin replacement may result in hyperglycemia and abnormal glucose variability. To improve glucose control and reduce the progression of diabetes complications, intensive exogenous insulin treatment is recommended. 1 However, aggressive therapy is frequently associated with an increased occurrence of hypoglycemic episodes, themselves reducing the patients’ hormonal defenses and warning symptoms for subsequent low BG events.2,3 Consequently, patients with T1D face a lifelong optimization problem: to maintain a strict glycemic control without increasing the risk for hypoglycemia, which has been indeed identified as the major barrier to optimal diabetes management. 4
Hypoglycemia in T1D is typically the effect of the interplay of excessive insulin and compromised defenses against hypoglycemia known as glucose counterregulation (CR). 5 Self-treatment behavior resulting in excessive or ill-timed insulin administration, missed meals and overnight fasting periods, excessive physical activity, and conditions that increase insulin sensitivity or decrease insulin clearance, may worsen the overall glucose control and trigger hypoglycemia. However, behavioral events were shown to account for only a minority of episodes of severe hypoglycemia (SH), which is primarily mediated by compromised hormonal defenses and reduced awareness of low BG levels. 6
Kovatchev et al observed that SH events are preceded and followed by periods of increased BG instability. 7 Forty-eight to 24 hours before the episode, a decrease of average BG and increase of BG standard deviation were documented, followed by a sharp increase of the low blood glucose index (LBGI) 8 —an indicator of the risk of future SH—in the 24 hours before the event. The recovery process after SH took 24 to 48 hours, with LBGI still high in the day after the acute episode.
Consequently, the bio-behavioral control of T1D depends on 3 main factors: (1) self-treatment behavior, (2) individual glucose metabolism, which usually varies within day and from day to day, and (3) glucose CR, the effectiveness of the latter being related to previous occurrence of hypoglycemic episodes.9-22
In this study, we characterize the glycemic control of T1D patients in the days following a metabolic challenge involving sequentially induced mild hyperglycemia and hypoglycemia, and assess the CR capacity during the challenge as measured by the glucagon response to induced hypoglycemia.
The metabolic intervention was specifically designed to mimic a real-life scenario of underbolused meal followed by overcorrection, a common event for T1D patients with suboptimal insulin treatment and whose short-term effects on glucose variability have not been characterized yet.
We considered that recent occurrence of hypoglycemia preceding the challenge could affect the subjects’ capability to tolerate the metabolic intervention and consequently, we tested the hypotheses that (1) the challenge, designed as an event that pushes the metabolic system into a transient super-critical state characterized by increased variability, disturbs the glycemic control in the following days, with a magnitude that is closely related to the subjects’ prior exposure to low BG; (2) glucagon CR (GCR) capacity, despite reported to be generally lost early after the onset of T1D, may be subject to minor, transient changes later in the progression of the disease, which can be tracked back to recent history of mild hypoglycemia.
Research Design and Methods
Clinical Protocol
The 1-month clinical trial (clinicaltrial.gov #NCT01835964, UVa IRB#16723) was performed at the University of Virginia (Charlottesville, VA, USA). Subjects were recruited through advertisement in newsletters and diabetes clinics, and by direct referrals. Inclusion criteria for the study were age between 21 and 65 years, T1D of at least 2-year duration, insulin pump used for at least 6 months prior to the study, and glycated hemoglobin (HbA1c) not higher than 10%. All participants attended introductory meetings, were informed about the clinical protocol, and signed consent forms. The initial screening included a collection of background data and a determination of HbA1c. Throughout the study, participants were instructed to use their own insulin pump and monitor their BG level more than 4 times/day with their own BG meter. Subjects were required to keep using the same devices during the entire study. After 2 weeks of monitoring, all subjects were admitted fasting at the UVa Clinical Research Unit (CRU) to undergo an 8-hour standardized metabolic challenge. During the intervention, they received an underbolused liquid mixed-meal (BOOST Original containing 41 grams of carbohydrate, 4 grams of fat, and 10 grams of protein) intended to raise the plasma glucose above 200 mg/dl, followed 4 hours later by the induction of hypoglycemia with intravenous insulin administration to a goal of a 55 mg/dl plasma glucose concentration. Blood samples were collected frequently (between Q5 and Q30) during the CRU admission to measure plasma glucose (YSI 2300 Stat Plus, Yellow Springs Instrument, Yellow Springs, OH), insulin (LPI-16K LisPro Insulin RIA, EMD Millipore Merck KGaA, Darmstadt, Germany), and glucagon (GL-32K Glucagon RIA, EMD Millipore Merck KGaA, Darmstadt, Germany) concentrations.
Recent Exposure to Hypoglycemia and Definition of Subject Groups
To test the impact of prior exposure to low BG on the challenge effect on short-term glucose variability, the study participants were stratified in 3 different groups, based on the number of hypoglycemic episodes below 70 mg/dl they had experienced in the 2 weeks preceding the intervention. The groups were identified as follows: Group 1 - 10 subjects who had experienced hypoglycemia once every 3 days or less, in the 2 weeks before the challenge (0 to 4 events); Group 2 - 8 subjects who had experienced hypoglycemia approximately once every 2 days (5 to 9 events); Group 3 - 10 subjects reporting approximately 1 or more hypoglycemic events per day (10 events or more).
Assessment of Glucose Variability and Metabolic Challenge Effect
Glucose variability in the days leading to and following the challenge was assessed by computing LBGI on daily self-monitoring of BG (SMBG) readings. LBGI is a previously introduced variability measure and strong predictor of SH, designed to aggregate the frequency and extent of low BG events into a single number. 8 Its computation requires a symmetrization of the BG range based on a logarithmic transformation, which is then used to associate a measure of hypoglycemic risk to each collection of BG measurements. 23 By this definition, a higher LBGI may indicate a large number of mild hypoglycemic events, a small number of significant events, or a combination of both. 8
Assuming that the intervention could impact the subjects’ glycemic control for up to 72 hours,7,9 the challenge effect was assessed by comparing LBGI averaged over 3 days following the intervention (
Assessment of GCR Capacity
A measure of GCR capacity was derived from the change in glucagon concentration during the metabolic intervention, as the ratio between response and baseline glucagon levels. Baseline glucagon was computed as the average concentration of glucagon when the falling plasma glucose during induced hypoglycemia was below 100 mg/dl but above the hypoglycemic threshold of 60 mg/dl; the response level was the average concentration from the hypoglycemic threshold crossing point to the end of the metabolic challenge. To test the impact of prior exposure to hypoglycemia on the counterregulatory function, the defined GCR measure was compared between the 3 groups of subjects. Participants never achieving hypoglycemia below 60 mg/dl during the intervention were excluded from the CR analysis.
Statistical Analysis
One-way ANOVA was used to compare the 3 groups of subjects with respect to several demographic characteristics and their GCR response; robust Welch ANOVA was used if data normality (Shapiro-Wilk test) or homogeneity of variances (Levene’s test) assumptions were not verified. Repeated-measures mixed ANOVA (within-between-subjects design) was used to study LBGI variation in response to the challenge in the 3 groups and assess whether participants had changed their basal insulin regimen in response to the intervention. Outliers were identified as observations larger than Q3+1.5(Q3-Q1) or smaller than Q1-1.5(Q3-Q1), with Q1 and Q3 being the 25th and 75th percentile of the considered sample and corresponding to a 99.3% coverage (±2.7 SD) if data are normally distributed. Whenever outliers were detected, they were excluded from the specific analysis. Post hoc comparisons after a significant ANOVA and simple main effect analyses were based on Fisher’s least significant difference test (no correction for multiple comparisons).
Pearson’s correlation was used to test the existence of a relationship between GCR, exposure to hypoglycemia, and demographic parameters.
Linear regression with standard backward elimination of the nonsignificant predictors was used to identify predictors of postchallenge LBGI.
Results
Thirty subjects were enrolled. Two participants were unable to complete the required data collection and were thus excluded from the study. Among the remaining 28 subjects, 15 were men and 13 women, age was 43 ± 11 years, duration of diabetes 24 ± 11 years, duration of pump therapy 11 ± 7 years, and HbA1c 8 ± 1%.
Group Comparison
The 3 groups didn’t differ in terms of age (44.5 vs 39.8 vs 43.9 years, P = .644), duration of diabetes (20.9 vs 21.4 vs 28.3 years, P = .162), and duration of pump therapy (10.7 vs 12.4 vs 10.1 years, P = .795), but subjects in Group 3 had lower HbA1c (7.9% vs 7.9% vs 6.7%, P = .001) and higher number of years not on pump (7.6 vs 9.0 vs 18.2, P = .013), as shown in Figure 1.
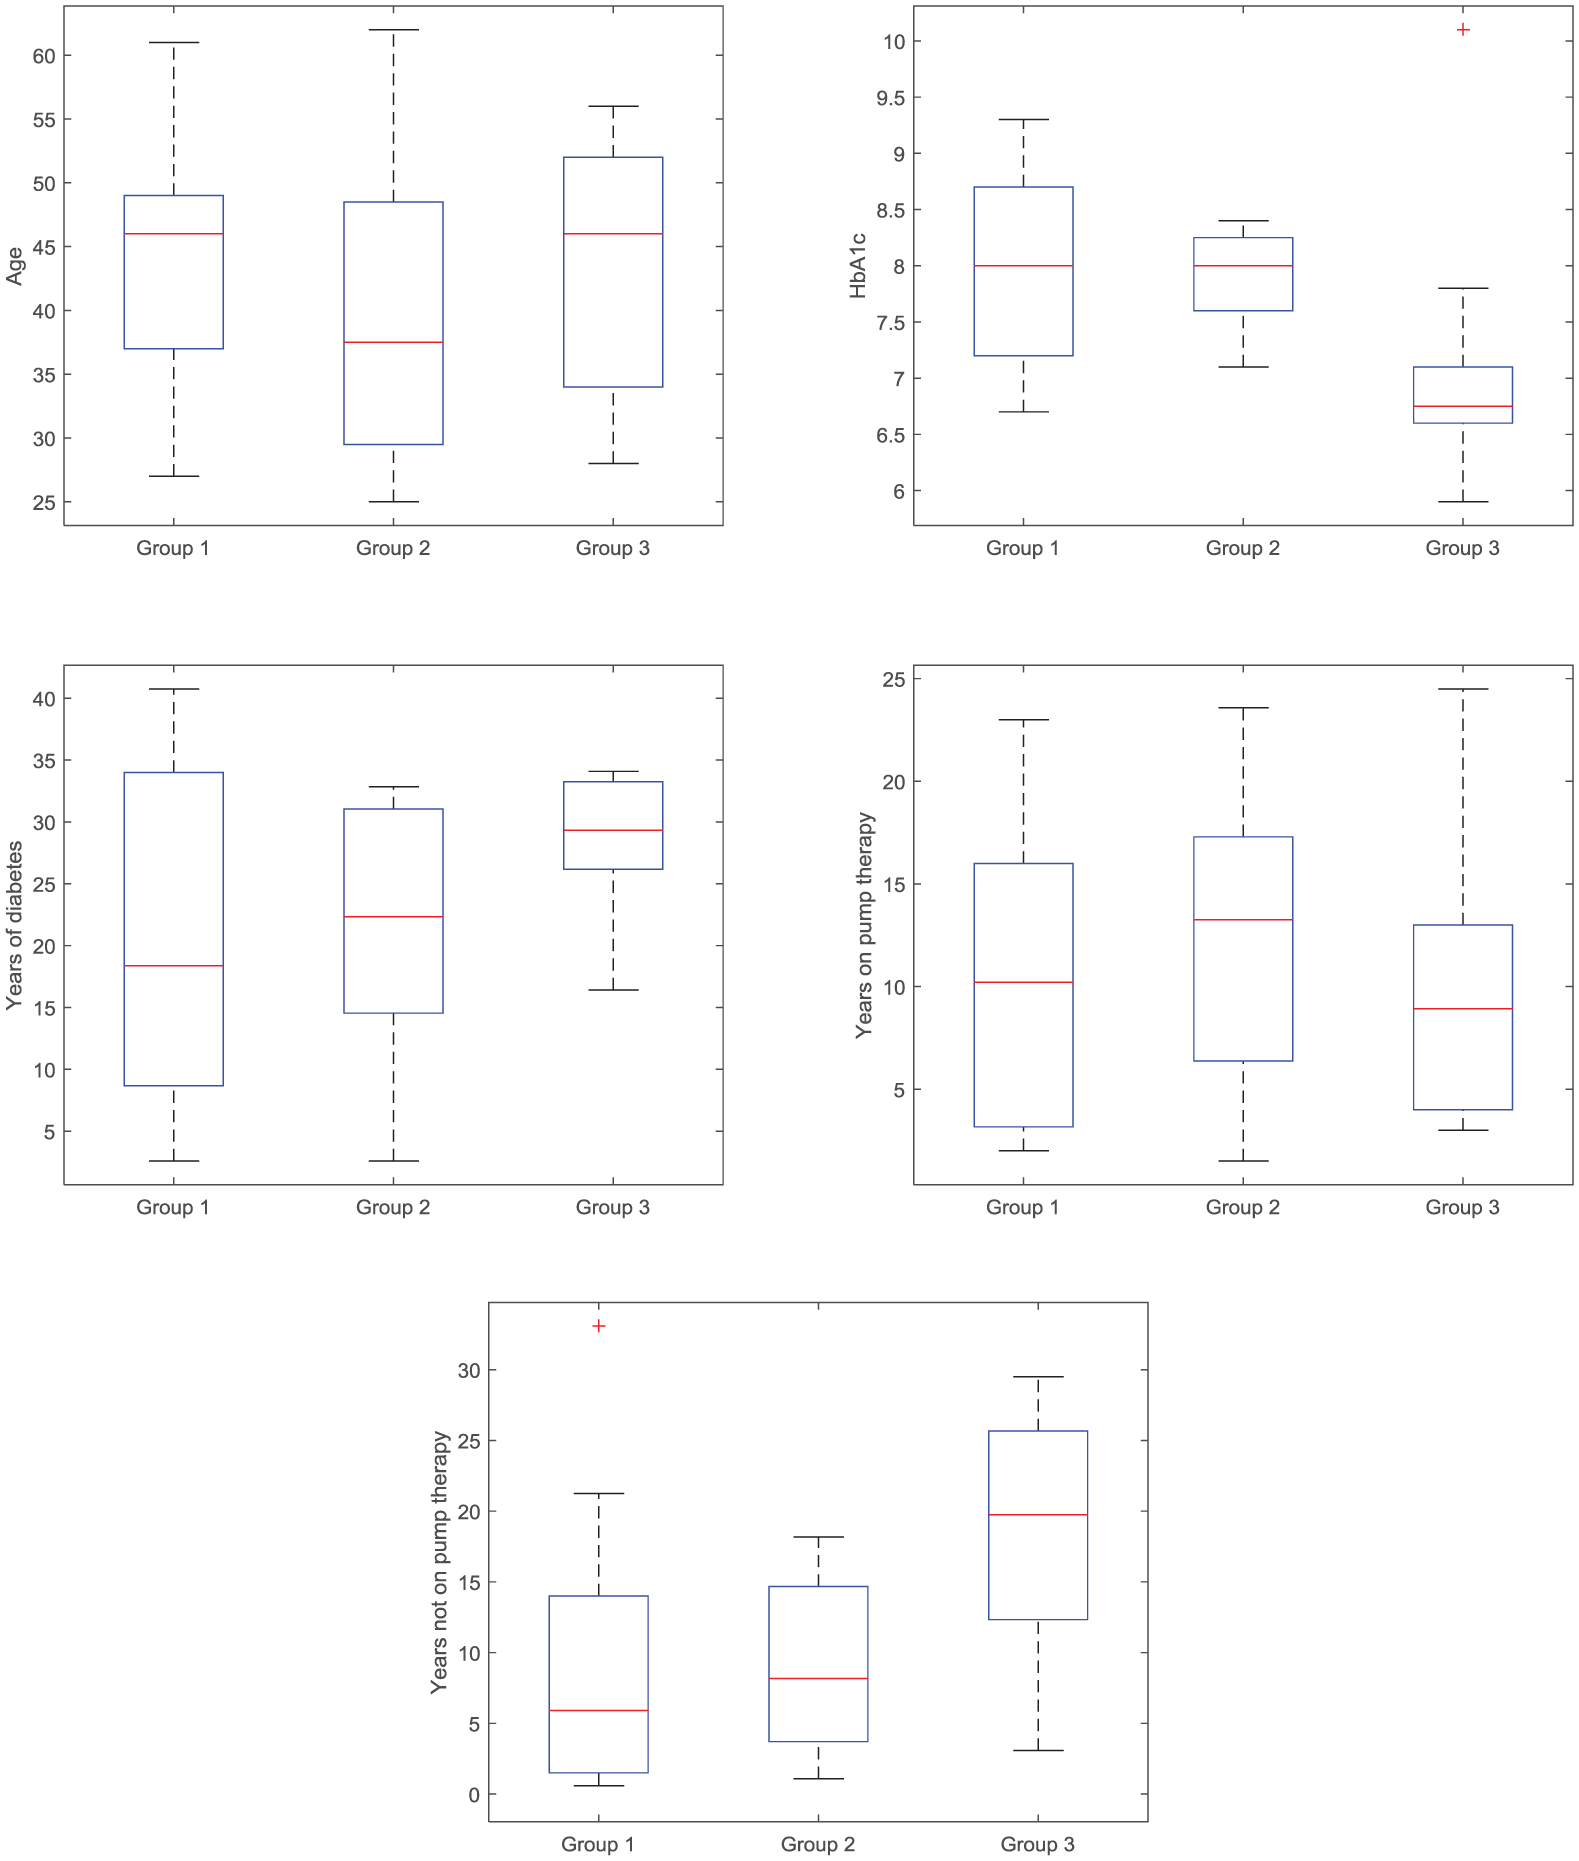
Boxplot of age, HbA1c, years of diabetes, years on pump therapy, and years not on pump in the 3 groups of subjects. On each box, the central mark is the median, the edges of the box are the 25th and 75th percentiles, the whiskers extend to the most extreme data points the algorithm considers to be not outliers, and the outliers are plotted individually.
Basal daily insulin as provided by pump infusion wasn’t different between the groups (P = .105) and wasn’t adjusted in the 3 days following the intervention as compared to the 3 days preceding it (Group 1: 0.23 vs 0.23 U/kg, P = .976; Group 2: 0.30 vs 0.31 U/kg, P = .075; Group 3: 0.31 vs 0.31 U/kg, P = .999).
The average number of SMBGs/day in the 2 weeks preceding the challenge wasn’t significantly different between the 3 groups (5.1 vs 5.3 vs 5.8, P = .507), and the same was observed in the 3 days preceding (6.6 vs 6.5 vs 6.3, P = .887) and following (6.0 vs 6.9 vs 7.2, P = .291) the intervention.
Challenge Effect on Short-Term Glucose Variability
Figure 2 shows the distribution of
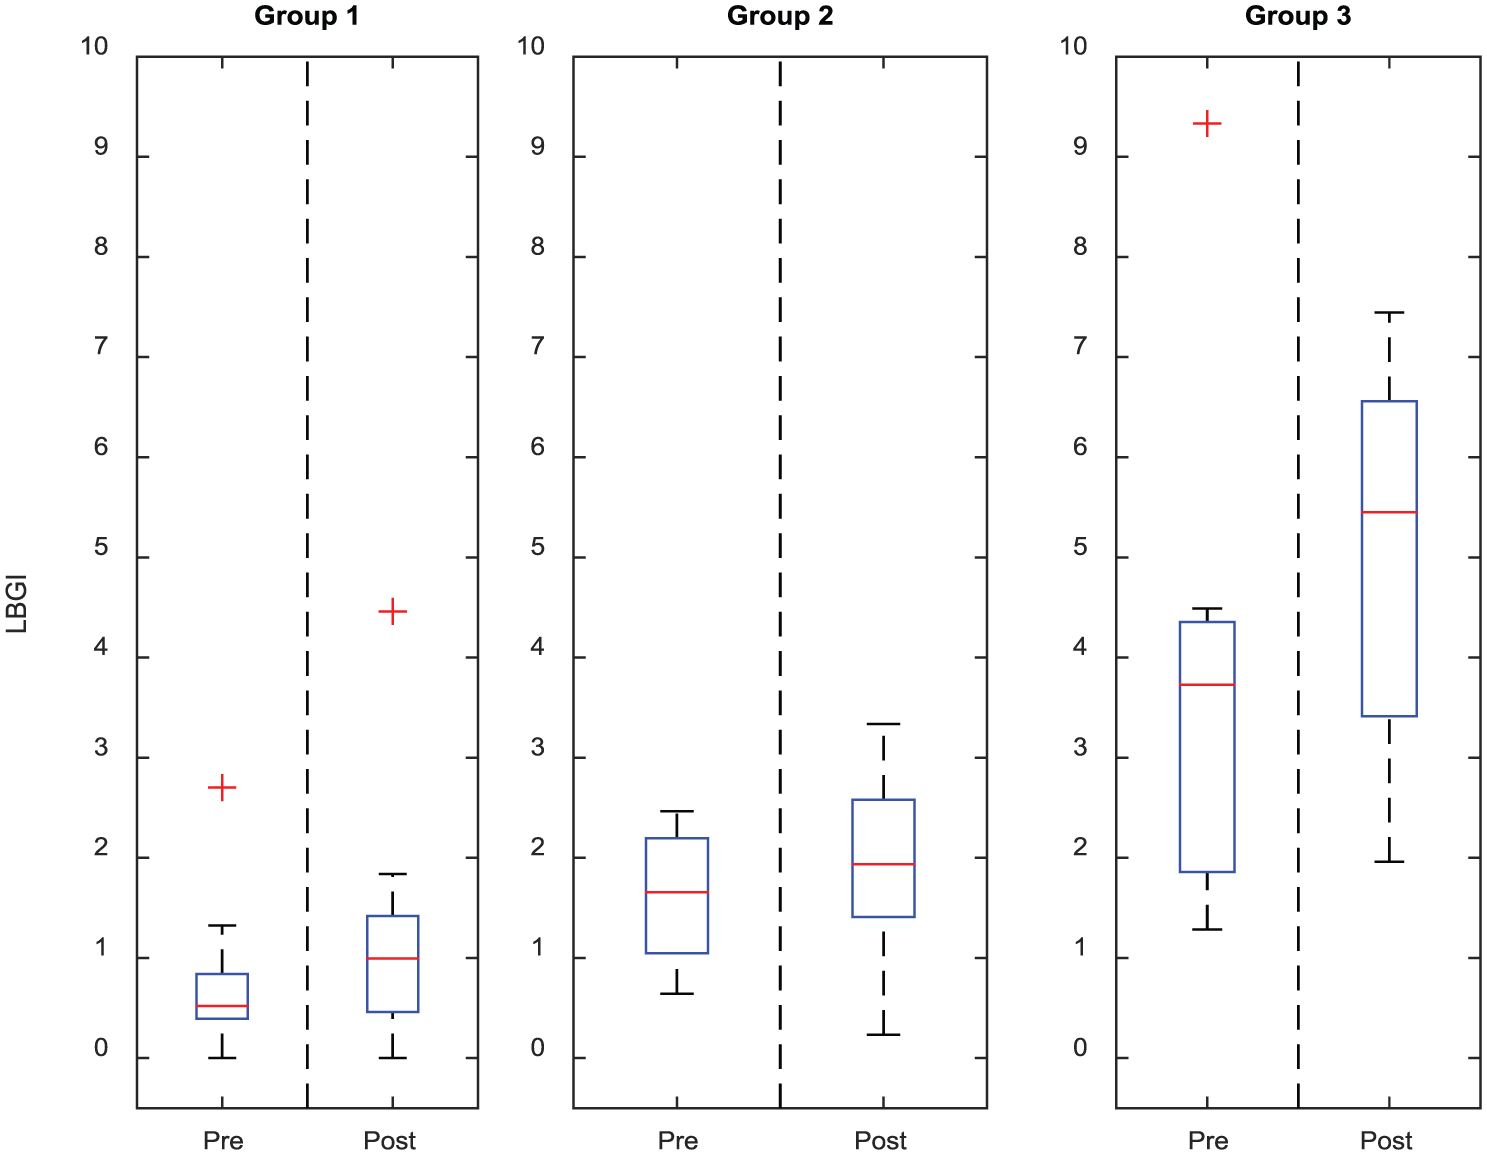
Boxplot of
GCR Response to Induced Hypoglycemia
Twenty-two of the 28 completers reached hypoglycemic levels below 60 mg/dl and were therefore used for CR analysis (6 subjects in Group 1, 7 in Group 2, and 9 in Group 3). As shown in Figure 3, a decreasing trend in average GCR response was observed across the groups (1.22 vs 1.14 vs 1.08, P = .078), with GCR in Group 3 significantly lower than in Group 1 (P = .026). Results from correlation analyses showed a significant correlation of GCR with LBGI in the 2 weeks preceding the challenge (
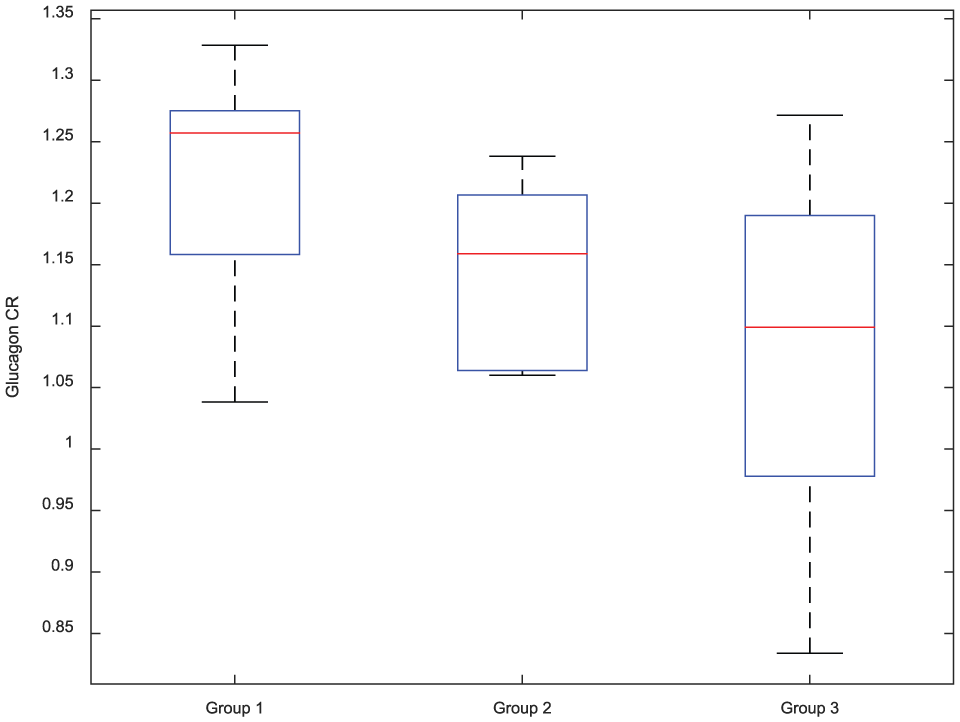
Boxplot of glucagon concentration fold-increase during induced hypoglycemia in the 3 groups of subjects. On each box, the central mark is the median, the edges of the box are the 25th and 75th percentiles, and the whiskers extend to the most extreme data points the algorithm considers to be not outliers.
Factors Predictive of Short-Term Postchallenge LBGI
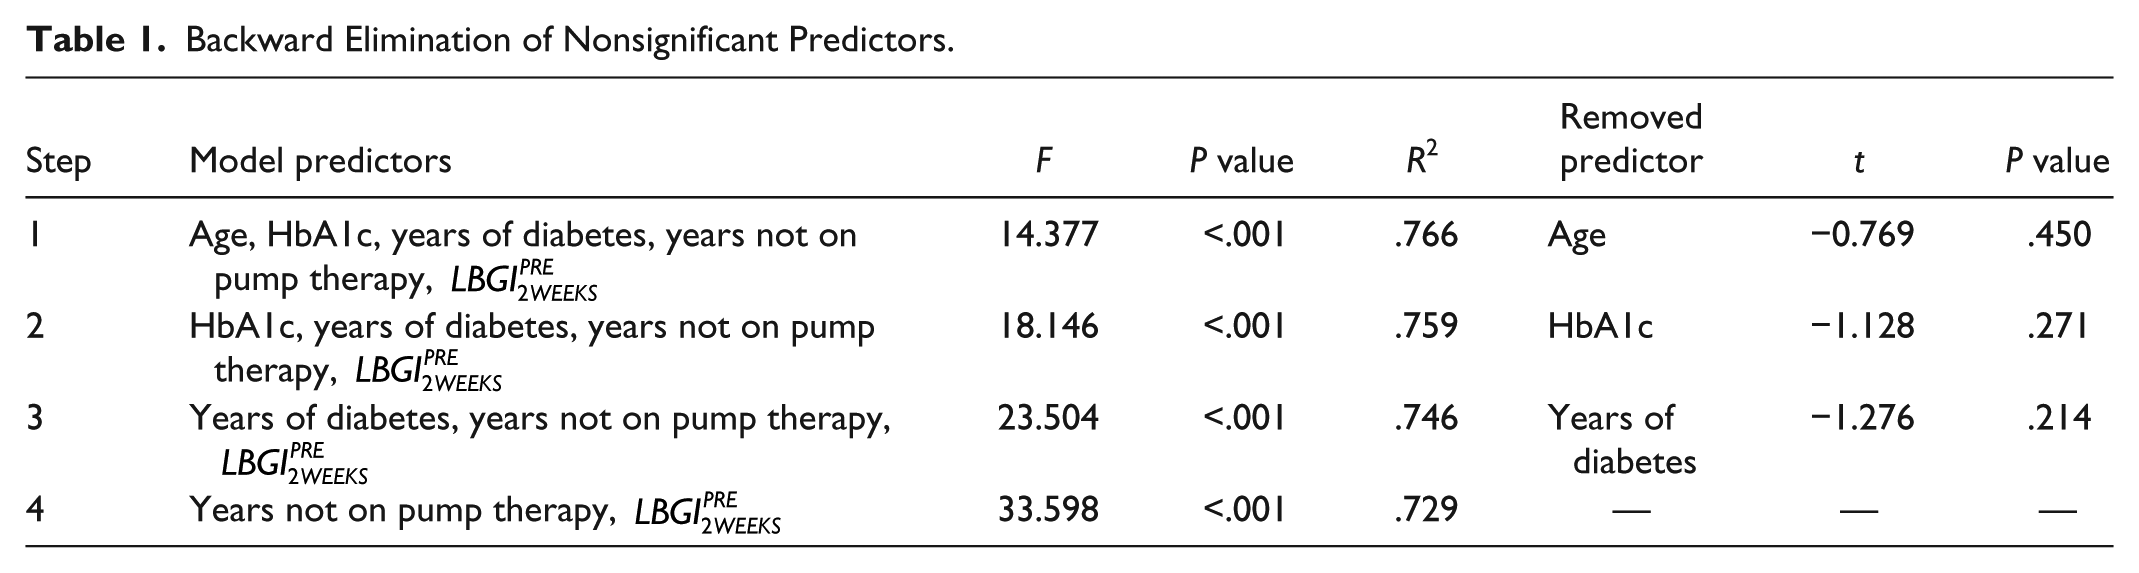
Linear regression was used to identify predictive factors of postchallenge glucose variability. Table 1 presents the results from each step of the backward elimination procedure, reporting the pool of considered model predictors at each iteration, with the model-associated F statistic and P value; the model coefficient of variation (R2); and the least significant predictor, with associated t-statistic and P value. The final model had 2 predictors,
Backward Elimination of Nonsignificant Predictors.
Analyses of correlation of years not on pump with
Discussion
Subjects with T1D who cannot rely on endogenous insulin to keep their BG level in a safe range, face the lifelong optimization problem of achieving thigh glycemic control to reduce the progression of complications, without increasing the risk for hypoglycemia.1,3 This optimization process relies heavily on 3 factors which define the bio-behavioral control of T1D: the subject’s self-treatment behavior (eg, meals, insulin administration, physical activity, etc), individual glucose metabolism characteristics (eg, SI), and protection against hypoglycemia (eg, glucose CR).9-22 Deficient ability to counteract hypoglycemia is the result of repeated antecedent low BG episodes, which cause elevated glycemic thresholds for CR activation and symptoms appearance, thereby causing reduced hormonal and symptomatic responses to subsequent hypoglycemia. Consequently, the occurrence of SH is likely to be preceded and followed by periods of higher exposure to hypoglycemia, which have been quantitatively characterized in terms of 24- to 48-hour BG disturbances before and after the acute event. 7
In this work, the short-term effect of a structured 8-hour metabolic challenge involving sequential exposure to hyper- and hypoglycemia, was investigated in a population of T1D patients treated with insulin pump for at least 6 months. The challenge was specifically designed to mimic events of BG disturbance typically occurring in the everyday life of T1D patients when their treatment is suboptimal. Subjects were stratified in 3 groups based on their prechallenge exposure to low BG. Their postchallenge variation of hypoglycemia occurrence as well as GCR during the challenge were quantitatively assessed to test the hypothesis that higher exposure to low BG in the everyday life, as linked to a further impairment of GCR capacity, impacts the capability of T1D subjects to tolerate a structured metabolic challenge and alters glucose variability for several days after the intervention.
Results showed that subjects with the highest number of hypoglycemic events in the 2 weeks before the challenge (Group 3) had an increased risk of experiencing hypoglycemia, as measured by postchallenge LBGI, in the 3 days following the intervention. Conversely, subjects less exposed to hypoglycemia in the 2 weeks preceding the challenge were not significantly affected by its occurrence. These findings confirm the general body of evidence that recurrent hypoglycemia is in itself a risk factor for future hypoglycemic exposure; and furthermore they show that for the most at risk subjects, a single critical metabolic intervention is able to impact glucose control at home for up to 3 days following the event. Our analysis also showed that subjects in Group 3 had less GCR capacity as measured by glucagon concentration fold-increase during induced hypoglycemia. Despite loss of glucagon response being widely reported to occur early in the course of T1D, these results suggest that minor, transient changes in GCR may happen at later stages of the disease and appear to be related to recent history of hypoglycemia.
While all subjects in the study had comparable age, duration of diabetes, and years spent on pump therapy, those with the highest frequency of hypoglycemia had significantly lower HbA1c and higher number of years of diabetes not treated with pump therapy. Specifically, years not on pump was considered within a multiple regression model to predict short-term postchallenge LBGI, and resulted to be a significant predictor of the dependent variable together with prior exposure to hypoglycemia. Based on the latter finding and on the significant correlation between years not on pump and general exposure to hypoglycemia, we can speculate that immediate postdiagnosis treatment choices may have a lasting impact on the glycemic control of patients with T1D. To test this hypothesis, further studies are being designed, which aim at drawing the relationship between insulin therapy and progression of the impairment of the glucose-insulin regulation system in T1D. While statistically powered (90% power for a moderate, 0.3, effect size), our study was limited in scope (less than 30 participants) and focused on insulin pump users, willing to frequently measure glucose levels and participate in a month long study. Generalization to the broader T1D population, especially multiple daily injections users, would warrant further studies, and of particular interest would be exploring the relation between treatment paradigm (pump vs pen) and sensitivity to the challenge.
Footnotes
Abbreviations
BG, blood glucose; CR, counterregulation; CRU, Clinical Research Unit; GCR, glucagon counterregulation; HbA1c, glycated hemoglobin; LBGI, low-blood glucose index; SH, severe hypoglycemia; SMBG, self-monitoring of blood glucose; T1D, type 1 diabetes.
Declaration of Conflicting Interests
The author(s) declared the following potential conflicts of interest with respect to the research, authorship, and/or publication of this article: CF, LSF, and RMN have nothing to declare. SMA consults for Senseonics, and has received research support from Medtronic and InSpark Technologies, Inc. BPK consults for Astra Zeneca, Becton, Dickinson, and Company, and Sanofi-Aventis; has received research support from Animas, Inc, BD, Dexcom, Insulet, Roche Diagnostics, Sanofi-Aventis, and Tandem Diabetes Care; and holds equity in InSpark Technologies, Inc, and TypeZero Technologies. MDB consults for Roche Diagnostics, Sanofi-Aventis, and Ascensia; has received research support from BD, Roche Diagnostics, Sanofi-Aventis, and Tandem Diabetes Care; and holds equity in TypeZero Technologies.
Funding
The author(s) received no financial support for the research, authorship, and/or publication of this article.