
Abstract
Objectives:
The prevalence of cardiovascular risk factors among patients with type 1 diabetes is underestimated. This study was conducted to assess the cardiovascular risk by comparing arterial stiffness in type 1 diabetes with that of controls.
Research design and methods:
Thirty-one type 1 diabetes patients and 31 age- and gender-matched controls were included. The brachial-ankle pulse wave velocity (ba-PWV) was measured using Periscope, a noninvasive device.
Results:
The ba-PWV was found to be significantly elevated among the patients with diabetes (1177.09 ± 180.1 cm/s) when compared with the controls (1057.99 ± 95.8 cm/s) (P = .003). The ba-PWV showed positive correlation with age (r = .43, P = .014), heart rate (r = .49, P = .005), blood pressure (r = .65, P < .001), and LDL (r = .46, P = .008) among patients with diabetes. Linear regression analysis revealed that diabetes, age, systolic blood pressure (SBP), and BMI were independently associated with ba-PWV (R2 = .589). On subdividing the diabetes cohort into quintiles for LDL and SBP, a substantial increase in ba-PWV was seen at LDL > 102 mg/dl (1187.8 cm/s to 1364.9 cm/s, P = .09) and SBP > 130 mmHg (1176.1 cm/s to 1369.4 cm/s, P = .03).
Conclusions:
Arterial stiffness as assessed by ba-PWV is significantly increased among patients with type 1 diabetes compared to healthy controls, independent of traditional cardiovascular risk factors. Early screening for arterial stiffness using a cheap and effective method among patients with SBP > 130 mmHg and LDL > 102 mg/dl may help identify those with heightened cardiovascular risk.
The increase in cardiovascular risk associated with type 2 diabetes mellitus is a well-established and widely known fact. However, the increase in relative risk of cardiovascular disease (CVD) in patients with type 1 diabetes mellitus is less well known. In fact, data suggest that there may be a 10-fold increase in cardiovascular risk in patients with type 1 diabetes when compared to healthy population, particularly among women. 1 CVD continues to be the major cause of mortality in these patients. 2
Arterial stiffness is an early manifestation of adverse structural and functional derangements within the vessel wall. Changes in the arterial stiffness may be detected long before the occurrence of any cardiovascular event. 3 Among the various noninvasive methods available to measure arterial stiffness, assessment of pulse wave velocity (PWV) is the most validated and is presumed to represent the gold standard. It has also been shown in several studies to be accurate and reproducible. The aortic PWV has been identified as an independent predictor of cardiovascular events and mortality in the general population, in the elderly, in hypertensive patients, in patients with chronic kidney disease, and in patients with type 2 diabetes.4-6
The main objective of the current study was to assess the occurrence of increased arterial stiffness in patients with type 1 diabetes when compared to healthy controls using a simple, noninvasive tool which measures the brachial-ankle pulse wave velocity (ba-PWV). We also assessed the factors contributing to the increase in arterial stiffness like the degree and duration of hyperglycemia, blood pressure, and cholesterol levels.
Research Design and Methods
The study population included 31 patients who had had type 1 diabetes for a period of at least 5 years duration and were recruited from our outpatient clinic at St John’s National Academy of Health Sciences between August 2012 and January 2014. All patients included in the study were free of any evidence suggestive of an underlying CVD based on clinical examination at the time of the study. Patients with traditional risk factors that were likely to significantly affect arterial stiffness were also excluded. This included renal failure, defined as estimated glomerular filtration rate (eGFR) less than 60 ml/min, blood pressure recordings above 160/100 mmHg, low density lipoprotein cholesterol (LDL-c) levels above 160 mg/dl and current smoking (smoking in the past 6 months). Equal numbers of age- and gender-matched healthy volunteers were recruited as controls for the study. Similar exclusion criteria were applied for the control group as well. Informed consent was obtained from all participants. The study protocol was approved by the institute ethical review board at St John’s National Academy of Health Sciences.
All the patients and controls underwent testing in the Department of Endocrinology at St John’s National Academy of Health Sciences. All subjects were asked to refrain from eating and consuming caffeinated beverages for at least 3 hours prior to testing. The testing was done after a period of resting for 5 to 10 minutes in a quiet room. The PWV measurements were done using Periscope, a medical device developed by Genesis Medical Systems (Hyderabad, India). Periscope is a validated and tested medical device that can be used to noninvasively measure the ba-PWV and derive a calculated carotid-femoral PWV. It uses 4 blood pressure cuffs (tied in each of the 4 limbs) to assess the pulse wave forms and 2 channel electrocardiogram (ECG) leads to simultaneously record ECG. Based on the ECG recordings and the arterial pressure wave forms measured using the oscillometric method, the device calculates the pulse transit time and the PWV. 7 It is a fully automated machine which is operator independent. Both the interobserver and interperiod coefficient of variation for the Periscope has been shown to be less than 20% in a previous study. 7 The validity of the Periscope method was demonstrated recently in a study which compared results obtained by this device with those obtained by SphymoCor, an internationally accepted device for PWV analysis and arterial stiffness assessment. 8
Contraction of the left ventricle of the heart generates a pulse wave that is propagated throughout the arterial tree starting from the aorta to the peripheral arterioles. The PWV is calculated as the distance traveled by this pulse wave divided by the time taken to travel the distance. It can be calculated across any arterial segment between 2 palpable pulse waves, for example, carotid femoral PWV (CF-PWV) or ba-PWV. PWV is inversely correlated with vascular compliance. Therefore, the pulse wave generated by the cardiac contraction will travel faster through a stiffer vessel when compared to a more distensible artery. The ideal way to measure PWV would be to assess the CF-PWV as it directly estimates the central PWV of the large elastic arteries. However, this method is inconvenient as it needs special expertise to perform the procedure and it also involves exposing the inguinal region for femoral pulse wave analysis. As a surrogate marker, ba-PWV has been utilized instead of the CF-PWV as this test is simple to perform and only requires wrapping blood pressure cuffs on all 4 limbs. 9 Studies have demonstrated a close correlation between ba-PWV with aortic PWV and CF-PWV, facilitating its utility as a reliable marker of systemic arterial stiffness. 10
The pulse wave propagated forward from the heart gets reflected back on encountering resistance (at bifurcation of vessels or from smaller resistance vessels). Normally, the reflected wave reaches the aortic root during the diastolic phase of the cardiac cycle and facilitates coronary arterial blood flow by increasing the aortic diastolic pressure. When arterial stiffness is increased, the pulse wave gets reflected prematurely and reaches the aortic root early in the cardiac cycle and contributes to an increase in aortic systolic pressure, a decrease in aortic diastolic pressure, and an increase in the aortic pulse pressure. This rise in aortic systolic pressure is termed as augmentation pressure and the ratio of the augmentation pressure to the aortic pulse pressure is called augmentation index (AIx). 11 Both PWV and AIx have been found to useful as markers of arterial stiffness in clinical studies. Using ECG recordings and peripheral wave forms (brachial and ankle), the Periscope generates measures of ba-PWV, CF-PWV, and AIx.
All subjects were evaluated in supine position. Four ECG electrodes were placed and 4 blood pressure measuring cuffs were wrapped around each of the 4 limbs. Measurements not achieving the automatic quality controls specified by the Periscope company software were rejected. Finally, recordings of anthropometric parameters like height, weight, waist circumference and hip circumference were done and BMI was calculated. Height was measured in centimeters (cm) by having the subjects stand against a stadiometer with their heels, buttocks and head touching the vertical axis of the stadiometer and the head held in the Frankfurt plane. Weight was measured in kilograms (kg) using a standard portable weighing scale. The waist and hip circumference were measured according to the recommendation provided by WHO. 12 Waist circumference was measured in cm using a measuring tape at the midpoint between the iliac crest and lower costal margin at end expiration. Hip circumference was measured in cm using a measuring tape around the pelvis at the point of maximal protrusion of buttocks. Waist–hip ratio was calculated by dividing the waist circumference by the hip circumference. Biochemical assays for glycated hemoglobin (HPLC method; BIO-RAD) and LDL-c levels (enzymatic method—bichromatic endpoint) were done in all patients and controls.
Analysis
Data are presented as mean with SD for variables that are normally distributed or as median with interquartile range for variables that are not normally distributed. All data were tested for normality using the Kolmogorov–Smirnov test. Data were analyzed using the independent samples Student’s t test or Mann–Whitney U test for comparison of quantitative variables. Multiple regression analysis was done to estimate the strength of association between arterial stiffness and the various variables studied. Analysis of variance (ANOVA) models were used to assess for differences in arterial stiffness indices among quintiles of LDL-c and systolic blood pressure (SBP). The analysis was done using SPSS software (version 18). A P value of less than .05 was considered as statistically significant.
Results
We evaluated 31 patients with T1DM, aged 26.61 ± 6.92 years (mean ± SD, range 18-44) and 31 age- and gender-matched healthy controls (n = 62). There were no significant differences in height, weight, BMI, blood pressure, or LDL-c levels between the 2 groups. Their clinical and biochemical characteristics are summarized in Table 1. The average HbA1c among patients with diabetes was 9.79 ± 3.17% (range 5.2-17.7), and duration of diabetes was 10 ± 5 years (range 5 to 28 years; median 7.5 years). Among the 31 patients with diabetes, 3 patients were on levothyroxine replacement therapy for primary hypothyroidism. All patients were euthyroid at the time of participating in the study. None of the patients had any associated illnesses like hypertension or dyslipidemia requiring medications. One patient with diabetes had moderate nonproliferative diabetic retinopathy (NPDR); however, none of the patients included in the study had micro-albuminuria or elevated creatinine.
Comparison of Clinical Characteristics Between Cases and Controls.
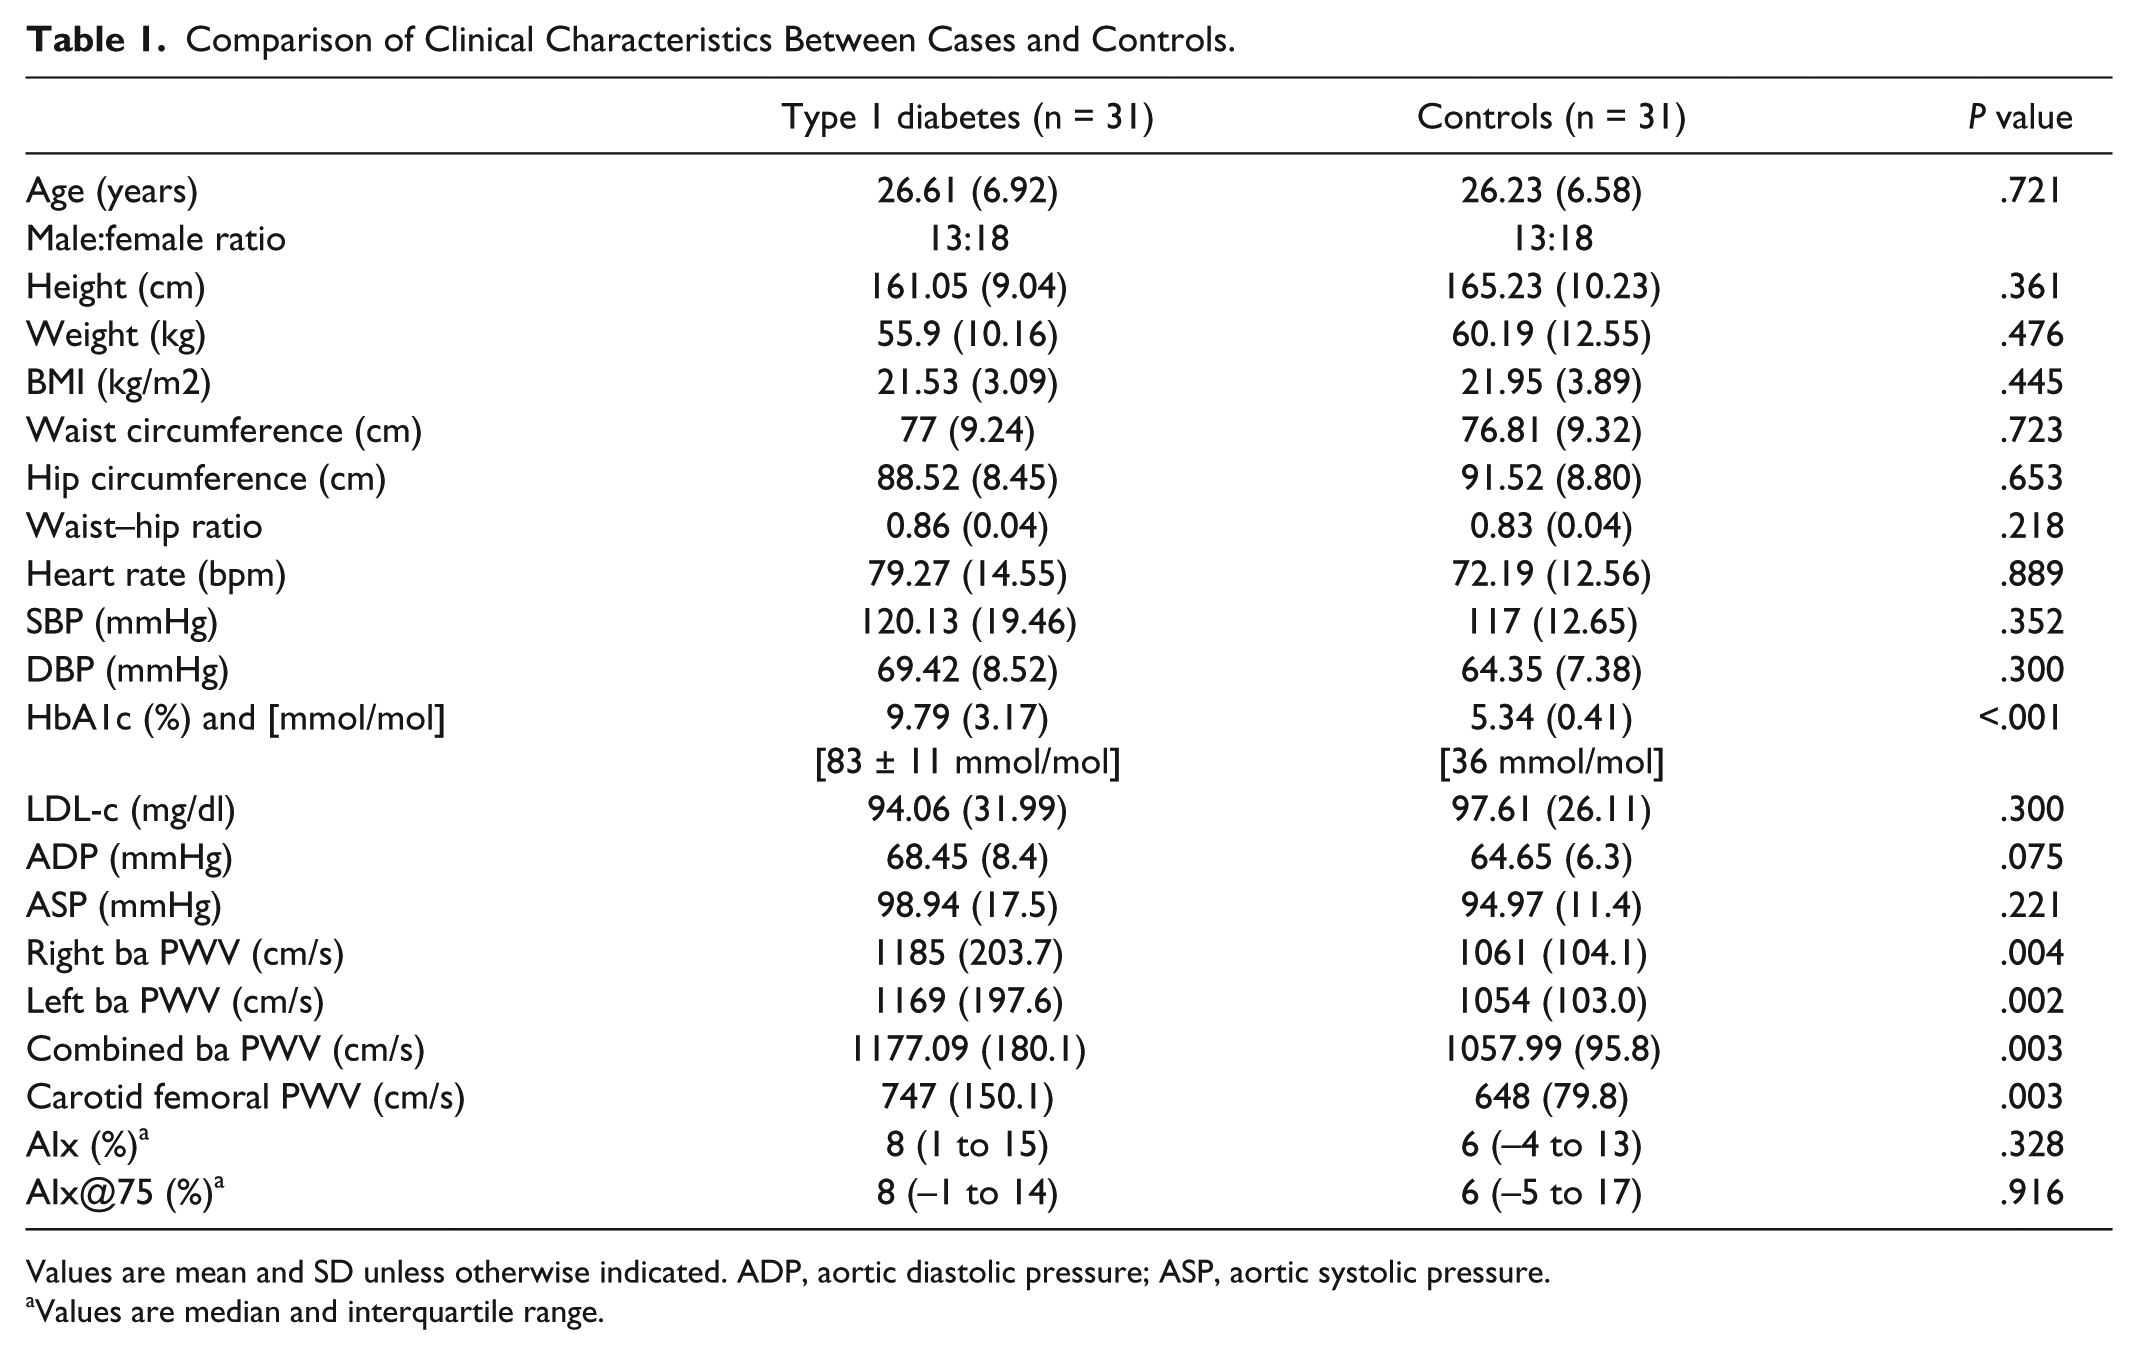
Values are mean and SD unless otherwise indicated. ADP, aortic diastolic pressure; ASP, aortic systolic pressure.
Values are median and interquartile range.
Though the peripheral systolic pressure, the peripheral diastolic pressure, the aortic systolic pressure, and the aortic diastolic pressure were slightly higher among the patients with T1DM, they did not significantly differ between the 2 groups. The indices of arterial stiffness that were assessed included the ba-PWV of both right and left arterial system and the derived values for CF-PWV and AIx. The pulse wave velocities were found to be significantly elevated among the patients with diabetes when compared with the control population (P < .05). The AIx did not differ between the 2 groups even after correction for heart rate (AIx@75), however, this discrepancy has been reported before. 13
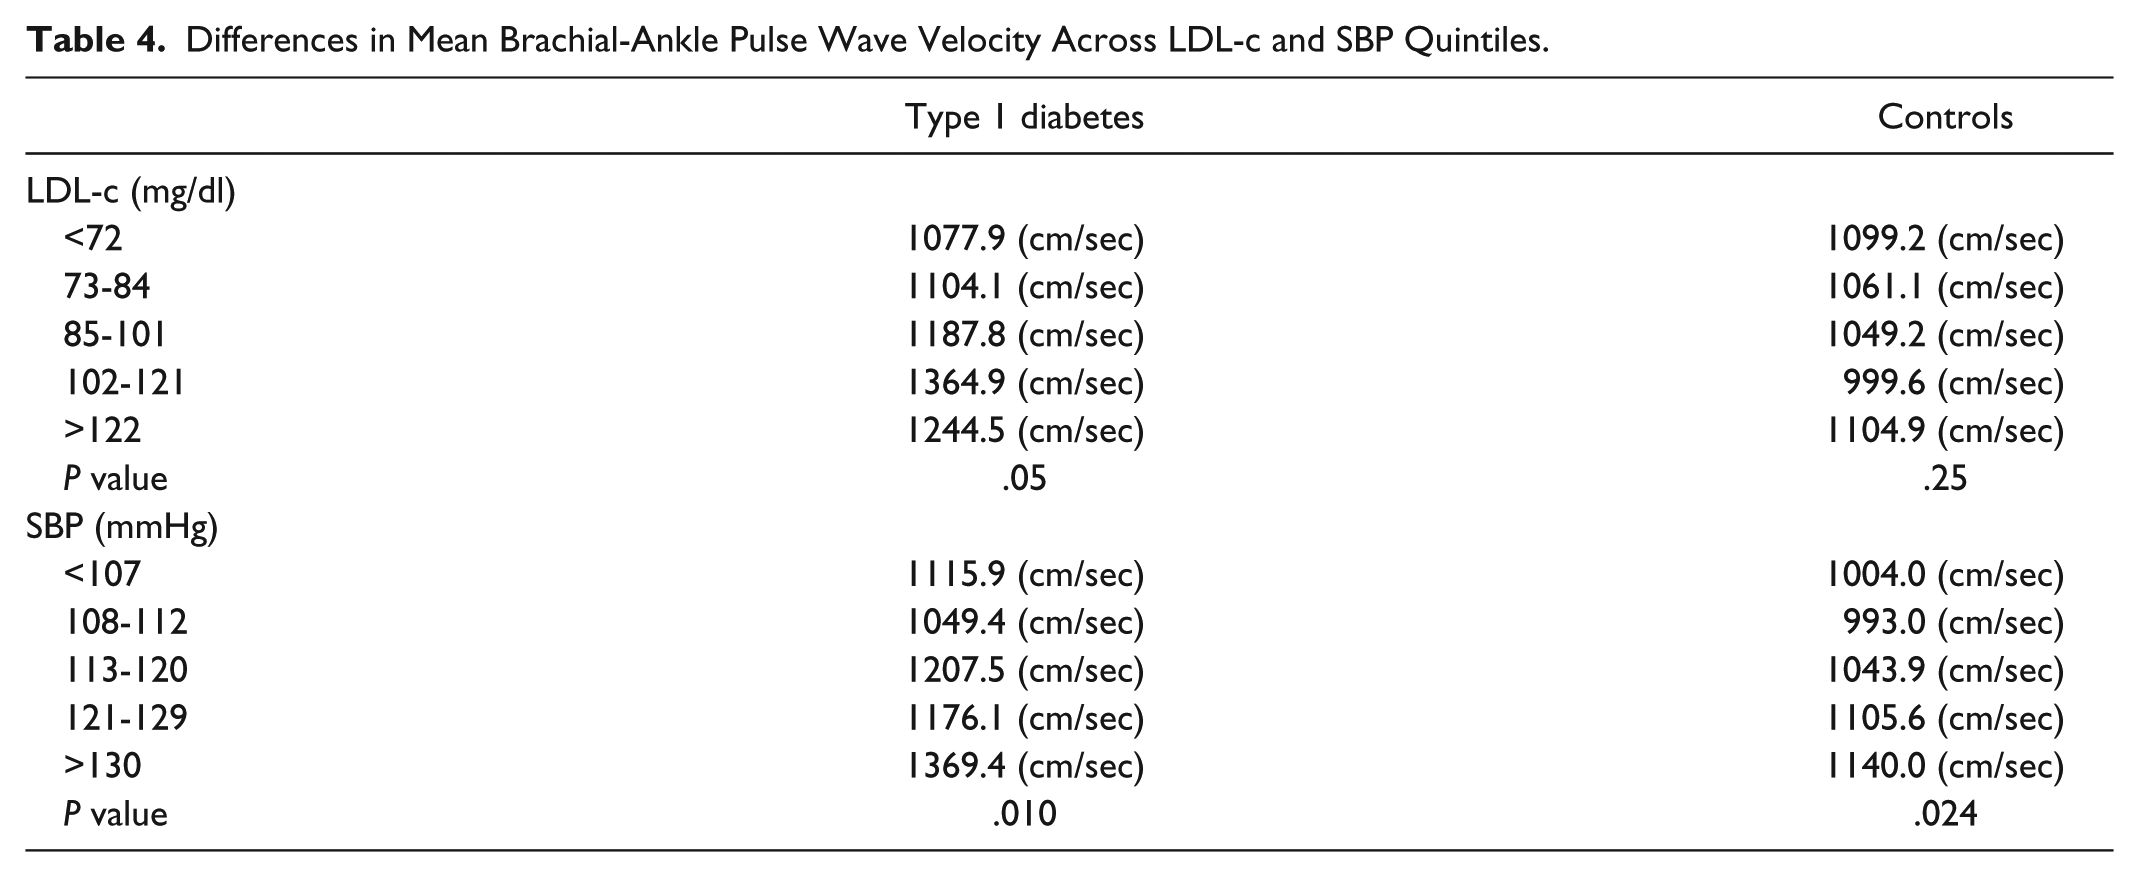
Mean ba-PWV (average of right ba-PWV and left ba-PWV) was used for final analysis because of a significant positive correlation between left and right ba-PWV (r = .913, P < .001). Among patients with diabetes, univariate correlations showed that ba-PWV was positively associated with age, heart rate, systolic and diastolic blood pressures, and LDL-c (Table 2). Among healthy controls, the ba-PWV was positively correlated with age, height and systolic and diastolic blood pressures. To ascertain the parameters that may have contributed independently to the increased arterial stiffness in this population, linear regression analysis was done using the ba-PWV as the dependent variable. The parameters entered into the regression model included type 1 diabetes, age, BMI, heart rate, SBP, and LDL-c levels. Type 1 diabetes, age, SBP, and BMI were found to be significant independent predictors of ba-PWV. Based on the model, the significant variables were estimated to account for 59% of the total variability in ba-PWV (Table 3). There was no difference in the results on analyzing the data separately for men and women. Further analysis was done using ANOVA models after dividing the cases and controls separately into quintiles for LDL-c and SBP to assess the differences in ba-PWV (Table 4). A substantial increase in ba-PWV was seen at LDL-c levels above 102 mg/dl and SBPs greater than 130 mmHg among patients with diabetes.
Pearson’s Correlation for Brachial-Ankle Pulse Wave Velocity and Cardiovascular Risk Factors.
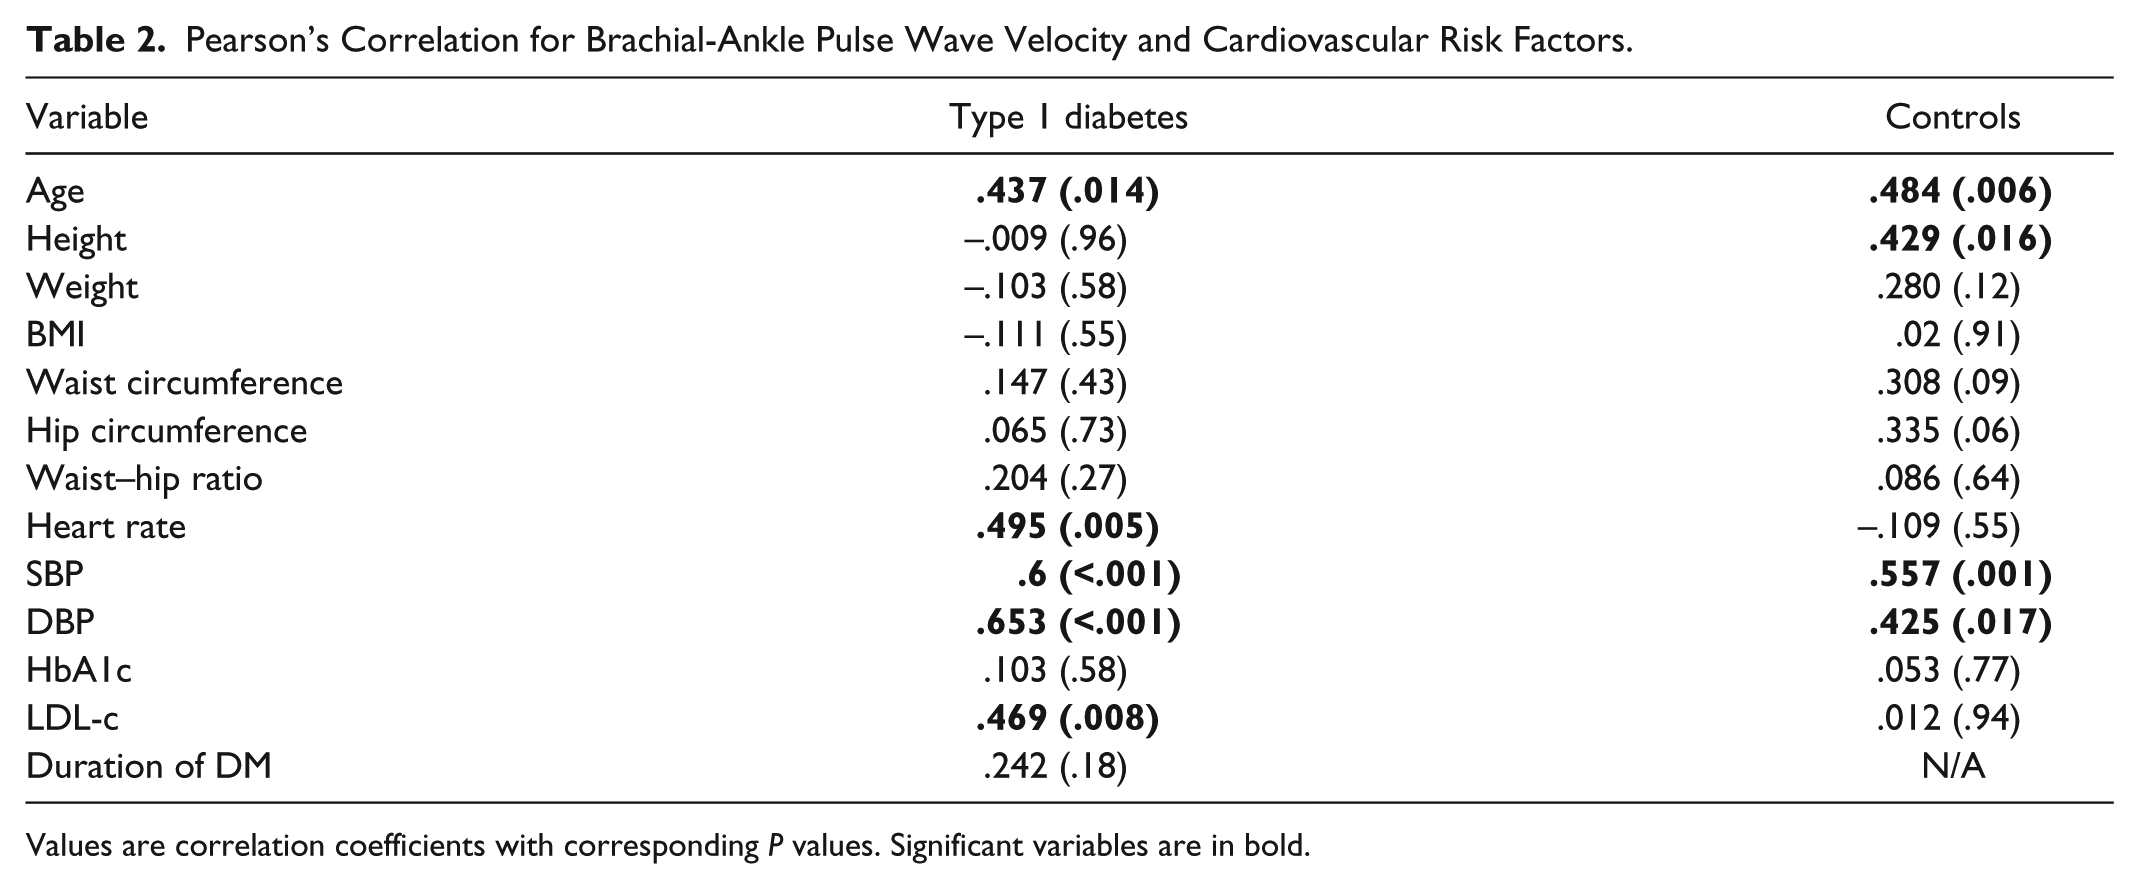
Values are correlation coefficients with corresponding P values. Significant variables are in bold.
Linear Regression Analysis in the Study Population.
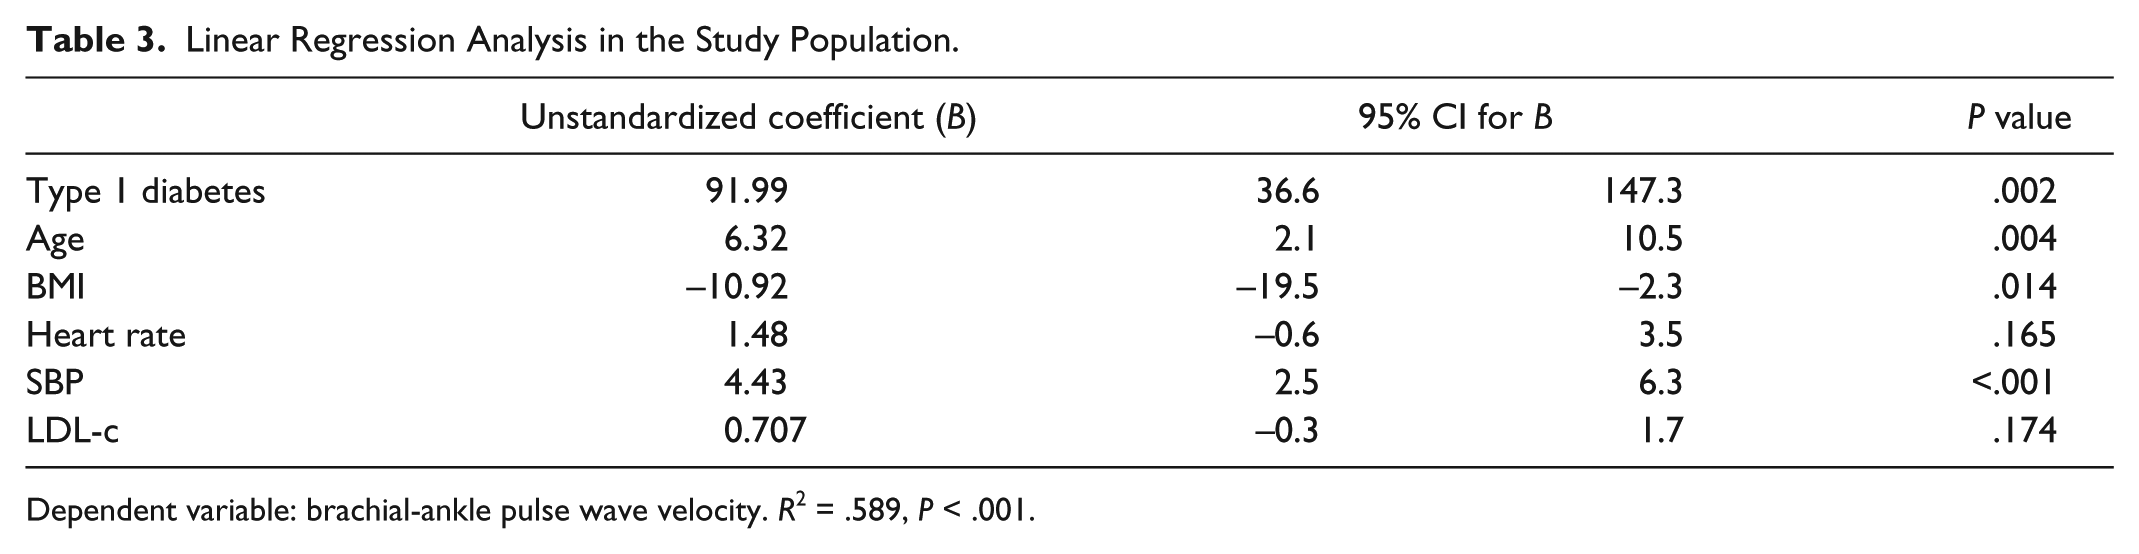
Dependent variable: brachial-ankle pulse wave velocity. R2 = .589, P < .001.
Differences in Mean Brachial-Ankle Pulse Wave Velocity Across LDL-c and SBP Quintiles.
Discussion
Our main finding was that the ba-PWV, a measure of arterial stiffness, was significantly higher among a group of patients with type 1 diabetes when compared to age- and gender-matched healthy controls. This measurement was done using a relatively new medical device, the Periscope, which is a simple, easy-to-use device that is available locally, and hence is cost-effective. This machine acquires bilateral brachial and ankle arterial wave forms, measures the peripheral blood pressures, and obtains the electrocardiogram recordings simultaneously; and using these data, it calculates the ba-PWV. The gold standard method of assessing arterial stiffness is considered to be direct measurement of the CF-PWV. However, this is inconvenient, expensive, and available only in specialized centers. Also, studies have shown a strong positive correlation between CF-PWV and ba-PWV, suggesting that the latter may be used as a surrogate marker with enough confidence. 10
The derived value of CF-PWV also showed a statistically significant difference between the 2 groups in our study, and as expected was elevated among the patients with diabetes. However, the AIx, which gives a measure of the contribution of the reflected wave to the aortic systolic pressure, was not significantly different between the 2 groups. Due to increased arterial stiffness and elevated PWV, the reflected wave is expected to reach earlier and augment the ascending aortic pressure. Hence, in the presence of increased PWV, one would expect the AIx to be higher.
There are few possible explanations for this discrepancy. The relatively young age of the subjects studied (mean age 26 years) and the small sample size may have contributed to this finding. Even in the presence of increased PWV, the AIx or the central aortic systolic pressure may not be elevated in the initial stages and in younger subjects. Given the low mean age of 26 years in our study population, this may be the most likely reason for lack of significant increase in the AIx. Moreover, diabetes is considered to be an independent predictor of PWV, but not AIx. In a previous study by Lacy et al, which compared the relationship between PWV and AIx in patients with and without DM, they found a significant elevation in PWV in patients with DM; however, there was no increase in AIx. 13 This observation persisted irrespective of diabetes type, arterial site, and presence or absence of anti hypertensive medication. They concluded that AIx is a poor marker of arterial stiffness in patients with diabetes. Brooks et al have reported a significant increase in AIx in patients with type 1 diabetes, but this difference was not apparent initially and appeared only after adjustment for various confounding factors. 14 In the current study, AIx was higher among the patients with diabetes (mean value in cases 7.84; mean value in controls 4.65) when compared to controls, even though these values did not reach statistical significance.
The factors that are known to affect PWV in general are age, height, smoking, tachycardia, hypertension, dyslipidemia, diabetes, underlying CVD and renal failure. 15 In the current study, both the groups had similar baseline values for all the above mentioned parameters including age, height, smoking, heart rate, blood pressure, and LDL-c levels. The only significant variable was the presence or absence of type 1 diabetes. Hence, the observed difference between the 2 groups in PWV is likely to be related to diabetes and unlikely to be contributed to by any of the known traditional risk factors affecting arterial stiffness. The common soil hypothesis suggests that the insulin resistance associated with type 2 diabetes, hypertension, dyslipidemia and obesity may be due to underlying oxidative stress; and this has been postulated to be the key contributor to the increase in cardiovascular morbidity and mortality seen in this population. 16 In contrast, in patients with type 1 diabetes, where hyperinsulinemia is absent, the pathophysiological mechanisms underlying CVDs are not well understood. Hyperglycemia per se may lead to accelerated atherosclerotic changes resulting in a diabetic vasculopathy. This may be attributed, in part, to known mechanisms like activation of inflammatory transcription factors and cytokines, increase in oxidative stress and elevation of advanced glycation end product (AGE) levels, which are capable of altering the matrix molecules of the vessel wall.17,18
The univariate correlation analysis showed positive correlation between ba-PWV and age, heart rate, blood pressure and LDL-c among patients with T1DM. The HbA1c levels and duration of diabetes, however, did not show a positive correlation. This may be due to the fact that the measure of glucose control used in a cross sectional sample (in this case, HbA1c) may not appropriately represent the overall effects of hyperglycemia over a period of time. Also, in several previous studies on T1DM, HbA1c has not been shown to correlate significantly with arterial stiffness. 19 The duration of diabetes also did not show a significant correlation, and the probable reason for that is the small sample size that was studied and the larger number of patients with shorter duration of disease (one half of the study population had diabetes for less than 7.5 years). Multiple linear regression analysis that was done in the entire study population also confirmed type 1 diabetes to be an independent predictor of ba-PWV, with other significant associations noticed with age, SBP, and BMI. Based on the ANOVA results, which showed a substantial increase in the ba-PWV among patients with diabetes at LDL-c levels above 102 mg/dl and a SBP of more than 130 mmHg, we would suggest that patients falling into this category will benefit from aggressive evaluation of cardiovascular status.
Our study is in agreement with previous studies done in type 1 diabetes, which has shown the increased occurrence of arterial stiffness in this population.19-23 However, most of these studies have used applanation tonometry to assess the PWV, which, as explained earlier, is user dependent and requires special expertise and skill and may not be easily available. In this study, we have a used a simple and cost-effective method to assess the ba-PWV, which is an accepted marker of arterial stiffness in patients with diabetes mellitus. This study used an operator independent, fully automated machine which provides in built quality control standards that may be of assistance in interpreting the results. In the context of significant cardiovascular morbidity and mortality associated with type 1 diabetes, it is important to have efficient screening tools that can predict occurrence of cardiovascular events.
Elevated PWV and increased arterial stiffness are early markers of vascular dysfunction that may aid us in identifying and treating at risk individuals. Improved glycemic control coupled with optimal blood pressure and dyslipidemia management have been shown to be an effective strategy in reversing arterial stiffness if initiated early in the course of the disease in patients with type 2 diabetes.24,25 However, similar studies proving efficacy of early intervention in normalizing the arterial stiffness in patients with type 1 diabetes are lacking. Studies like DCCT and EDIC have shown benefits of early intervention in type 1 diabetes for occurrence of macrovascular disease and in slowing the progression of carotid intima medial thickness.26,27
This study did have certain limitations. The cross sectional nature of the study has not allowed assessment of progression of arterial stiffness in this population. A recent longitudinal study has demonstrated worsening of arterial stiffness at a significantly higher rate in patients with type 1 diabetes when compared to controls. 23 Also, as there is no clear evidence of benefit from therapy in improving arterial stiffness in patients with type 1 diabetes, hence an intervention study would have addressed this significant issue. The strength of the study is the control population who were well matched for almost all known factors that may contribute to increase in arterial stiffness. To the best of our knowledge, this is the first study to report occurrence of increased arterial stiffness in a population of patients with type 1 diabetes compared to age-, gender-, and weight-matched controls from India (using a locally available low-cost device).
Conclusion
In summary, we have confirmed in this study the significant association between type 1 diabetes and worsening of arterial stiffness. In addition, we have demonstrated a simple and cost-effective way to assess arterial stiffness to identify type 1 diabetes patients with increased cardiovascular risk. The evaluation for increased arterial stiffness may be selectively done in those subset of patients with high SBP (>130 mmHg) and high LDL-c levels (>102 mg/dl) as these patients are more likely to have hyperglycemia-related arterial disease.
Footnotes
Acknowledgements
We thank Mrs. Sumithra Selvam and Mrs. Tinku Thomas of St John’s Research Institute for their help in the statistical analysis of our data.
Abbreviations
ADP, aortic diastolic pressure; AIx, augmentation index; ANOVA, analysis of variance; ASP, aortic systolic pressure; ba-PWV, brachial ankle pulse wave velocity; BMI, body mass index; CF-PWV, carotid femoral pulse wave velocity; CVD, cardiovascular disease; DBP, diastolic blood pressure; DCCT, diabetes control and complications trial; DM, diabetes mellitus; ECG, electrocardiogram; EDIC, epidemiology of diabetes intervention and complications; eGFR, estimated glomerular filtration rate; HbA1c, glycated hemoglobin; HPLC, high performance liquid chromatography; LDL-c, low-density lipoprotein cholesterol; NPDR, nonproliferative diabetic retinopathy; PWV, pulse wave velocity; SBP, systolic blood pressure; T1DM, type 1 diabetes mellitus.
Declaration of Conflicting Interests
The author(s) declared no potential conflicts of interest with respect to the research, authorship, and/or publication of this article.
Funding
The author(s) received no financial support for the research, authorship, and/or publication of this article.