
Abstract
Background:
A widely used method in monitoring glycemic status of ICU patients is point-of-care (POC) monitoring devices. A possible limitation to this method is altered peripheral blood flow in patients in shock, which may result in over/underestimations of their true glycemic status.
Methods:
This study aims to determine the accuracy of blood glucose measurements with a POC meter compared to laboratory methods in critically ill patients in shock. POC blood glucose was measured with a glucose-1-dehydrogenase-based reflectometric meter. The reference method was venous plasma glucose measured by a clinical chemistry analyzer (glucose oxidase-based). Outcomes assessed were concordance to ISO 15197:2003 minimum accuracy criteria for glucose meters, bias in glucose measurements obtained by the 2 methods using Bland–Altman analysis, and clinical accuracy through modified error grid analysis.
Results:
A total of 186 paired glucose measurements were obtained. ISO 2003 accuracy criteria were met in 95.7% and 79.8% of POC glucose values in the normotensive and hypotensive group, respectively. Mean bias for the normotensive group was –12.4 mg/dL, while mean bias in the hypotensive group was –34.9 mg/dL.
Conclusions:
POC glucose measurements within the target zone for clinical accuracy were 90.2% and 79.8% for the normotensive and hypotensive group, respectively. POC blood glucose measurements were significantly less accurate in the hypotensive subgroup of ICU patients compared to the normotensive group. We recommend a lower threshold in confirming POC blood glucose with a central laboratory method if clinically incompatible. In light of recently updated accuracy standards, we also recommend alternative methods of glucose monitoring for the ICU population as a whole regardless of blood pressure status.
Maintaining normoglycemia is an important aspect in critical care, for patients with established diabetes or stress-induced hyperglycemia. Hyperglycemia has been shown to have detrimental effects in such patients,1-3 and appropriate treatment has been shown to reduce mortality and admission duration, prevent acute renal injury, and provide faster weaning from mechanical ventilation.1,2,4 On the other hand, hypoglycemia also has its associated adverse effects 5 and has been shown to be an independent predictor of mortality in several studies.6,7
Accordingly, several organizations have proposed their own target blood glucose levels for ICU patients.8,9 To achieve these goals, many local ICU’s and hospital wards utilize point-of-care (POC) glucose meters in monitoring glycemic status. These provide portability, ease of use, and readily available results; important in patients requiring tight glycemic control where delayed central laboratory results make rapid adjustments in therapy impractical. Most of these meters have established accuracy in stable outpatients. For critically ill patients, various confounding factors have been identified that may interfere with POC glucometry, including hematocrit, oxygenation, acid-base disturbances, temperature, and shock states.10,11
With regard to shock, several possible mechanisms may explain the discrepancies in blood glucose measurements obtained by different methods. Peripheral vasoconstriction in hypoperfusion states leads to increased glucose extraction by tissues due to low capillary flow, resulting in falsely decreased glucose measurements with capillary blood.12,13 Some studies on critically ill patients include only a small number of measurements taken from patients in shock, resulting in a heterogeneous cohort,14-22 or did not perform analysis on compliance with international accuracy standards.18,21,23 For those that performed a separate analysis on hypotensive patients, limitations include a small sample size,12,16 relatively old glucose meter technology, 12 and lack of a reference standard of glucose measurement for comparison of POC glucose meter readings. 13
Thus, this study aims to investigate the accuracy of POC glucose meter measurements in critically ill, hypotensive patients in terms of ISO 15197:2003 criteria, Bland–Altman agreement analysis, and modified error grid analysis. Results of this study may help guide future policies on ICU glucose monitoring and insulin infusion protocols in determining intervention thresholds more suitable for patients in shock.
Methods
Study Participants and Recruitment
This is a cross-sectional, criterion-referenced study conducted in the University of the Philippines–Philippine General Hospital. Subjects were recruited from adult, nonpregnant patients referred for intensive care after obtaining informed consent from primary decision makers. Patients were consecutively classified according to perfusion status. The hypotensive group included those in shock with mean arterial pressure (MAP) <70 mmHg or those requiring vasopressor support. The normotensive group included patients with MAP ≥ 70 mmHg without vasopressor support.
Exclusion criteria were hypovolemic shock due to severe active bleeding, bleeding disorders, platelet count <25,000/uL, hematocrit <20%, the use of substances known to interfere with the POC glucose meter technology used (icodextrin-containing solutions, intravenous immunoglobulins, abatacept, maltose), and lack of consent.
Participation in the study continued throughout ICU stay; provided that consent was not withdrawn, none of the exclusion criteria were fulfilled, and the maximum limit of glucose determinations was not exceeded. For patients initially recruited in the normotensive group, participation was terminated if they suffered from hypotension or require vasopressor support during their ICU stay, and vice versa.
Sample Size Calculation
A sample size of 89 patients for each group was needed to determine the percentage of POC blood glucose values concordant with the laboratory whole-blood glucose method with ±10% margin of error. This computation was based on the data from Atkin et al 12 using OpenEpi open-source calculator (version 3), with the following formula, n = [DEFF*Np(1-p)]/ [(d2/Z21-α/2*(N-1)+p*(1-p)]; where N = total population (assumed infinite), p = proportion of hypotensive POC glucose values meeting accuracy criteria in the reference study (36%), DEFF = design effect (assumed 1), d = error (10%), α = level of significance (.05).
Patient Data Collection
Pertinent patient and laboratory data were collected at baseline from chart review. Demographic data included age, sex, and anthropometric measurements. Historical data included chronic comorbidities and maintenance medications taken for the past month. Baseline clinical data noted were initial vital signs, the Glasgow Coma Scale score with derived verbal scores for intubated patients, 24 the need for ventilatory support or dialysis, and the presence of acute significant arrhythmias. The medications given during admission and admitting diagnosis were obtained by systematic chart review. Laboratory parameters recorded were arterial blood gas analysis, serum creatinine, albumin, and complete blood count. The laboratory values taken at the time most proximate to the blood glucose determination were recorded.
Blood Glucose Determinations
A pair of blood glucose measurements was performed upon recruitment, comprising 1 whole
The venous whole
Capillary blood was obtained by fingertip puncture with a lancing device and 1 drop of blood (~1 uL) tested using an Accu-Chek Active Meter (Roche Diagnostics, Indianapolis, Indiana, USA), a glucose-1-dehydrogenase–pyrroloquinolone quinone (GDH-PQQ) enzyme reaction-based, reflectometric glucose meter with plasma-corrected results. An accuracy study on outpatients with diabetes using this meter showed 100% of measurements falling within ISO 15197 minimum accuracy criteria. Intermediate precision showed a 1.9-2.3% CV; and repeatability results showed a 1.6-3.6% CV (data provided by Roche Diagnostics). This meter has also been tested on stable inpatients, with 100% concordance to ISO standards for meter accuracy and 100% clinically accurate results by Clarke error grid analysis. 25 General advantages of a GDH-based meter include decreased susceptibility to altered results due to hypoxia or oxygen therapy and pH derangements compared to glucose-oxidase based meters. 10 All blood extractions in this study followed standard procedures set by the Clinical and Laboratory Standards Institute (CLSI). 26
Important data during each blood glucose measurement such as blood pressure and ongoing vasopressor infusion rates were recorded.
Aside from baseline blood extractions, additional measurements were performed during any glucose <70 mg/dL or ≥180 mg/dL detected during routine monitoring. A maximum limit of 4 additional measurements during dysglycemia was set for each patient.
The ICU physicians and staff were oriented monthly on the study procedures and the attending physicians were also provided a summary of recommendations on blood glucose monitoring for inpatients by the American Diabetes Association (2009).
The POC glucose meters were calibrated monthly according to manufacturer’s instructions, with all tests falling within specified calibration values. No significant meter errors were encountered during the course of the study.
Outcome Measures
Concordance to minimum accuracy criteria for POC blood glucose meters set by the International Organization for Standardization (ISO) in 2003 27 was evaluated. This requires that at least 95% of POC glucose meter readings should fall within 20% of true blood glucose values if ≥75 mg/dL, or should fall within 15 mg/dL of true blood glucose values if < 75 mg/dL.
Technical accuracy was assessed by Bland–Altman graphs plotting the average between paired values of glucose values measured by the 2 methods (x-axis) versus the difference between the paired measurements (y-axis). 28 Separate plots and calculations were done for each group.
Clinical accuracy was evaluated by adapting the modified error grid analysis table of Kanji et al, 16 which categorizes measurements into 1 of several error grid analysis zones according to clinical action. The analysis zones based on the capillary blood glucose results were labeled as follows: target zone (acceptable error), hypoglycemia zone (<70 mg/dl), normoglycemia zone (70-179 mg/dl), and hyperglycemic zone (≥180 mg/dL), with subclassification whether these were over- or underestimations of the reference method values. Classification as over/underestimation was based on the intervention thresholds set by our local insulin titration protocol (Josol CV et al, unpublished data); with limits at <50 mg/dL, 50-69 mg/dL, 70-179 mg/dL, 180-249 mg/dL, and ≥250 mg/dL and corresponding interventions based on magnitude of change from the previous glucose measurement.
Data Analysis
The comparison of clinical characteristics between groups was done by Fisher’s exact test or z test for discrete variables and 2-tailed t test for continuous variables with α of .05. All continuous data were expressed as mean (SD).
Concordance to ISO 15197:2003 criteria for accuracy was expressed in proportions of values falling within various intervals following the ISO recommended format. Bland–Altman graphs for agreement were constructed using Stata/SE (version 12.0) statistical software. Tabulation of modified error grid analysis results were patterned according the study of Kanji et al, 16 and the proportions falling to the different analysis zones compared between normotensive and hypotensive groups.
Ethical Considerations
The study protocol was approved by the University of the Philippines–Manila, Research Ethics Board. Implementation of the study commenced only after approval. The investigators had no conflict of interest in any form with the manufacturers of any equipment used and adhered to the guiding principles of good clinical practice throughout the conduct of the study. A maximum of 4 additional measurements during dysglycemia was set to minimize iatrogenic blood loss. Attending physicians were immediately notified of both POC and laboratory whole
Results
A total of 180 patients were recruited from July 2013 to January 2014, composed of 89 normotensive and 91 hypotensive patients. This resulted in 186 paired glucose measurements (92 normotensive and 94 hypotensive) for analysis.
The majority of the normotensive patients had venous blood specimens obtained through peripheral venipuncture (85.4%). Most subjects in the hypotensive group also had venous blood specimens collected via peripheral venipuncture (73.6%), the remainder from central venous pressure lines (14.3%), or central vein catheters for hemodialysis access (12.1%).
The hypotensive group showed a significantly lower MAP, higher heart rate, higher respiratory rate, lower GCS score, and higher proportion requiring mechanical ventilation (Table 1), which understandably reflects a greater severity of illness compared to the normotensive group. For the baseline laboratory parameters, arterial pH was significantly lower in the hypotensive group probably due to lactic acidosis from systemic hypoperfusion. Serum albumin levels were significantly lower and leukocyte counts were significantly higher in this group, probably correlating with the degree of systemic inflammation in more critically ill patients. The rest of the clinical and laboratory parameters were comparable between the 2 groups.
Clinical Characteristics of Included ICU Patients in both Normotensive and Hypotensive Groups.
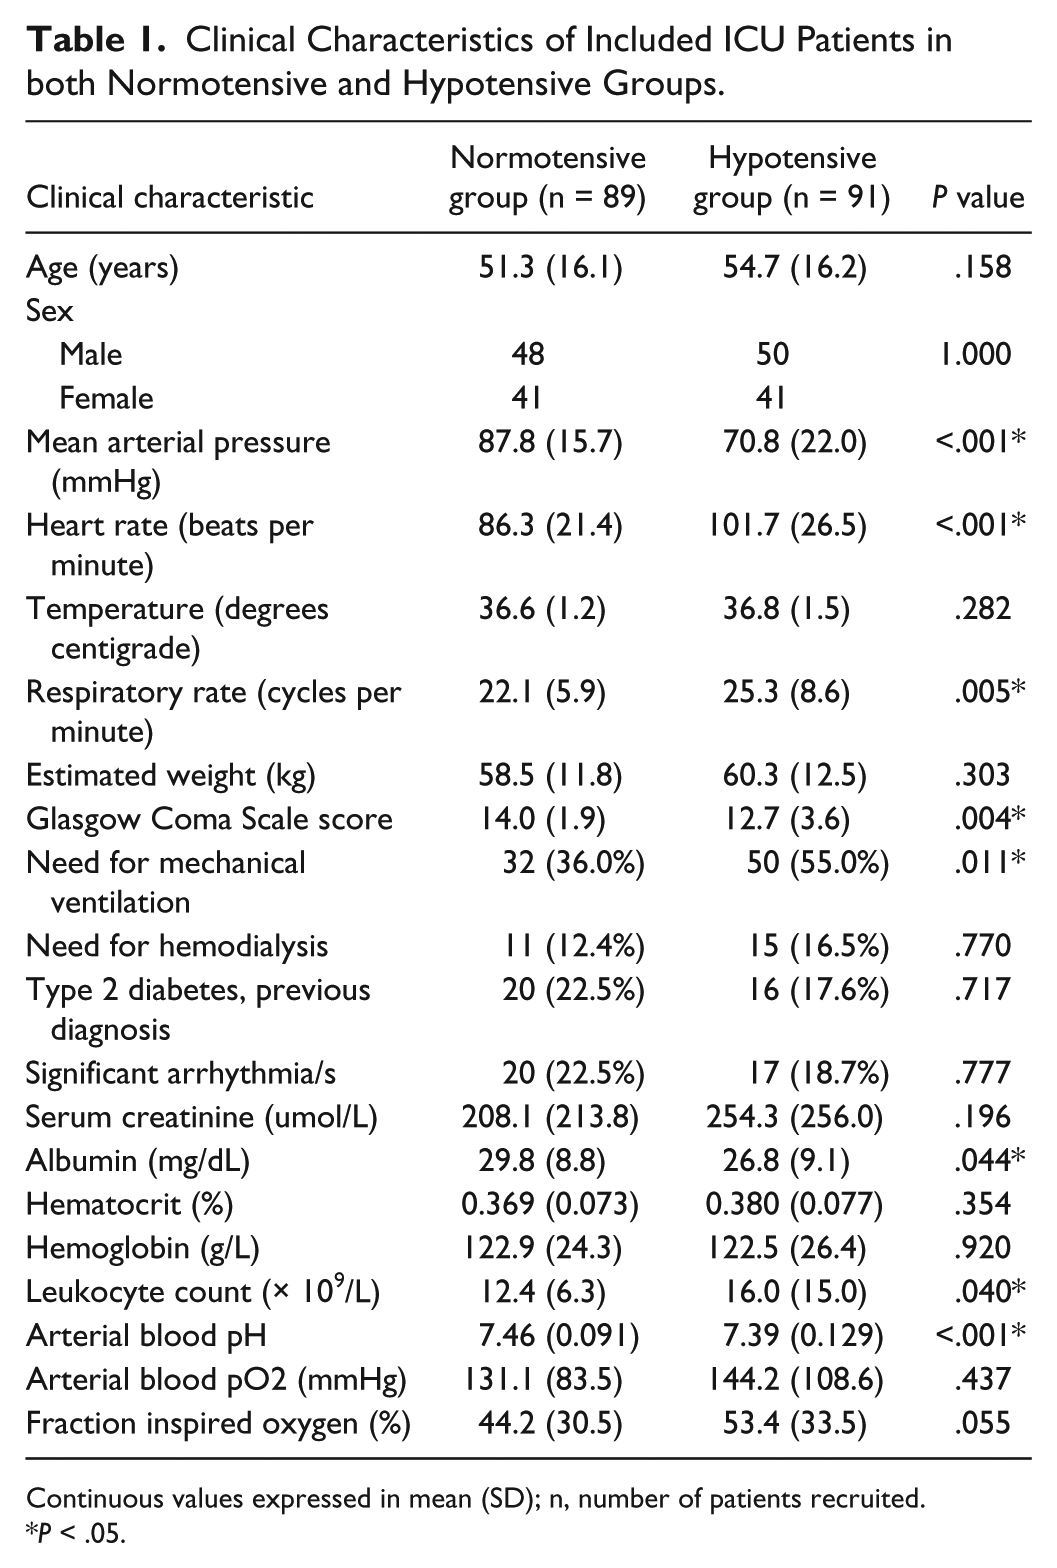
Continuous values expressed in mean (SD); n, number of patients recruited.
P < .05.
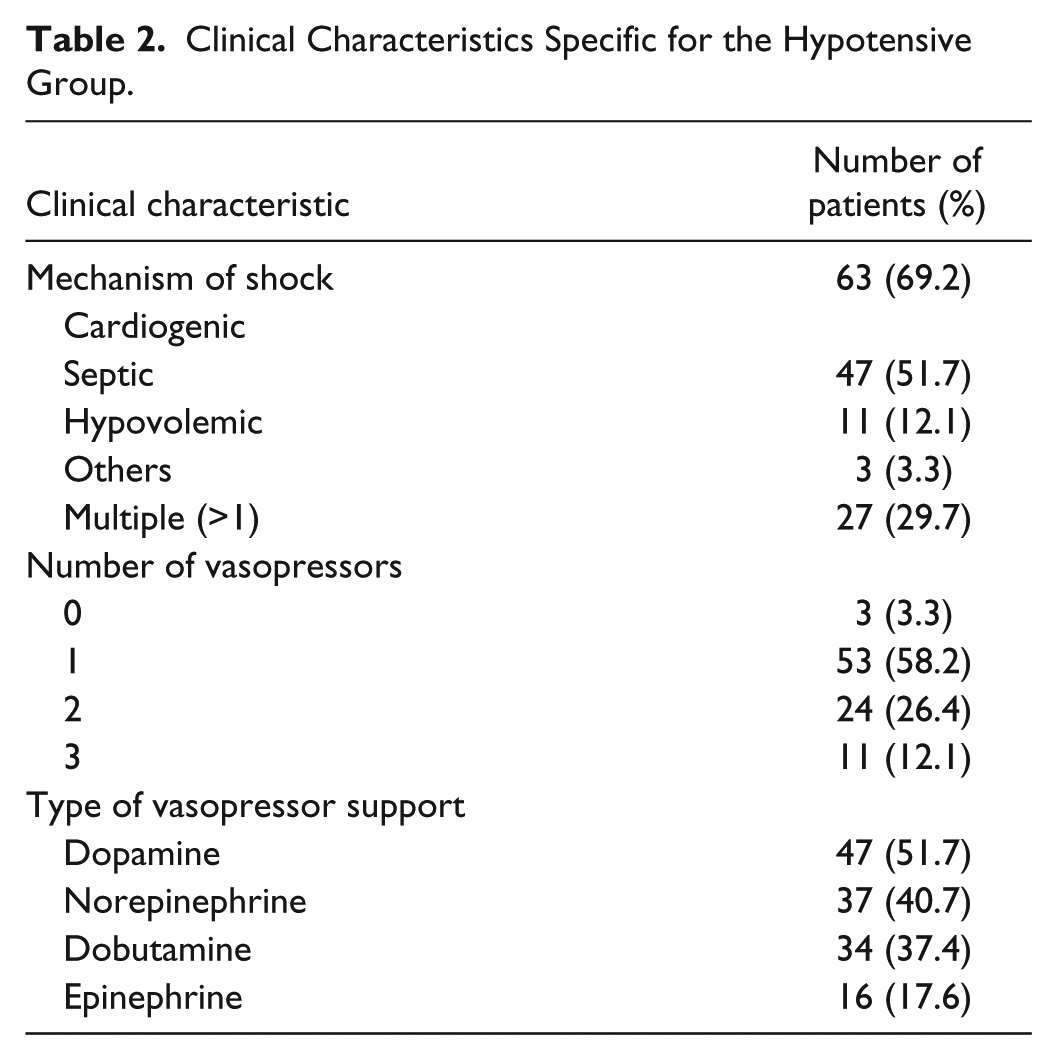
The hypotensive group (Table 2) was composed mainly of cases of cardiogenic shock (69.2%) from acute myocardial infarction, decompensated heart failure, or bradyarrhythmias, followed by septic shock (51.7%) from severe pneumonia or urosepsis. Nearly a third (29.7%) had multiple causes of shock, usually both cardiogenic and septic shock. More than half were on a single vasopressor (58.2%), and dopamine was most commonly used vasopressor (51.7%) at a mean dose of 13.1 ug/kg/min.
Clinical Characteristics Specific for the Hypotensive Group.
Concordance to ISO 2003 Criteria
The POC glucose measurements in the normotensive group met the minimum ISO 2003 accuracy criteria (Table 3). All glucose values <75 mg/dL were within 15 mg/dL of the reference method results, while 95.5% of values ≥75 mg/dL were within 20% of the reference method measurements. Grouping all measurements resulted in a 95.65% concordance to the said criteria.
System Accuracy Results of Capillary Blood POC Glucose Measurements Grouped According to Glucose Concentrations <75 mg/dL and ≥75 mg/dL.
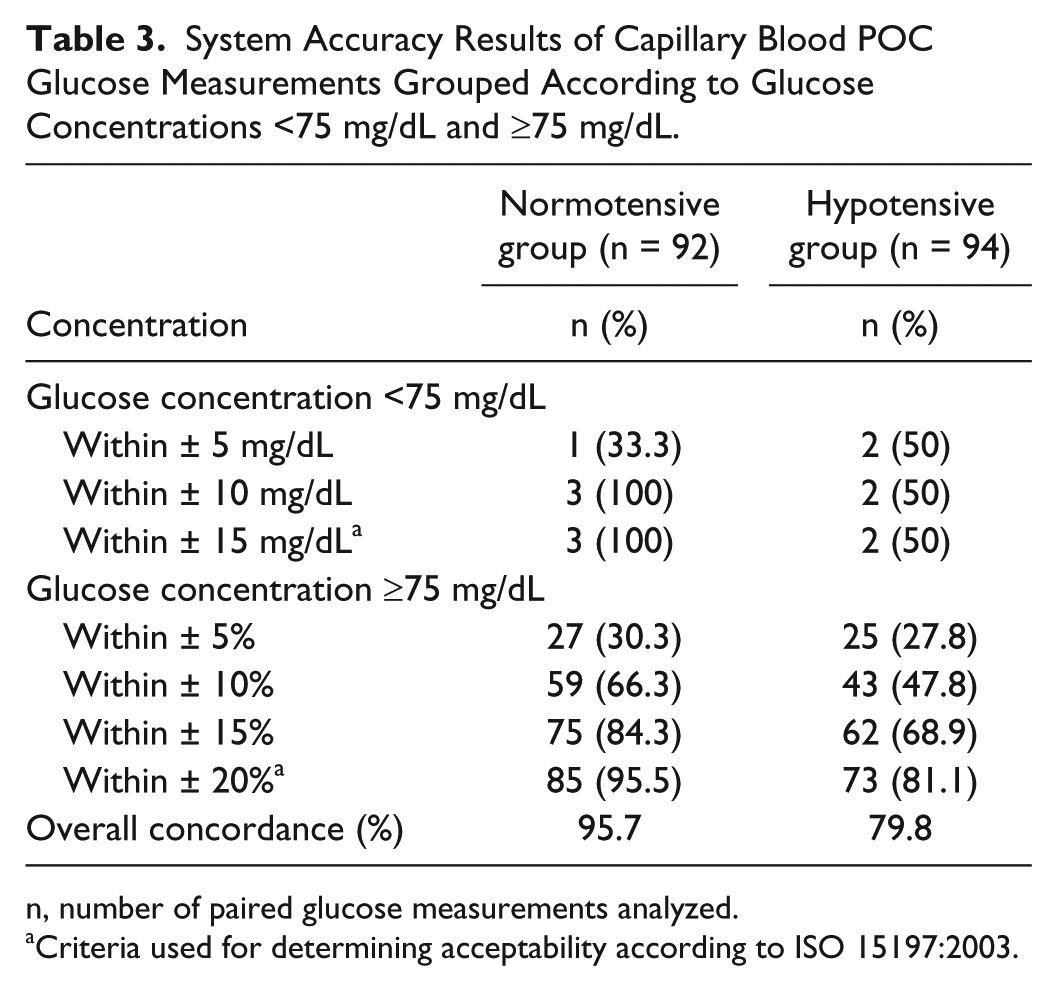
n, number of paired glucose measurements analyzed.
Criteria used for determining acceptability according to ISO 15197:2003.
The POC glucose values in the hypotensive group, however, failed to meet the minimum accuracy criteria. For hypoglycemic values, only half met the accuracy criteria; for glucose values >75 mg/dL, only 81.1% of values fell within 20% of the reference method values, resulting in an overall concordance of 79.8% for the hypotensive group.
Technical Accuracy
Bland–Altman difference plot for the normotensive group (Figure 1) including all paired measurements showed a mean bias of –12.4 mg/dL, with mean POC glucose slightly lower than mean venous glucose and limits of agreement (LOA) at –86.0 and 61.2 mg/dL. The hypotensive group (Figure 2) also showed a lower mean POC glucose compared to venous glucose values, with a mean bias of –34.9 mg/dL (LOA: –207.1, 137.4 mg/dL).
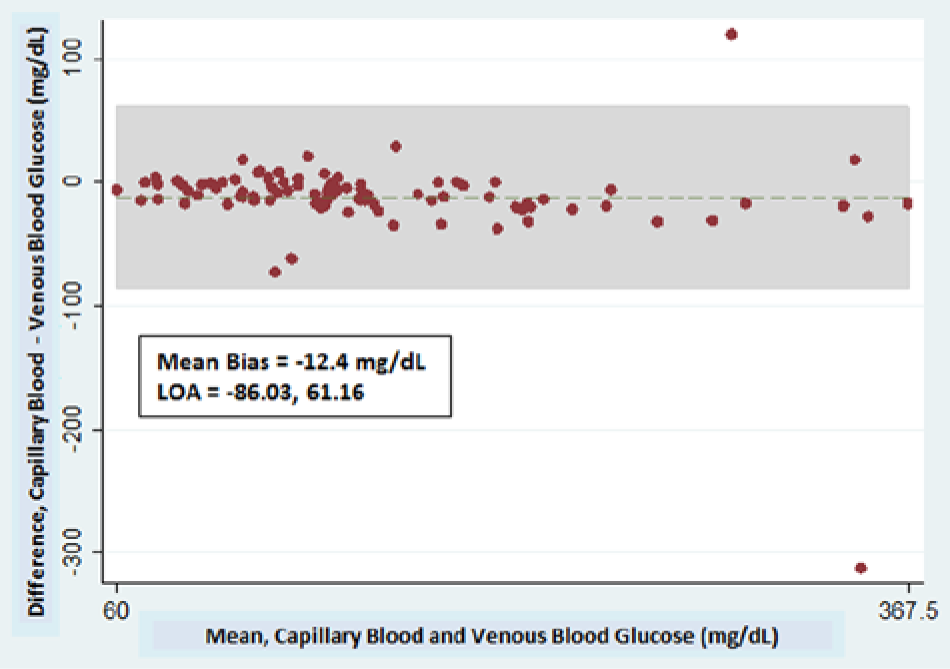
Bland–Altman difference plot of paired glucose measurements (POC glucose and venous whole
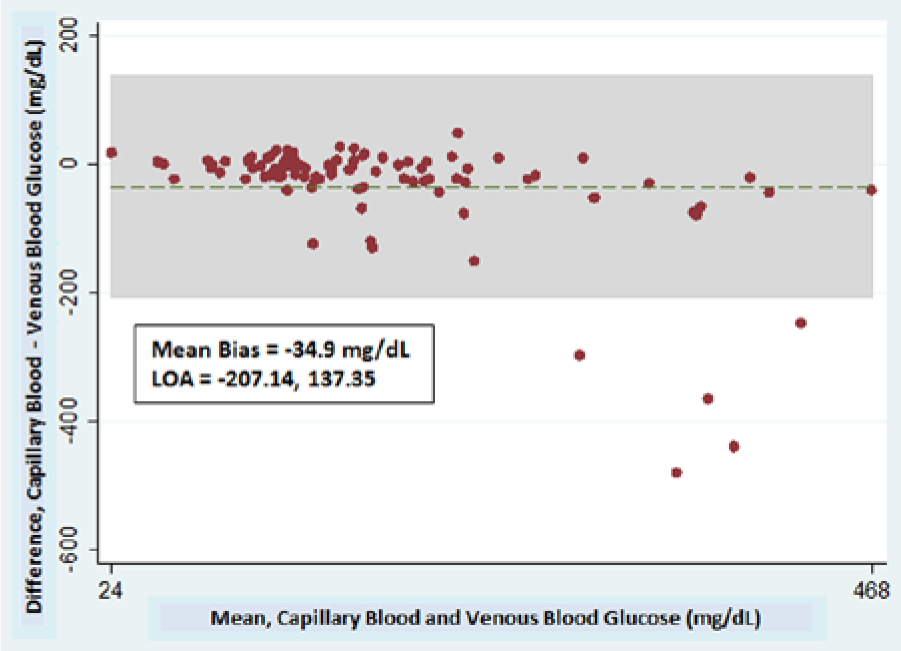
Bland–Altman difference plot of paired glucose measurements (POC glucose and venous whole
Comparing between groups showed a larger absolute mean bias in the hypotensive group. The confidence limits (range between upper and lower LOA) are also wider for the hypotensive group versus the normotensive group (344 mg/dL vs 147 mg/dL).
Paired glucose measurements with bias lying outside the 95% CI were reviewed for any potential confounders in accuracy and technical difficulties during sampling, but none were found. Performing Bland–Altman analysis after excluding these samples (not shown) slightly decreased the mean absolute bias in either group, but did not change the results when comparing the mean bias and confidence limits between groups.
Clinical Accuracy
The normotensive group had 90.2% of POC glucose measurements within the target zone (Table 4). A small proportion of apparently normoglycemic (4.3%) and apparently hyperglycemic POC glucose values (3.3%) were considered underestimations, and a few hyperglycemic values would have resulted in unnecessary insulin administration (2.2%) due to overestimation.
Distribution of POC Glucose Measurements According to Modified Error Grid Analysis Zones and Effect on Clinical Action.
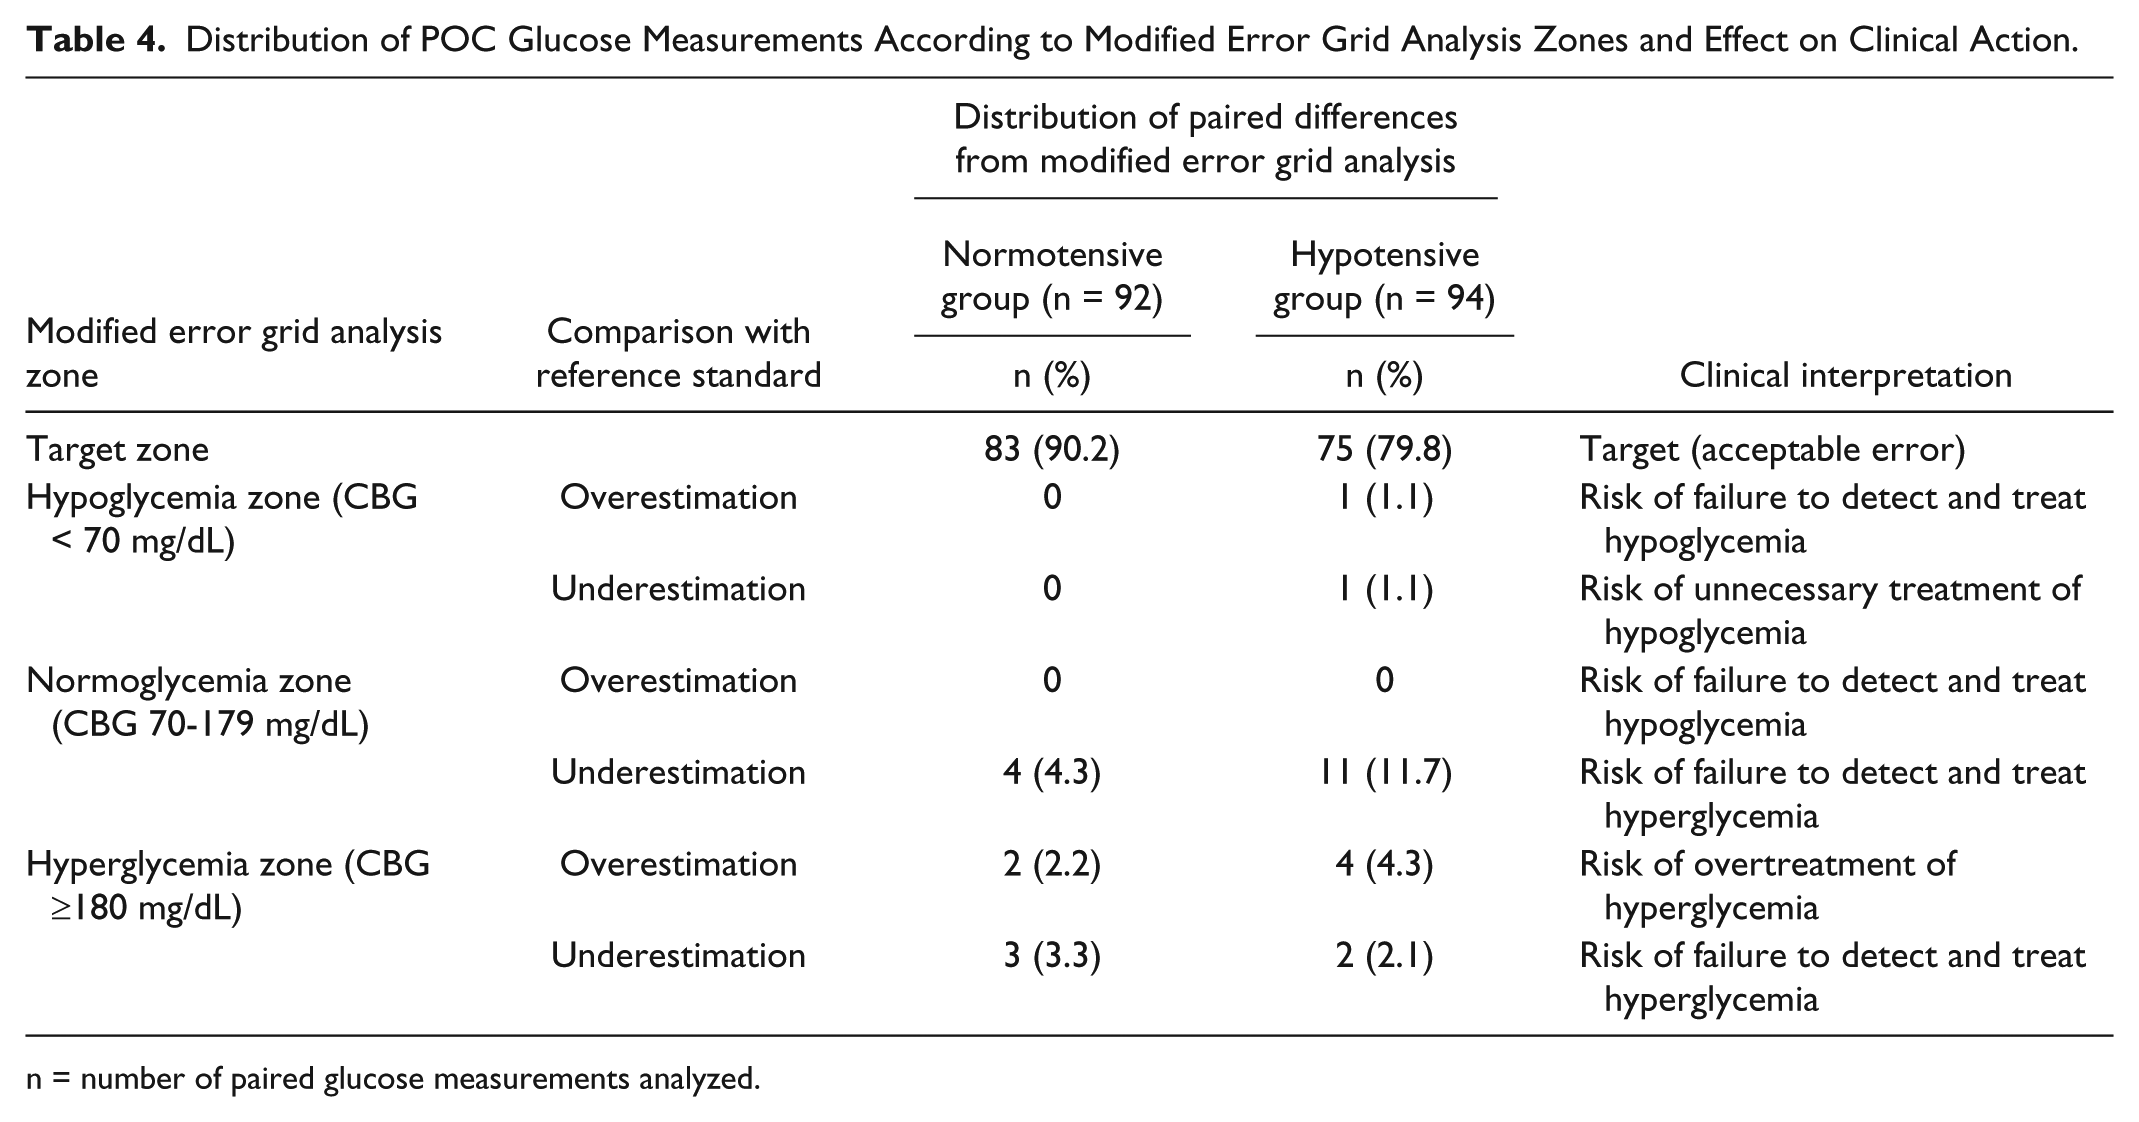
n = number of paired glucose measurements analyzed.
For the hypotensive group, a smaller proportion of glucose measurements were in the target zone (79.8%). One hypoglycemic measurement each was an over- and underestimation, resulting in inappropriate intervention. A larger proportion of apparently normoglycemic values (11.7%) were underestimations. For apparently hyperglycemic values, 4.3% were overestimations, which would have resulted in unnecessary insulin administration, while 2.1% were underestimations.
Discussion
Only a few published studies focused on shock as a possible factor affecting POC glucose meter accuracy, with various design limitations cited earlier.12-14,16-19,21-23
For concordance with ISO 2003 criteria, the POC glucose meter used met the minimum accuracy criteria for the normotensive group (95.6% of all values). This was not attained for the hypotensive group, with an overall concordance of only 79.8%. This reflects the overall lower accuracy of glucose measurements, both technical and clinical, taken from this subset of ICU patients.
Other studies found similar results when using various accuracy criteria for POC glucose meters. Atkin et al 12 noted 36% concordance in hypotensive patients compared to 90% in a normotensive group; using a range of 20% as acceptable bias similar to the ISO. Both groups would still fail to meet ISO standards using the current minimum cut-off of 95%. Critchell et al 19 studied a mixed cohort of ICU patients; with findings of 81% concordance with CLSI accuracy criteria. Desachy et al, 15 with around one-third of their ICU cohort in shock, found that 85% of POC glucose values fell within 20% of reference method values. Lonjaret et al, 17 with another heterogeneous ICU cohort, reported 74.8% ISO concordance with POC blood glucose. Pulzi et al, 29 with a separate analysis for a small subset of ICU patients on norepinephrine, found a 63.6% concordance versus 93.8% for those without norepinephrine support. Our own data show similar trends, with the normotensive group passing minimum ISO accuracy criteria (95.7%) while the hypotensive group failing to do so (79.8%). The effects of low MAP or vasopressor use on glucose meter accuracy may be more emphasized in our study since we did separate analysis on a well-defined hypotensive group with a relatively larger sample size compared to previous studies. It appears POC glucose measurements in critically ill but normotensive patients provides acceptable accuracy (at least for the meter technology used), provided that known confounding factors are not present and standardized collection techniques are followed.
Two new glucose meter accuracy criteria were released during the course of the study which deserve mention; the revised ISO 15197:2013 criteria, 30 and draft guidance from the US Food and Drug Administration (US-FDA). 31 The former sets acceptable accuracy if ≥95% of POC values fall within ± 15% of the reference method for glucose values ≥100 mg/dL, and fall within ± 15 mg/dL for glucose values <100 mg/dL. With this new criterion as reference, both groups would fail to meet minimum accuracy requirements, with only 86.9% of normotensive POC values and 68.1% of hypotensive POC values having acceptable bias.
The much stricter US-FDA draft guidelines requires 99% of POC values within ± 10% of the reference method for glucose values ≥70 mg/dL and within ± 7 mg/dL for glucose values <70 mg/dL. None of the POC glucose measurements should exceed ± 20% of the reference method for glucose values ≥70 mg/dL or ± 15 mg/dL for values <70 mg/dL. Using this standard, only 65.2% of normotensive POC values and 46.8% of hypotensive POC values met accuracy criteria. Moreover, 4.3% of normotensive POC values and 18.1% of hypotensive POC values exceeded the maximum allowable bias.
Bland–Altman agreement analysis showed lower mean POC glucose values compared to venous blood glucose in both groups. The confidence limits were also wide in both groups, more so for the hypotensive group (147.2 mg/dL vs 344.5 mg/dL). After excluding outlying values, the confidence limits became narrower but still spanned across zero, consistent with most method-comparison studies reviewed.13,17-19,23,29 For studies with separate analysis on hypotensive subgroups, those on vasopressor support also had wider confidence limits compared to normotensive patients.23,29 This lack of a consistent directional bias precluded us from proposing a safe “correction factor” for capillary glucose values in either group on which to make adjusted intervention thresholds.
Modified error grid analysis for clinical accuracy showed fewer values in the hypotensive group within the target zone (79.8% vs 90.2%). For both groups, the largest proportion of clinical errors was apparently normoglycemic capillary glucose values that were underestimations (4.3% normotensive and 11.7% hypotensive glucose values). This meant undetected hyperglycemia ideally requiring supplemental insulin. No normoglycemic range values were overestimations in either group, which would translate to unnecessary insulin administration and potentially life-threatening hypoglycemia.
A limitation in our data is the small number of glucose measurements <75 mg/dL (only 7), which prevented us from making generalizations for this range. This was despite our provision of obtaining additional measurements during any dysglycemia detected during ICU stay.
Comparison with other published data on clinical accuracy show conflicting results. Kanji et al 16 reported an overall agreement in clinical action of 61.1% for patients on vasopressors versus 53.8% agreement for a postsurgical normotensive group. The most common errors in this study were apparently hypoglycemic (9%) and normoglycemic (9%) values that were overestimations compared to the reference method. Another study 17 in a mixed cohort reported 75% of POC measurements in the target zone, with the most common error being underestimation compared to reference method values (22%), consistent in all prespecified glucose ranges. Petersen et al, 22 involving another heterogeneous ICU cohort, reported “mild” overestimation as being the most common error using Parkes error grid analysis, occurring in 17.4% of POC measurements. For the study of Pulzi et al, 29 their subgroup analysis of patients on norepinephrine showed fewer measurements on target (71%) versus those without vasopressors (81.5%). The most common errors in this study were overestimations resulting in undetected hypoglycemia. In comparing these various studies in terms of clinical accuracy, it should be taken into consideration that the labeling of “inappropriate” intervention depends largely on the local ICU protocol being practiced, with various thresholds for change in clinical action.
Conclusions
In our population of hypotensive, critically ill patients on vasopressor support, POC glucose meter values had lower accuracy in terms of concordance to ISO 2003:15197 criteria, Bland–Altman agreement analysis, and modified error grid analysis, compared to normotensive ICU patients. Other methods of glucose monitoring may be more appropriate in hypotensive ICU patients, possibly central catheter blood POC measurements,12,15 automated blood/gas analyzers, 16 or other more advanced methods. Confirmatory laboratory determinations should immediately be performed in hypotensive patients if POC glucose values appear clinically incompatible. Glycemic targets for this type of patients should perhaps be less stringent to avoid overtreatment and potentially fatal hypoglycemia.
A limitation of our study is the small number of hypoglycemic measurements obtained, precluding us from making strong conclusions for the accuracy of measurements in this particular range.
For normotensive ICU patients, the present glucose meter used in the study appears accurate according to ISO 2003:15197 criteria, as long as identified confounding factors are excluded and specimen collection is performed in a standardized manner to minimize accuracy errors.
Recently published ISO 15197:2013 accuracy standards will render the POC glucose meter in this study inaccurate for both normotensive and hypotensive cohorts and point out the need for alternative methods of glucose monitoring. These tighter criteria will undoubtedly impact the development and costs of future POC glucose monitoring methods once compliance becomes mandatory after the 3-year transitional period, more so for the critically ill population.
Footnotes
Abbreviations
CLSI, Clinical and Laboratory Standards Institute; GCS, Glasgow Coma Scale; GDH, glucose-1-dehydrogenase; ISO, International Organization for Standardization; LOA, limits of agreement; MAP, mean arterial pressure; POC, point of care; US-FDA, US Food and Drug Administration.
Declaration of Conflicting Interests
The author(s) declared no potential conflicts of interest with respect to the research, authorship, and/or publication of this article.
Funding
The author(s) received no financial support for the research, authorship, and/or publication of this article.