
Abstract
Background:
Aerobic exercise can lower blood glucose levels and alter insulin sensitivity both during and several hours after exercise, creating challenges for a closed-loop artificial pancreas. Predictive low glucose suspend (PLGS) algorithms are a first step toward an artificial pancreas, but few of these have been successfully applied to exercise. This study incorporates physical activity measurements from a combined accelerometer/heart rate monitor (HRM) to improve the performance of an existing PLGS algorithm at mitigating exercise-associated hypoglycemia in participants with type 1 diabetes.
Methods:
In all, 22 subjects with type 1 diabetes on insulin pump therapy were provided a combined accelerometer/HRM and (if not already using one) a continuous glucose monitor (CGM), then instructed to go about their everyday lives while wearing the devices. After the monitoring period, each subject’s insulin pump, CGM, and accelerometer/HRM were downloaded and the data were used to augment an existing PLGS algorithm to incorporate activity. Using a computer simulator, the accelerometer-augmented algorithm was compared to the HRM-augmented algorithm to determine which was most effective at mitigating hypoglycemia.
Results:
Mean length of monitoring was 4.9 days. Across all subjects, 11 061 CGM readings were recorded during the monitoring period. In the simulator analysis, the PLGS algorithm reduced hypoglycemia by 62%, compared to 71% and 74% reductions for the HRM-augmented and accelerometer-augmented algorithms, respectively; combined accelerometer and HRM augmentation provided a 76% reduction.
Conclusions:
In a simulated setting, the accelerometer-augmented pump suspension algorithm decreases the incidence of exercise-related hypoglycemia by a meaningful amount compared to the PLGS algorithm alone. Results also failed to justify the additional user burden of a HRM.
Keywords
Regular aerobic exercise is considered an important component of the management of type 1 diabetes (T1D). 1 However, exercise-associated hypoglycemia is a frequently reported adverse event2,3 and can occur during exercise or several hours afterward.4-6 Although premeal dose reduction of exogenous insulin or increasing carbohydrate intake can be effective at decreasing the incidence of exercise-associated hypoglycemia, 7 people with T1D often do not make such adjustments.8,9
Suspension of an insulin pump at the beginning of moderate aerobic exercise reduces the risk of exercise-associated hypoglycemia, albeit with an increased risk of hyperglycemia. 10 Algorithm-based pump suspension offers a more nuanced, user-independent means for reducing insulin delivery, with the potential to avoid hypoglycemia and remain euglycemic. However, although multiple pump suspension algorithms based on continuous glucose monitor (CGM) trends can reduce hypoglycemia in a sedentary setting,11-14 few of these algorithms have been successfully applied to exercise. 15
The current study augments a published predictive low glucose suspend (PLGS) algorithm14,16 by adding activity data derived from the use of a combined accelerometer and heart rate monitor (HRM) device. The augmented algorithm is tested on a simulator based on outpatient monitoring data.
Methods
Consent Procedures
Stanford University’s institutional review board approved the study protocol, consent form, and assent form. Adult subjects gave written consent to participate. For minors, a parent/guardian and the subject gave written consent and assent, respectively.
Eligibility Criteria and Assessment
To be eligible for the data collection phase, each subject had to (1) be between 10 and 60 years of age, (2) have a clinical diagnosis of T1D for ≥12 months, (3) use a downloadable smart insulin pump (with programmable carbohydrate to insulin ratios, correction doses, and insulin on board features) for insulin delivery, and (4) own a CGM or agree to wear a loaned CGM (with appropriate instruction, as needed) for purposes of study participation. Subjects were not eligible if they (or caregiver) experienced inpatient psychiatric treatment in the past 6 months, or had the presence of a significant medical disorder that, in the judgment of the investigator, would affect the completion of any aspect of the protocol.
Subject recruitment took place at Stanford University and a local diabetes summer camp. Notably, some subjects were simultaneously involved in other insulin pump-related studies; however, these studies involved overnight monitoring with the potential for nocturnal hypoglycemia intervention, while the current study analyzed data from daytime monitoring (6:00
Study Procedures
Subjects had an initial visit with a study investigator for a baseline medical history and physical exam, then underwent placement of the Zephyr BioHarness™ 3 (Zephyr Technology, Annapolis, MD) combined 3-axis accelerometer/HRM, which samples accelerations at 100 Hertz and measures heart rates to an accuracy of ±3 beats per minute.17-19 (We elected to use the Zephyr BioHarness 3 because it has the ability to transmit data in real time, and we plan to incorporate the findings from this study into future closed-loop studies in real time.) The Zephyr BioHarness 3 is encased in a chest strap that is worn directly on the skin. If not already in use, a Dexcom G4 Platinum CGM (Dexcom Inc, San Diego, CA) or Medtronic Sof-Sensor CGM (Medtronic Inc, Minneapolis, MN) was placed and appropriate teaching provided. (The Dexcom G4 Platinum was an investigational device at the time of this study; subjects using this device were provided it as part of a concurrent nocturnal hypoglycemia intervention study at diabetes camp.) Five subjects were using a Dexcom 7+ and 3 subjects were using a Medtronic Sof-Sensor prior to entering the study. Subjects were instructed to wear the accelerometer/HRM, as well as the CGM and insulin pump on a continuous basis as they went about their everyday activities, with the exception of water-based activities and when recharging the accelerometer/HRM (required every 36 hours and recommended to be done overnight). Specific instructions were given for subjects to make the usual changes they would make for exercise, and not make any special changes in their diabetes management strategies to accommodate the study during the monitoring period.
Monitoring
Subjects were also asked to record the type, duration, and intensity of any exercise lasting >20 minutes in an activity log. The Zephyr BioHarness 3 recorded second-by-second heart rate and acceleration data, but subjects were blinded to these data, as the device does not have an active display and data were not downloaded until the completion of the monitoring period. CGM readings were obtained every 5 minutes and were available for viewing by the subject via the usual display method for each device.
After the completion of the monitoring period, each subject’s insulin pump, CGM, and accelerometer/HRM were downloaded for analysis. When available, activity logs were also obtained and incorporated in the analysis.
Algorithm Development
The preexisting PLGS algorithm that was augmented in this study uses a Kalman filter with a 30 minute prediction horizon and a blood glucose threshold of 80 mg/dl for pump suspension; a safety feature is in place to prevent suspensions when the CGM readings are increasing. The previous algorithm is described in detail by Cameron et al 14 and Buckingham et al. 16
The PLGS algorithm was augmented to suspend when activity levels exceeded predefined thresholds of 0.1 vector magnitude units (VMU) on the accelerometer, or 90 beats per minute (bpm) on the HRM and the glucose value was both decreasing and below a threshold of 180 mg/dl.
Simulation Testing
The simulator uses glucose and insulin data from subjects and then removes the effect of any additional insulin that was given once a suspension is commanded. Once the suspension is over, the effect of delivered insulin is resumed. Daytime data between 6
In the simulation, it was assumed that the insulin used in the real-life setting acted according to (1) the patient’s insulin sensitivity calculated empirically using our data and the 1800 rule 20 and (2) an insulin time action profile taken as the average of published aspart and lispro curves.21,22 When the algorithm requested a suspension, the real-life basal rate was removed per the assumed time-action profile and insulin sensitivity. The subsequent effect on future glucose levels was then observed. As assumptions about insulin activity are inherently flawed, the simulator works best for small changes from the real data. Consequently, the simulator did not compute the effect of suspensions requested when the glucose level was above 100 mg/dl and the actual data contained no hypoglycemic readings in the following 3 hours.
Results
Table 1 exhibits the demographic data of the 22 study participants. Mean age of participants was 22.2 years (range 10.7-45.5) and mean reported hemoglobin A1c was 7.6% (range 5.9-10.3%). The mean length of monitoring was 4.9 days (range 1-16). Data were not collected on subject 4 because of extremely thin body habitus, which resulted in an inability to keep the accelerometer/HRM on his chest. No adverse events were reported related to the wearing of any study devices. An example plot from the data downloaded from each patient’s insulin pump, CGM, and accelerometer/HRM is shown in Figure 1.
Demographic Data for Study Participants.
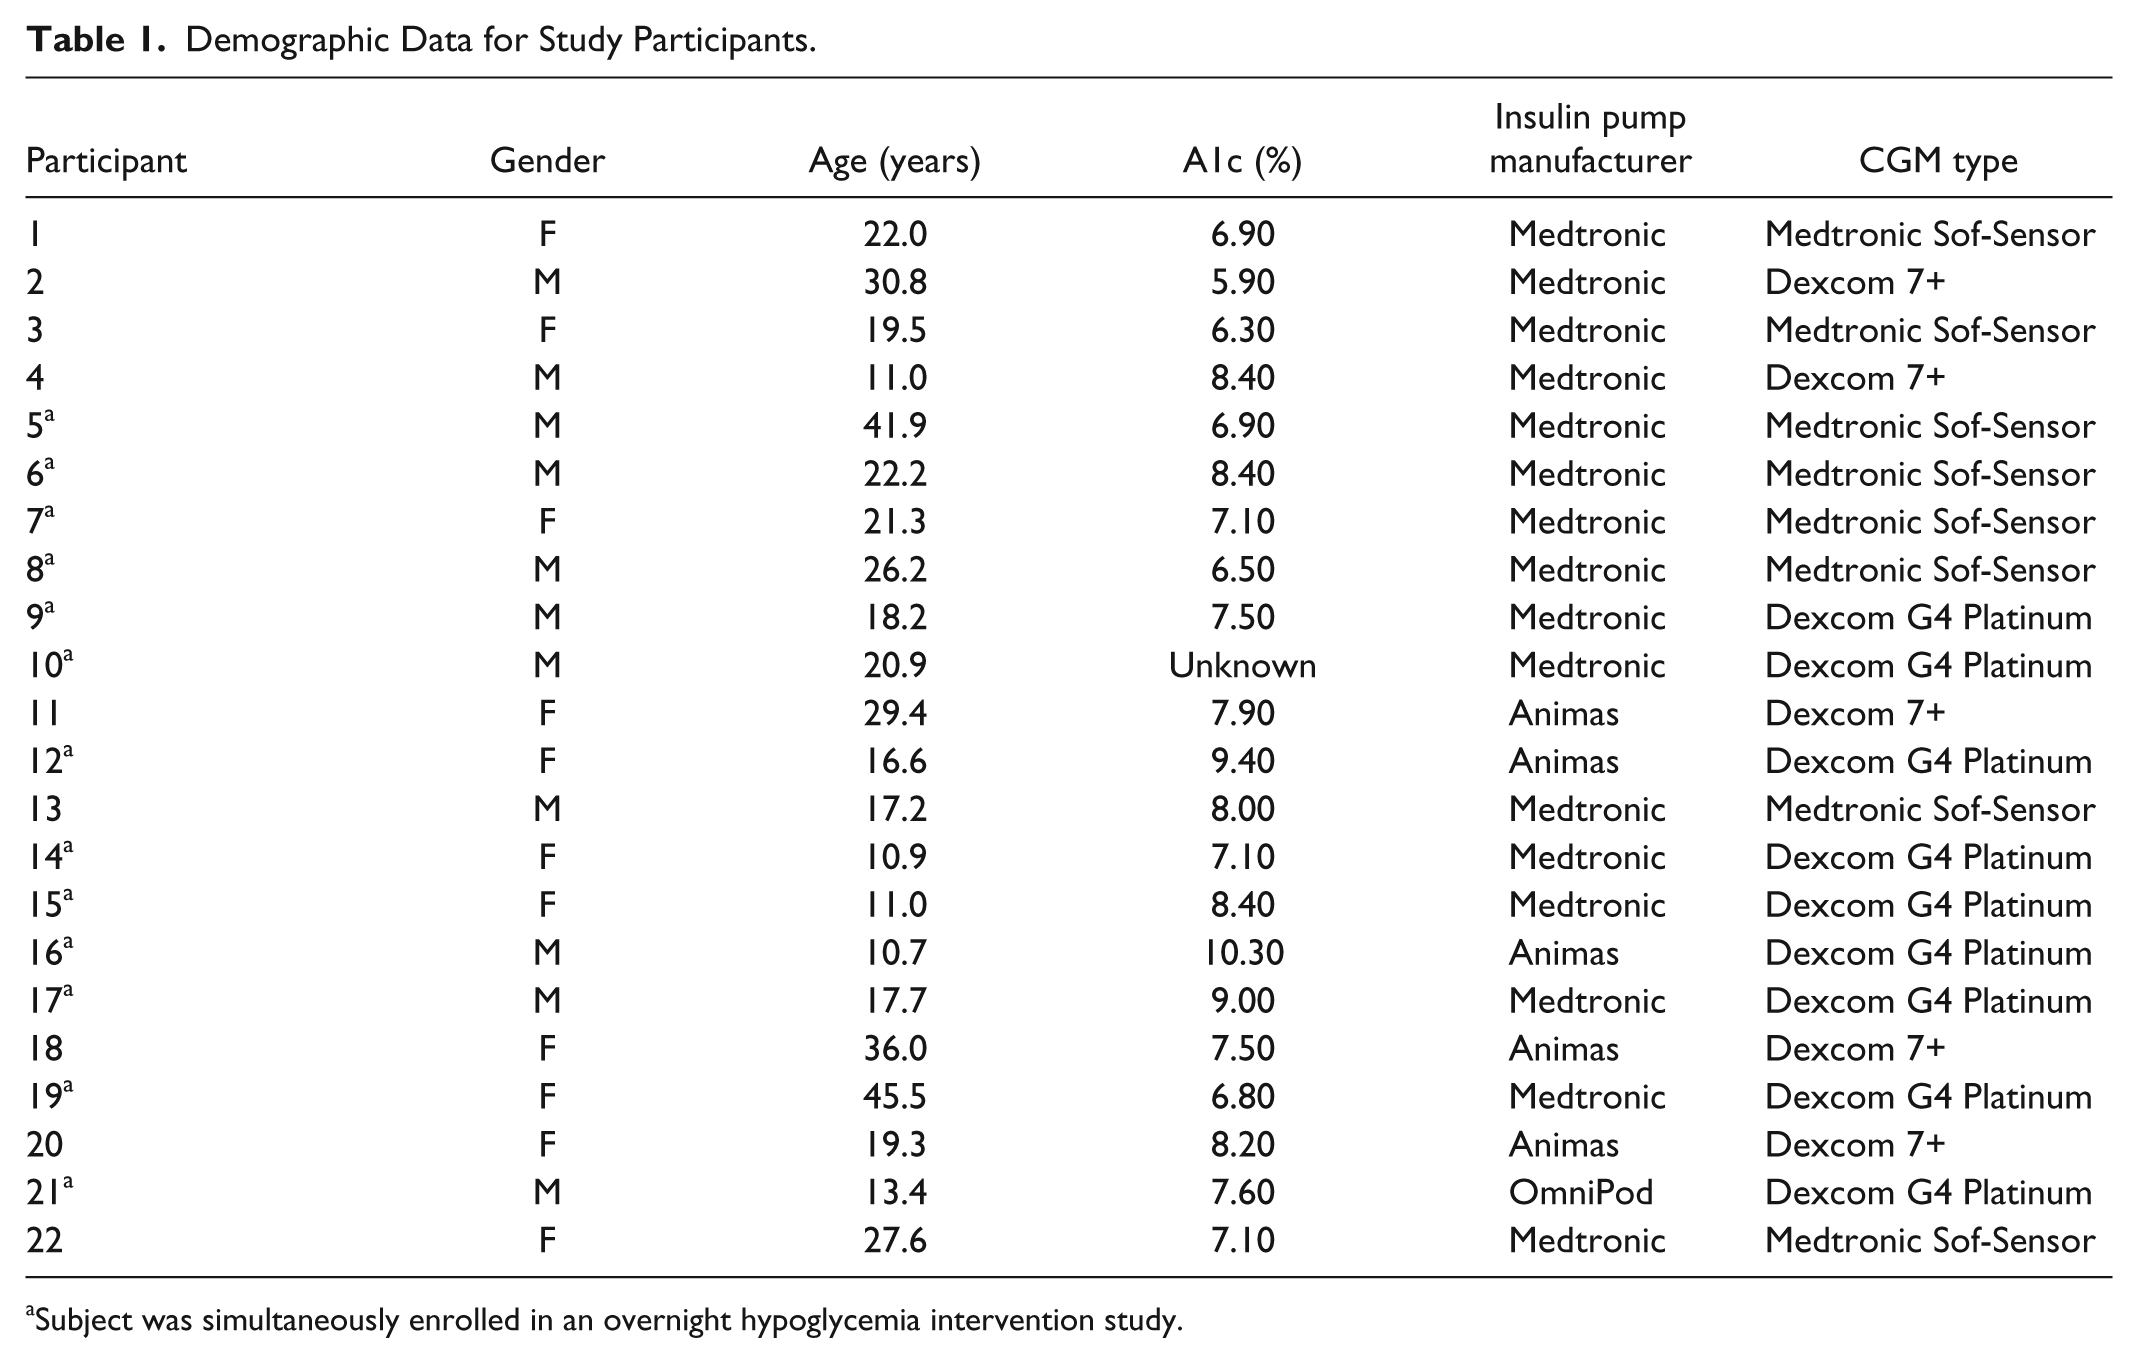
Subject was simultaneously enrolled in an overnight hypoglycemia intervention study.
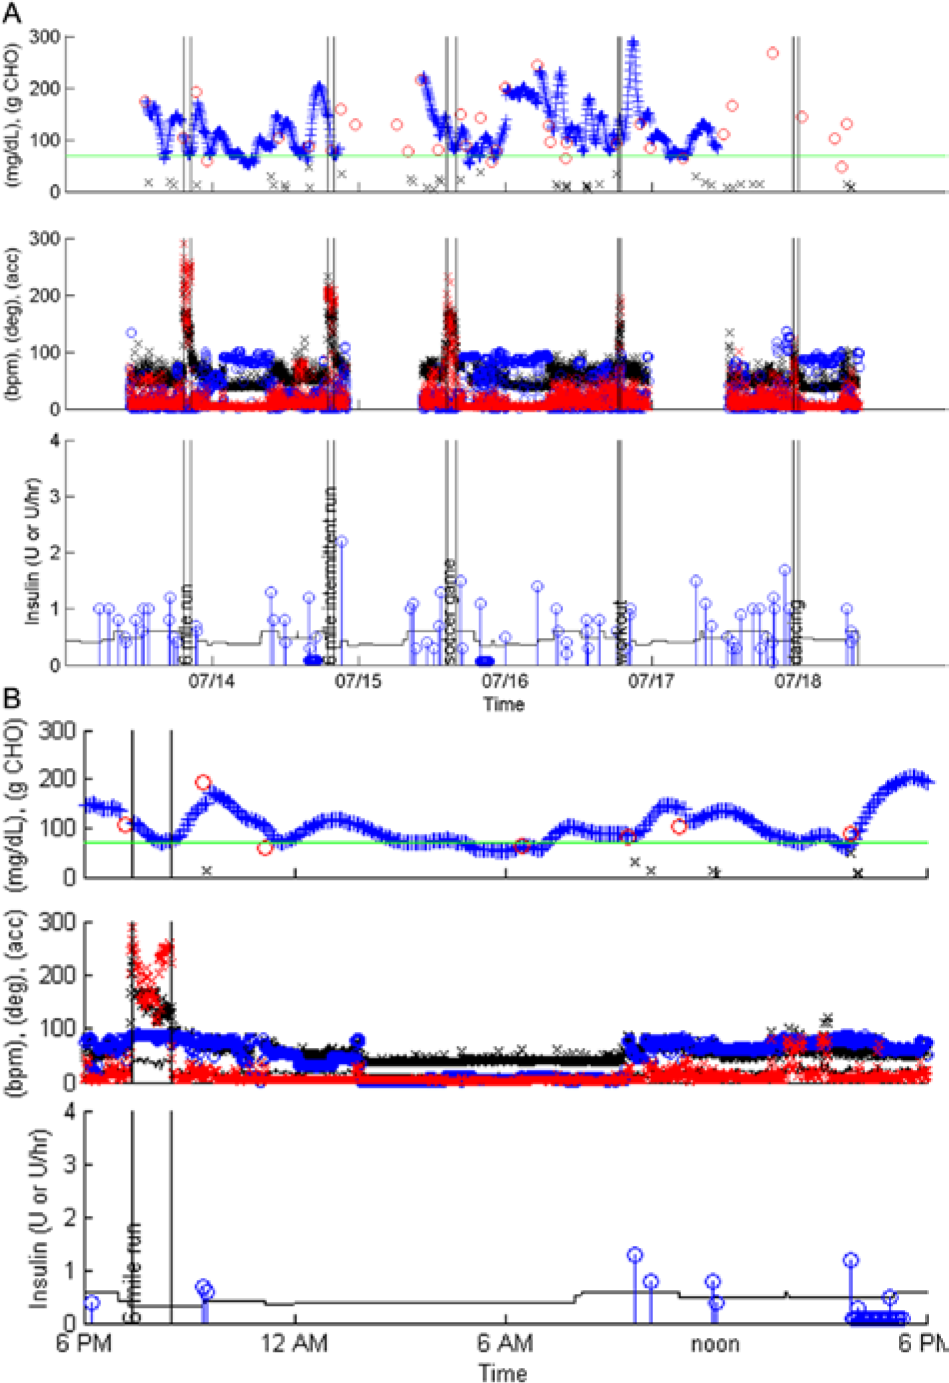
Sample data download from insulin pump, CGM, and accelerometer/HRM. (A) Five days of monitoring. (B) Detailed review of day 4. For both A and B: Top panel: black x = carbohydrate consumed (g), blue x = CGM glucose values (mg/dl), red circles = reference blood glucoses (mg/dl). Middle panel: black x = HR (beats/min), red x = accelerations, blue circle = orientation (degrees, where zero indicates laying and 90 indicates standing). Bottom panel: blue circle = insulin bolus (units), black line = basal insulin rate (units/hr). Vertical text within black vertical lines is descriptive exercise data from subject’s activity log.
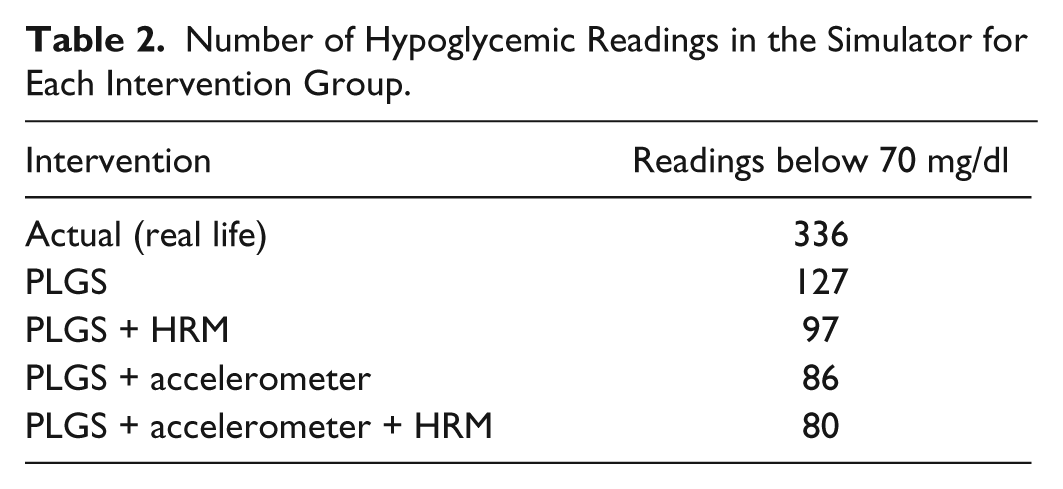
A total of 11 061 CGM readings were recorded during the monitoring period. The comparison of hypoglycemic events between the 5 intervention groups is shown in Table 2. The PLGS algorithm alone resulted in a 62% reduction in hypoglycemia; HRM augmentation provided a 71% reduction and accelerometer augmentation provided a 74% reduction; combined accelerometer and HRM augmentation provided a 76% reduction. On no occasions did the algorithm fail to suspend before the subject became hypoglycemic in the real-life setting.
Number of Hypoglycemic Readings in the Simulator for Each Intervention Group.
A sample glucose trend plot from a morning of exercise is shown in Figure 2. In this plot, there was no difference in the glucose trend using PLGS and PLGS with HRM augmentation, with the subject’s CGM trend transiently reaching the 70 mg/dl line; the PLGS with accelerometer augmentation was successful at preventing hypoglycemia altogether.
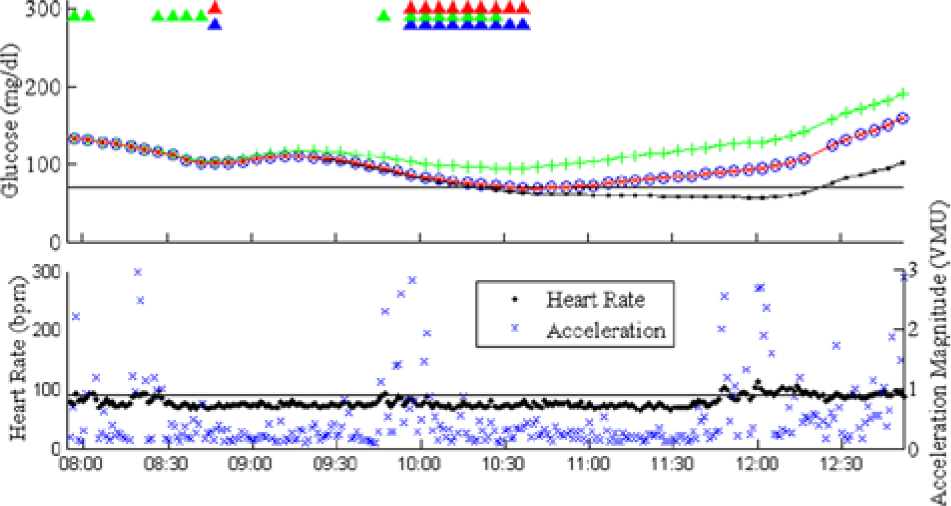
Representative sample plot demonstrating a morning in which exercise occurred. The patient became hypoglycemic in the real-life setting (black line with dots). There was no difference in the glucose trend using PLGS alone (red line with xs) and PLGS with HRM augmentation (blue line with circles); in both settings, the patient transiently decreased to 70 mg/dl before rising again. The PLGS with accelerometer augmentation prevented hypoglycemia altogether (green line with crosses). The top plot also shows when the algorithms suspended insulin delivery (triangles). Furthermore, the bottom plot shows the heart rate and acceleration values with their corresponding thresholds.
Discussion
Hypoglycemia is the most common exercise-related adverse event in T1D 2 and—along with unannounced meals, sensor accuracy issues, and delays in the onset of insulin action—presents a significant obstacle on the path toward a closed-loop system. In the ASPIRE study, duration of exercise-associated hypoglycemia was reduced when insulin delivery was suspended at a CGM glucose of ≤70 mg/dl. 15 The current study builds on these results by combining CGM data with data from an accelerometer and HRM to augment an existing pump suspension algorithm with activity data. The simulator analysis suggests that, while the PLGS algorithm alone was moderately effective at mitigating hypoglycemia, when the algorithm was informed with activity data, its ability to prevent hypoglycemia was improved. This enhancement may be particularly beneficial for people with T1D who are less inclined to make their own exercise-related insulin adjustments.
Accelerometers are small and light-weight motion-sensing devices that can provide information about the onset, duration, and intensity of physical activity. 23 They can be worn on various parts of the body,24-29 but could also be easily incorporated into current CGMs and “patch” pumps. In contrast, most commercially available HRMs currently require a chest strap that can be uncomfortable to wear. As a marker of physical activity, HRM data alone are also fraught with inaccuracy.30,31 The current study’s use of a combined accelerometer/HRM device afforded the opportunity for head-to-head comparison of the different types of activity monitors. Using the subject-provided activity logs as the best indicator of exercise, the accelerometer and HRM correlated well at recognizing exercise, as demonstrated in Figure 1. Furthermore, their individual and combined performances at mitigating exercise-related hypoglycemia in the simulator were also essentially equivalent. Although the simulator analysis is not exhaustive, considering the cumbersome nature of the HRM chest strap vis-à-vis the small size and versatility of accelerometers, these results imply that there is no substantive benefit to justify the use of a HRM over (or combined with) an accelerometer when developing activity-augmented pump suspension algorithms.
The primary limitation of this study is its small sample size. However, 9 of the 22 patients wore the accelerometer/HRM during a week at diabetes camp, which encompasses a wide variety of activities and thus, a rich opportunity for monitoring. The remaining subjects were also from a wide spectrum of fitness backgrounds, including a mostly sedentary individual, a dancer, a collegiate athlete, a cyclist, and a marathon runner. Considering the diversity of subjects in regards to age and activities, the group does encompass a reasonable cross-section of the active population with T1D who would be most likely to benefit from an activity-augmented pump suspension algorithm.
Another limitation of the study is the difficulty assessing false positives in the simulator, that is, instances in which the algorithm induced pump suspension but the subject did not actually become hypoglycemic in the real-life setting. Such an analysis is fraught with complications because experienced people with diabetes are likely to sense impending hypoglycemia and treat with carbohydrate intake, therefore avoiding hypoglycemia in the real-life setting and inflating the rate of false positive pump suspensions in the simulator. Thus, for the simulator analysis, the 0.1 VMU and 90 bpm thresholds were selected to optimize the effectiveness of the algorithm (ie, minimize the number of hypoglycemic readings) while also limiting superfluous periods of suspension by maintaining the minutes of suspension per eliminated hypoglycemic reading to twice the level expected for the PLGS algorithm alone. Histograms demonstrating the frequency of readings above and below the 0.1 VMU and 90 bpm marks are shown in Figure 3. It is notable that participants spent a larger frequency of time with heart rates above the 90 bpm threshold than they did with accelerations above the 0.1 VMU. Numerous nonexercise phenomena (psychological stress, excitement, etc) can also elevate the heart rate, and these data are consistent with the published reports about inaccuracy of heart rate data alone as a marker of exercise.30,31
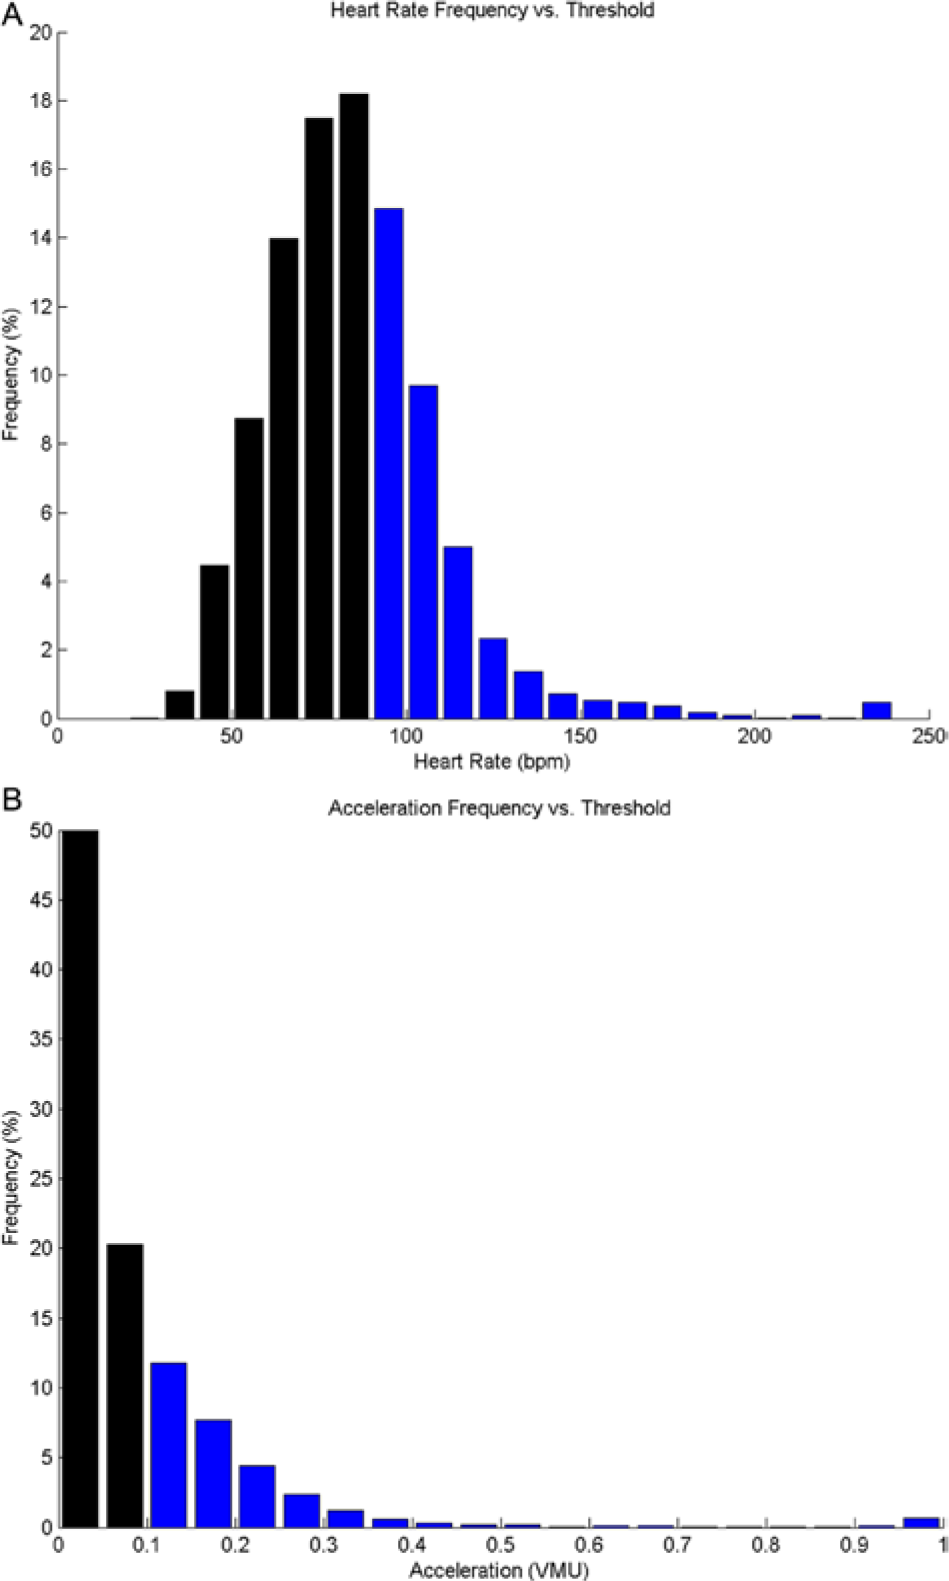
Histograms from all subject monitoring, demonstrating the frequency of acceleration (A) and heart rate intervals (B). Black bars indicate readings below the simulator thresholds (0.1 VMU for accelerations, 90 bpm for heart rate), while blue bars are above the threshold.
Conclusions
In summary, this study demonstrates that, in a simulated setting, an accelerometer-augmented pump suspension algorithm can decrease the incidence of exercise-related hypoglycemia by a meaningful amount over and above a CGM trend-based algorithm alone. Furthermore, results failed to justify the additional user burden of a HRM. Our group is currently developing a clinical trial to test the effectiveness of the activity-augmented PLGS algorithms in the setting of a structured exercise protocol. Further research will focus on the effectiveness of activity-augmented suspension algorithms in users’ everyday lives.
Footnotes
Abbreviations
bpm, beats per minute; CGM, continuous glucose monitor; HRM, heart rate monitor; PLGS, predictive low glucose suspend; T1D, type 1 diabetes; VMU, vector magnitude units.
Declaration of Conflicting Interests
The author(s) declared no potential conflicts of interest with respect to the research, authorship, and/or publication of this article.
Funding
The author(s) disclosed receipt of the following financial support for the research, authorship, and/or publication of this article: This work was supported in part by the Lilly Endocrine Scholars Award; the Ernest and Amelia Gallo Endowed Postdoctoral Fellowship; the Child Health Research Institute; the Stanford Clinical & Translational Science Award, grant UL1 RR025744; the Juvenile Diabetes Research Foundation (JDRF), grants 22-2011-647, 22-2009-795, and 22-2007-1801; the JDRF fellowship 3-2011-80; and NIH 5R01DK085591-03.