
Abstract
The article offers a new method of quality of life assessment based on online activities of social networks users. The method has obvious advantages (quickness of research, low costs, large scale, and detailed character of the obtained information) and limitations (it covers only the “digital population,” whereas the rural population is not included). The article dwells on the potential of social networks as a data source to analyze the quality of life; it also presents the results of an empirical study of online activities of the users of VK, the most popular Russian social network. Using the obtained data, the authors have calculated the quality of life index for 83 regions of the Russian Federation based on 19 parameters of economic, social, and political aspects of life quality.
Keywords
Introduction
Development of information and communication technologies offers new ways to measure wellbeing, happiness, and quality of life. Social media, for example, is now one of the main data sources where opinions, emotions, and behavior of the population can be identified. Thus, Bellet and Frijters (2019, p. 103) write, “Claims that social media can hence predict our wellbeing exceedingly well thus need not be surprising at all for that is often the point of social media.” We believe that qualitative assessment of human behavior can give us enough information on their emotions and feelings and, based on these subjective assessments, we can form some understanding of the perceived quality of life.
This article offers a method to assess the perceived (or subjective) quality of life based on the information on online activities of the social media users. Thus, we formulate our subject matter as follows: What are the feelings of quality of life of social media users in Russian across various indicators and regions?
Currently numerous definitions of quality of life exist, which belong to different research areas: sociology, economics, psychology, education science, medicine, and geography. Schalock (2000) speaks about more than 100 definitions, and we suppose this number has increased substantially since the date this article was published. Apart from various definitions and methods, in many cases, the aspect of personal and social life, which the definition of quality of life belongs to, is described in other words as well, and there is no clear distinction between them. McGillivray and Clarke (2006, p. 3) wisely note that such concepts as “quality of life,” “welfare,” “well-living,” “living standards,” “utility,” “life satisfaction,” “prosperity,” “needs fulfilment,” “development,” “empowerment,” “capability expansion,” “human development,” “poverty,” “happiness,” and so on are perceived as interchangeable and have no clear outlines. It should be noted, however, that there are constant attempts to separate these concepts from one another, but this problem is far from being solved. Veenhoven (2001) believes, for instance, that the concepts of quality of life and happiness coincide only to some extent, in some elements. Quality of life is a broad concept including quality of environment, quality of performance, and quality of results. Veenhoven supposes that happiness is a part of the quality of results, that is, subjective satisfaction with life in general. Veenhoven interprets happiness from the utilitarian point of view and tries to prove that some of those prerequisites perceived as criteria of quality of life do not necessarily promote growth of “happiness” in humans.
Thus, it seems reasonable to focus on a universal research area—the science of wellbeing, which incorporates all studies on various aspects of such fundamental and complex notion as wellbeing (for instance, quality of life or happiness studies, studies of subjective wellbeing, life satisfaction, flourishing, and so on) (Alexandrova, 2017). In this article, we focus on the integrative definition of quality of life introduced by Costanza et al. (2007, p. 269): “quality of life is the extent to which objective human needs are fulfilled in relation to personal or group perceptions of subjective wellbeing.” In the earlier studies, the perceived quality of life (e.g., Andrews & Withey, 1976; Campbell et al., 1976) is analyzed in terms of the social indicators, which depict subjective perception and assessment of the social conditions. We believe that the concept of “human needs” is much broader as compared with that of the social conditions, and thus, it is considerably more vague.
Here we are guided by several methodological assumptions, which are critical for our approach. First of all, we share Bentham’s proposition that wellbeing is an excess of pleasure over suffering (Goldworth, 1983). Second, we believe that the assessment of subjective quality of life is based on “affective assessment” consisting of cognitive assessment (subjective assessment of some circumstances) and positive and negative feelings (Andrews & Withey, 1976). Thus, any assessment of subjective quality of life is a subjective assessment of various components of life, events, and circumstances quality, as well as general emotional self-sentiment. Balance of positive and negative assessments of various important aspects of one’s life, that is, of human needs, is an expression of the perceived quality of life.
Assessment of the perceived quality of life is by definition related to emotional suffering, feelings, and personal evaluation. We agree with Schwarz (2012) that feelings, emotions, and attitudes directly influence our value judgment including the one related to our personal situation and our position in this world. Thus, Schwarz and Clore (1983) showed by experiments that our judgments on quality of life, happiness, and wellbeing change depending on how we feel and what our expectations are as of the moment when we evaluate wellbeing; they also differ depending on the weather at that very moment. We can suppose that some other emotional factors exist, which influence our evaluation of our life.
Kahneman and Deaton (2010) point at the difference of two aspects of wellbeing—emotional wellbeing and life evaluation: Emotional wellbeing (sometimes called hedonic wellbeing or experienced happiness) refers to the emotional quality of an individual’s everyday experience—the frequency and intensity of experiences of joy, fascination, anxiety, sadness, anger, and affection that make one’s life pleasant or unpleasant. Life evaluation refers to a person’s thoughts about his or her life (p. 16489).
It is obvious that these concepts are related to different emotions and feelings a person can experience; thus, it is not surprising that any assessment of these aspects of wellbeing show different results, like, for example, the influence of the income change. Emotional wellbeing reflects a set of feelings and emotions a person currently experiences, whereas life evaluation implies a world view (or a view of a period of life) as seen from a certain time period, or from a point, which is beyond the current and routine experience and which demands serious self-reflexion, comparison with other people and interpretation within a different time scale. We suppose that the perceived quality of life measured on the basis of the social media data is closer to emotional wellbeing as it registers the present responses and judgments of people.
Science of wellbeing and social media
Presently, the analysis of the social media users’ behavior is the most important and one of the most efficient marketing tools, including the political marketing. Thus, it is logical to assume that if this method of behavioral studies has been acknowledged in applied marketing research, it can also be used in fundamental science to create new methods to study the social reality. It should be noted that experts in social sciences tend to be very suspicious of digital methods to study the social reality. On one hand, it is obvious that digital methods and the analysis of the social media users’ behavior in particular have a lot to offer as a quick and easy method to study not only those aspects covered by surveys but also those never studied before.
At the same time, a lot of questions arise to what extent the social media users’ analysis will correspond to the results of surveys, that is, how reliable and representative the obtained data can be. The issue of representativeness makes some scholars express doubts as to how scientific these digital methods are (Marres, 2017). At the same time, the popular manifest Anderson (2008) declares that the scientific method has become obsolete in the age of abundance of data generated by digital equipment. Schober et al. (2016) believe that it is an issue that scholars studying the behavior of the social media users and conducting surveys have different experience, background, and descriptive language.
Nevertheless, despite all these issues, a lot of studies appeared, which analyze wellbeing, happiness, and quality of life based on the data on human behavior from the social media. The majority of such studies analyze happiness, subjective wellbeing, and satisfaction with life from the point of view of positive psychology. Many of such studies utilize charts and indicators adopted in positive psychology (for instance, charts by Diener, Seligman, and others). Hao et al. (2014), for example, used the machine learning technology to predict subjective wellbeing of the social media users. The authors used the data on 1,785 volunteers from Sina Weibo to teach the algorithm. The volunteers were asked to fill in questionnaires to assess positive and negative affects (Positive and Negative Affect Schedule [PANAS]) and to evaluate psychological well-being scale (PWBS). The authors saw significant correlation between the predictions of the algorithm and the survey results. According to some indicators of subjective wellbeing, the correlation coefficient equals to .4–.6. Schwartz et al. (2016) performed a similar study based on the data from Facebook. The authors used the subjective wellbeing models (satisfaction with life) and PERMA М. Seligman to assess subjective wellbeing based on the updated Facebook statuses and tweets. In this study, they showed which topics and words used by the users correlate to various elements of the given wellbeing models. For example, such words as “friends,” “family,” and “wonderful” are evidence of the positive assessment of wellbeing, whereas swearing is the evidence of the negative assessment.
Chen et al. (2017) conducted an experiment where they studied the possibility to predict satisfaction with life as one of the elements of subjective wellbeing. The authors were analyzing the updated statuses of Facebook users for about 3 years. They took profiles of myPersonality users who were tested according to five-item satisfaction-with-life scale suggested by Diener et al. (1985). Then, they used machine learning methods to analyze opinions and feelings these users express in their updated statuses and compared these data with the test results. The authors came to the conclusion that the values of satisfaction with life predicted by means of machine learning have only moderate correlation with the self-reported values.
Yang and Srinivasan (2016) developed a very special method to study life satisfaction. The authors used the above-mentioned scale of satisfaction with life by Diener et al. (1985) to develop sample answers for their survey, which may reflect satisfaction with life or lack of such satisfaction. Each sample includes numerous equivalent expressions. Then, for 2 years, the authors used Twitter to search for and study similar expressions in the first person demonstrating the level of the user’s current satisfaction with life. The authors filtered out the tweets, where reasons of such satisfaction or dissatisfaction were given, as well as tweets with indications of the past or the future, and so on. Thus, the authors measured the emotional condition of people they experienced at the given moment. One of the important results the authors of this article obtained is the assumption stating that life satisfaction reflected in tweets does not depend on the external events (political, seasonal, etc.), which has no correlation to the results of any other studies.
Schwartz et al. (2013) used Twitter to assess subjective wellbeing in 1,293 counties of the United States. The authors state that the model of Latent Dirichlet Allocation (LDA) studies of tweets can be used to predict the level of life satisfaction with the same accuracy as surveys. They distinguished several topics associated with positive subjective wellbeing (for instance, physical activity, support and charity, etc.), but negative topics are much less varied. Wang et al. (2014) spent a year to study profiles of Facebook users to assess their satisfaction with life level according to Diener scale and compared these results with Facebook’s Gross National Happiness index, which is calculated on the basis of the number of positive and negative words used in the users’ updated statuses. In this study, the authors doubt that it is possible to apply linguistic analysis of internet messages to study the users’ psychological condition.
At the same time, apart from the studies of psychological wellbeing of the social media users, attempts are made to use the social media data to assess various social indicators. Sanchez et al. (2017), for instance, study the potential of new data sources to measure social indicators. In their article, the authors analyze the social indicator of active citizenship, where the data on the number of people staying in contact with politicians via Twitter are a measure of that. For 42 days in the midst of the municipal elections, the authors were collecting tweets addressed to the politicians by citizens of three Spanish cities (Cádiz, Seville, and Madrid). Next, the authors determined the number of unique users, who sent tweets to the politicians from these cities; based on these data, they determined the level of active citizenship, which, in its turn, is one of the indicators of quality of life, according to Eurostat. The most exciting in this study is the fact that the authors compare the determined data with the results of the sociological survey the goal of which was to measure the given social indicator. They analyze benefits and drawbacks of the new data sources (such as Twitter) and conventional surveys to obtain information about the society. We analyze these results more thoroughly in the “Discussion” section.
Antenucci et al. (2014) study unemployment (job loss) as an important social indicator based on the analysis of Twitter messages. For 28 months in 2011–2013, the authors were analyzing the tweets related to job loss. For that, they used key words where the fact of job loss was mentioned, like “lost job” and so on. The authors consider such signals as a new measure of economic activity, which reflects the market situation well enough. Based on them, it is possible to make real-time predictions as related to the economic activity level.
During 2008–2013, Algan et al. (2019) used search queries in Google to analyze them with Google Trends. As search queries, the authors used two lists of words related to subjective wellbeing. The first list was taken from “Better Life Index,” an online database with responses to the following question: What does better life mean for you? The second list is based on an American survey of time use, where the routine activities of Americans are fixed, as well as positive and negative emotions related to certain life episodes. The authors also added a number of words related to different life situations associated with wellbeing, like employment issues (e.g., “unemployment”), poverty (“coupons”), or family stresses (“refuge for women”). The authors divided the search queries into 12 categories, which, in their turn, were further divided into three groups reflecting the most significant life aspects: material conditions (job search, labor market, financial stability, and personal finances), social (family stress, family time, civil engagement, and personal safety), and health and wellbeing (health condition, healthy habits, activities in summer, education, and life ideals). The authors excluded private finances from the models because that period (2008–2013) was that of the financial crisis, which resulted in predominance of the related words (like mortgage). Thus, the significance of such words was very specific of that period.
Within the scope of this research, we assess a certain set of social indicators giving us information on quality of life in the corresponding regions. As opposed to the mentioned studies, we do not use the data from personal accounts, but we use messages in different communities, while as a unit of measurement, we use the parameters of popularity of those messages (likes, reposts, and comments) and not the number of words or messages.
Methodology of the study
The methodology of our study consists of several subsequent stages:
Development of a quality of life model;
Selection of VK communities;
Classification of posts and messages in those communities;
Automatic content analysis in the selected communities;
Calculation quality of life index (QOLI) for different regions of Russia.
Model of quality of life
As was mentioned above, in this article, we attempt to assess quality of life in different regions of Russia by using digital tracks left by the social media users and, in particular, in regional communities in Vkontakte. To do that, we address quality of life as a measure of satisfaction of objective human needs. We agree with Sirgy’s (2002) assumption who defines the “need satisfaction approach to subjective wellbeing” as follows: people have numerous needs, and those who are more successful in satisfying them are happier and more satisfied with their lives than those who are less successful in satisfying their needs. These multiple needs are from different life domains, such as employment and work, family, recreation, health, community, culture, and others. More successful (and, consequently, happier and more satisfied) people tend to arrange these spheres of their lives much better. Thus, to assess quality of life, we need to establish a unit of measure for satisfaction of basic human needs. We need to make a list of the needs we can assess on the basis of the social media data.
There is a complex research problem we have to solve—to identify the basic human needs and, respectively, to determine the vital life domains. The current studies identify a lot of such domains. In this article, we do not analyze different lists of life domains (needs), which are indicators of quality of life. Let us only mention the study conducted by Cummins (1996), who analyzed lots of papers on quality of life and identified seven important life domains (out of 351): material wellbeing, health, productivity (work or some other forms of creative activities), intimacy (social and family relations), safety, community (social relations and participation in social life, etc.), and emotional wellbeing (recreation, spiritual wellbeing, moral qualities, etc.).
To determine life domains we are to analyze in this article, we have to consider the specific character of the data source we selected. As such data source we use “urban communities” from Vkontakte. They are normally open communities where various aspects of life in a respective city are discussed. The members of such communities are free to publish posts (normally moderated). As these communities are public and focused on a certain region or city, the information posted in them is concentrated around social life; thus, some aspects related to private and family life are not discussed there. Certain aspects of financial wellbeing are not touched upon as well.
The users express their opinions about financial wellbeing in one case only—when they face unfair wages. Still, such discussions are rare and normally induced by some news related to low wages or social payments for certain population categories (teachers, doctors, migrants, retired, large families, disabled, etc.), which leads to heated discussions of fairness or lack of fairness in the respective situations. At the same time, financial wellbeing depends greatly on the initial expectations of the users and non-conformity with the actual wages, as well as on prices for certain goods and services in the respective region. Thus, we decided not to isolate financial wellbeing into a separate indicator but to include it into the categories of “Goods” (here we include opinions on prices and availability of certain goods), social support on behalf of the state (here we include opinions on social payments to the retired and those in need), as well as “Political resolutions” (as the majority of opinions on the wages of doctors, teachers, etc. [the so-called state employees] are related to unfair wages in these areas).
Regarding the other life domains identified by Cummins (1996), we categorize them as follows. We assess “Health” on the basis of “Health care.” This indicator gives no information on the expectancy of healthy and active life or on certain diseases the community suffers from, but it reflects the way the population in the respective region perceives and assesses the availability and accessibility of medical services and medical institutions (hospitals, clinics, etc.). We singled out “Education,” which includes quality and accessibility of education for the population of the respective region, even though Cummins failed to mention this life domain. We believe that quality and accessibility of all levels of education is a key to success and to wellbeing. We measure “Productivity” on the basis of “Work”; here we apply the same approach as in the case of “Health.” We collect statements of participants of different urban communities related to labor conditions, to possibilities to find a job in the respective city or region, to wages, and so on. “Safety” as a social indicator includes messages about crimes and incidents in the respective city and statements of different special authorities like the police, the fire service, and others.
We assessed “Community” based on the social indicator we designated as Relationships between people, which includes all messages about friendliness or hostility and about the behavior of people (strangers, neighbors, colleagues, and relatives). To assess emotional wellbeing of the population in the respective city or region, we used statements about their general emotional wellbeing. We included both messages on spirits and feelings (joy, anger, etc.) and general statements on one’s satisfaction with his or her life not related to a certain topic (e.g., “I like living in this city” or, on the contrary, “it’s impossible to live in this city”). Leaping ahead, it should be noted that we managed to collect just a few statements on the general emotional condition as compared with the other indicators, which can be the evidence of that fact that people do not tend to express their emotions in the communities we studied.
Apart from the life domains we analyzed, our model of quality of life also includes several social indicators characterizing quality of the urban and natural environment, where people live in their respective regions. These are the social indicators related to formation of the housing and utilities sector (power and water supply, sewage, garbage removal, renovation of buildings, improvement of adjacent territories, communal building services, and other services related to residing in the respective houses), infrastructure (condition of roads in cities, traffic, traffic jams, snow removal from roads and around buildings in winter, functioning of sewage, etc.), and environment (environmental conditions—contamination of water, air, soil). We also added several economic and social indicators, based on which we can assess accessibility and availability of certain products in the respective city or region. We included statements with qualitative assessments of prices of any goods and services: low or high prices, messages on the increase or reduction of prices, messages on quality of goods and services, on availability of certain goods, on possibility to purchase different goods in the respective city or region, on diversity of the available goods and services. Consequently, we categorized statements on the increase of prices, on low quality of goods and services, and so on as negative, whereas statements in low (or reasonable) prices, high quality of goods and services, and so on were categorized as positive. The other economic and social indicators we used in our model of quality of life are related to taxation for ordinary people and entrepreneurs (“Taxes”), as well as accessibility and availability of loans and opportunities for entrepreneurship in the respective city or region (“Lending and entrepreneurship”).
A separate group of social indicators are those related to the political life; first of all, here we find rights and freedoms of the citizens, as well as how the population assesses activities of the authorities. Political indicators are important for the assessment of quality of life (Veenhoven, 1996); however, Russian studies tend to disregard them (Bokhan et al., 2013). We identified two indicators related to the assessment of such fundamental rights as freedom of speech and freedom of choice. “Media freedom” includes statements on the presence of censorship or lack of that in the media and assessment of quality (truthfulness and credibility) of information in the media. “Election freedom” includes statements on fairness of elections, rigging of elections, competition during elections, and so on. Here all levels of elections are included, starting from municipal and up to federal (in spring and autumn 2018, there were several election campaigns in Russia, first of all, the Presidential elections). We also included “Remonstrative potential,” which incorporates statements on political, social, cultural protest campaigns. Sympathizing and supportive messages were considered negative, whereas critical assessments were considered positive. We followed the following assumption: the more the support people express toward protest campaigns in the respective region, the higher the level of their dissatisfaction in this region, and on the contrary, the more the disagreement people show toward protest campaigns in the social media, the more the satisfaction they have with the situation, so that they want no political, social, or cultural changes.
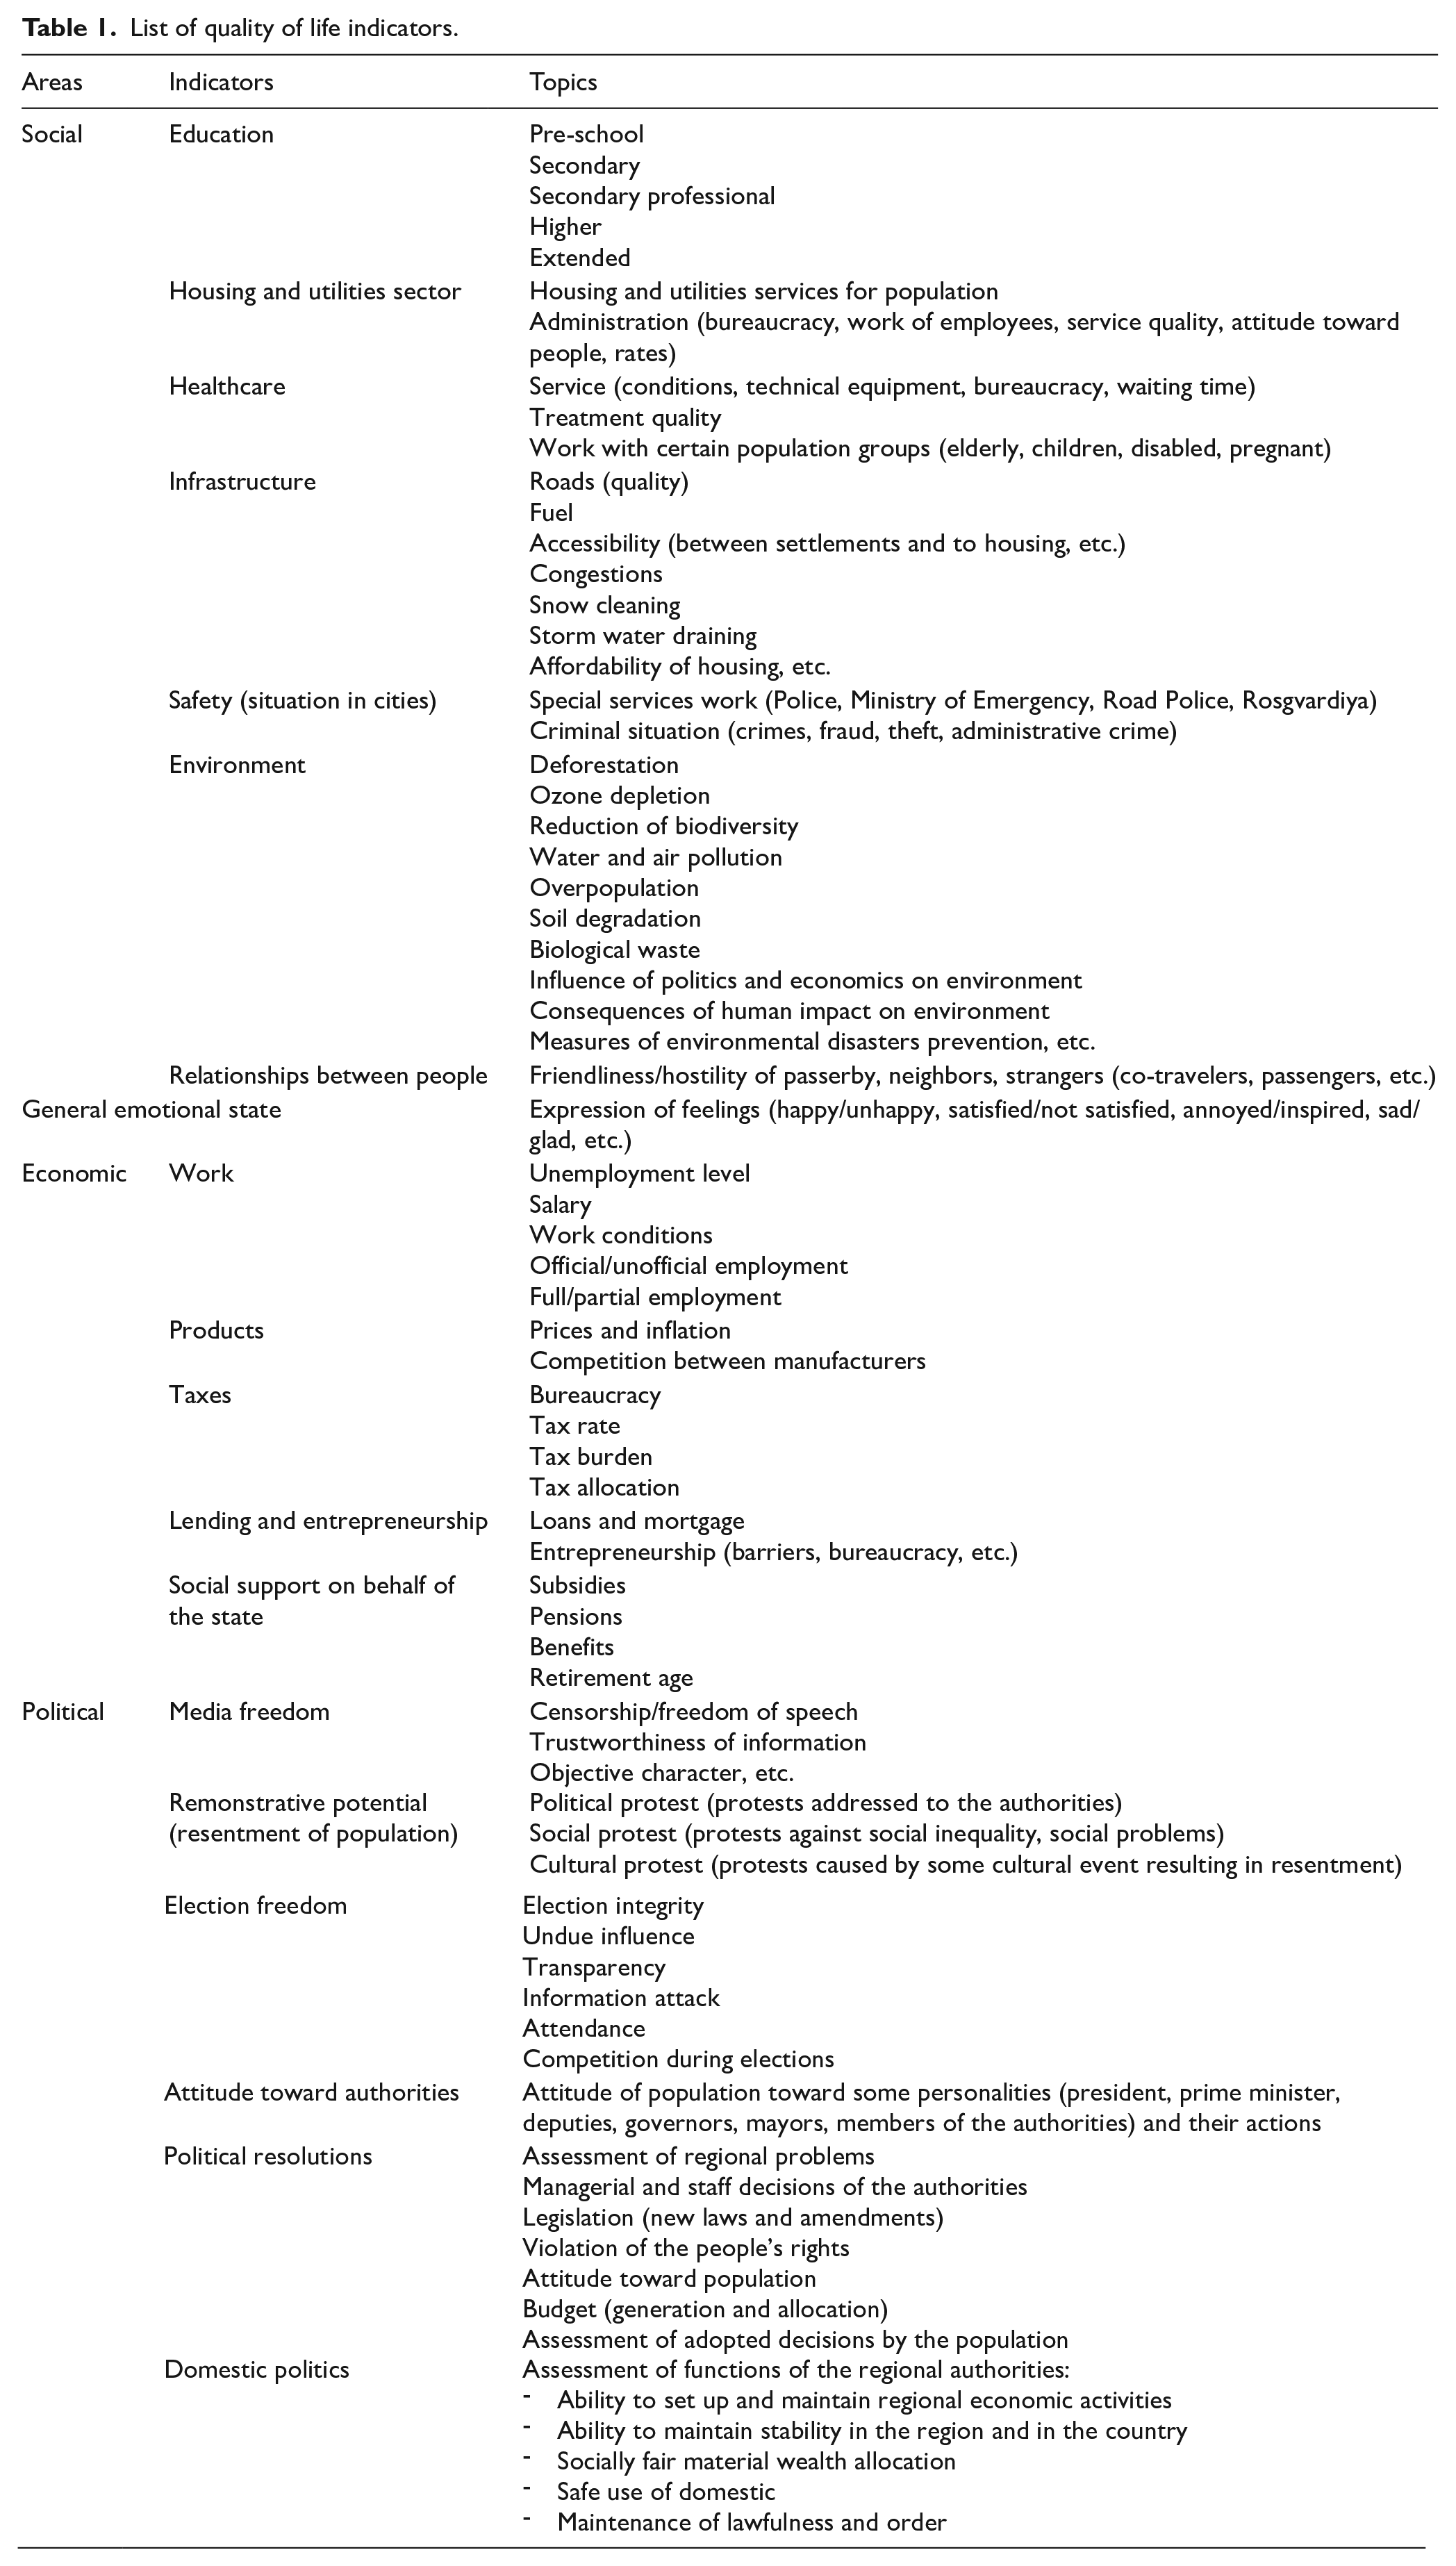
Apart from the three political indicators we mentioned, we also use those with direct assessment of the authorities’ activities. Attitude toward authorities includes positive or negative assessment of activities and personalities of certain politicians (the President, ministers, the State Duma deputies, governors, etc.). Such statements are personalized and contain mentioning of a name or position of a certain politician, such as Putin, president, prime minister, Medvedev, governor, mayor, and so on, last names of certain governors, mayors, and other politicians. The category “Political resolutions” includes statements on definite decisions and initiatives of the authorities, such as pension age increase. The category “Domestic politics” includes all theoretical statements not related to a certain politician or a political decision. These are statements with general assessments of the authorities’ abilities to ensure development of the region, to cope with issues in this region, or, on the contrary, their inability to do that. In Table 1, we list all mentioned social indicators and some key topics we used to categorize messages we processed.
List of quality of life indicators.
Selection of VK communities
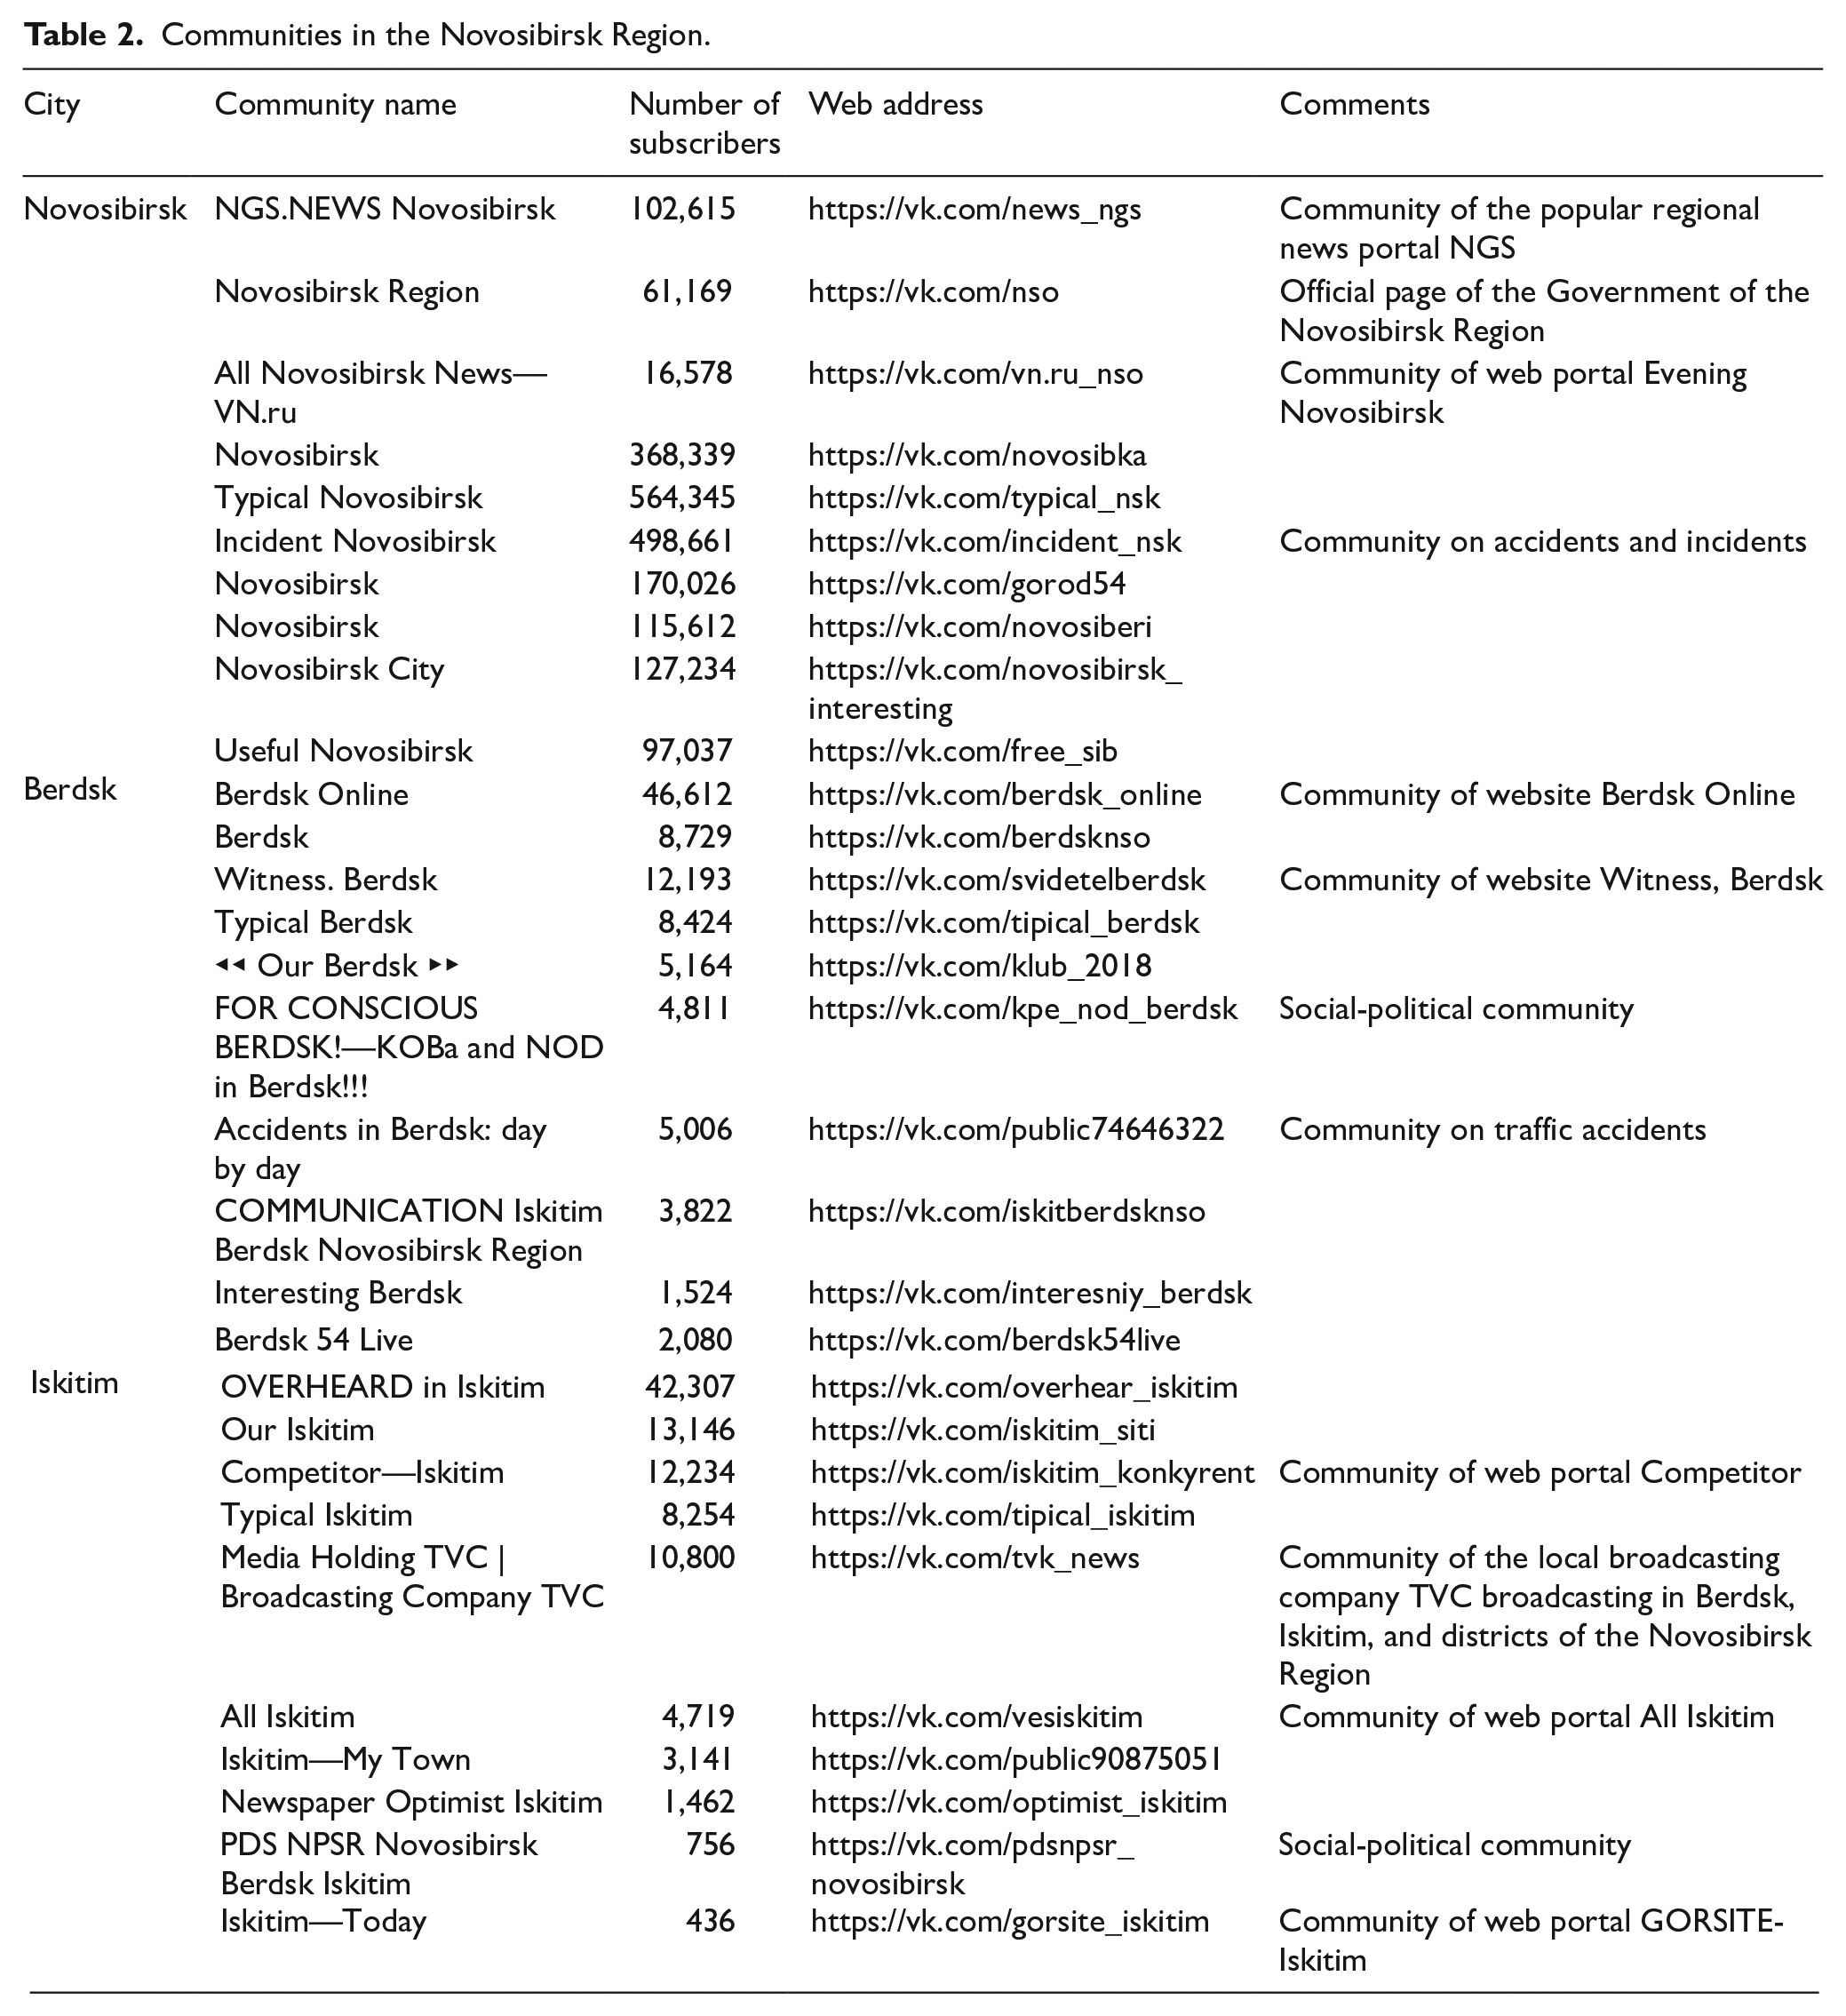
In our study, we have included 83 out of 85 regions of the Russian Federation. We have not managed to collect data on two regions: Chechnya and Mordovia. In each of these 83 regions, we have determined 3 largest cities and selected 10 VK communities discussing life there. We have defined them as “urban communities.” In Table 2, we give an example of communities from the Novosibirsk Region. The three largest cities in this region are Novosibirsk (1,625,000 people in 2020), Berdsk (104,000 people), and Iskitim (56,000 people). It should be noted that these communities are represented by the residents of the nearby areas (municipal districts) directly related to these cities economically and socially. Thus, we can state that these communities consist not only of the residents of the mentioned cities but also of those who live in the municipal districts around these cities: Novosibirsk district (138,000 people) and Iskitim district (60,000 people) (the cities themselves are not included into the municipal districts). The city of Berdsk has no municipal district. The total population of the Novosibirsk Region is 2,786,000 people, while the mentioned municipal districts have the population of 1,983,000 people (71% of the total population in the region).
Communities in the Novosibirsk Region.
From this perspective, we believe that the cities in the Novosibirsk Region we included into our study are representative of the whole population of the region and of quality of life in this region. Thus, we can get the corresponding picture of quality of life here. Unfortunately, not in every Russian region the majority of the population resides in three largest cities or towns and their municipal districts. Thus, we have to mention that the method we offer embraces the population of large cities. In the “Discussion” section, we focus on that in a more comprehensive way.
We have filtered the communities according to several criteria:
They publish informative posts on social, economic, and political life;
They publish posts of their subscribers with info on social, economic, and political life;
The published posts contain sentiments on news and events.
We have excluded the following communities:
Online shops and other commercial groups;
Groups with information on sports and cultural events and personalities;
Communities of public places (restaurants, clubs, cinemas, etc.);
Food delivery services;
Communities on health, nutrition, fitness, etc.;
Communities on exchange of items and charity;
Communities with storytelling, stories, and questions;
Dating communities;
Job offer communities.
In some regions (the Buryat Republic, Dagestan, Ingushetia, Tatarstan), we have included 10 regional groups not connected with any definite city. In these regions, there are more than three large towns where the majority of the population is concentrated, so here we have included general regional groups to increase representativeness. In some regions with high population density in large towns, we have selected only two or even one of them (like in Nenets Autonomous Area). We have searched for the communities manually and selected the largest ones corresponding to the above-mentioned criteria. In doing so, we have built a cluster of 2,410 communities.
Classification of messages and posts in communities
At the next stage of our study, we have used the social media data collection and analysis platform of the university consortium of big data researchers (www.opendata.university), developed by the team of the Laboratory of Big Data in Social Sciences of Tomsk State University, to download the materials from the selected communities. We have downloaded all messages, posts, and comments for the period between 1 January and 31 December 2018. After that we have deleted all “junk” like advertising, as well as the information beyond the scope of this study (job offers, sports and cultural events, free exchange, contests and campaigns, recipes, delivery and food, astrological predictions, sales of items, dating offers, discussions of private life of participants, etc.). We have deleted the “junk” in two stages: (1) manual cleanup of approximately 60,000 messages and (2) automatic cleanup based on the specially designed algorithm trained during manual cleanup. We have left only the messages of 20 words and longer, and we have deleted all repeated messages. After cleanup, we have left only approximately 3.3 million messages. At the same time, we have categorized the messages according to indicators (given in Table 1) and style (positive, negative, neutral).
Below we demonstrate how we determined the topic and mode of messages.
Tomsk wants to build the overhead railway. The administration of the Tomsk Region received a suggestion to build the private overhead railway in Tomsk. Rinat Bachurin, an entrepreneur from St. Petersburg, suggests building the first line of the overhead railway of up to 10-km long with more than 10 stations.
Dear residents of The Green Hills!! Today the traffic layout in the ring Entusiastov-Klyueva is getting back to normal and we won’t be able to leave our residence area again. Let us not be silent and let us protect our right for accessibility of the traffic! I have already written an application to the Governor, to the Administration, and to the Department of Traffic and Development. I am appealing to you to do the same.
On behalf of the passengers using Line 54, I am expressing my utter gratitude to the Bus Company for its responsibility and timely arrival of buses, namely Line 54, despite there was an issue with payment for the ride today. Despite all circumstances, the bus arrived on time, according to its normal timetable. All passengers entering the bus kept looking for the conductor with cash, cards, or smart phones in their hands wishing to pay for the ride. It was really embarrassing to travel without paying for that anyway. This is still someone’s labor, in this case, the labor of the driver. Thank you  for not leaving us alone and arriving on time.
We included all these messages into the category of “Infrastructure,” as they are all about the traffic and transportation system in the region. Message 1 was categorized as neutral, as it contains the information on possible improvement of the traffic system in the city, which can be implemented in future. This message has no emotional assessment. Message 2 was categorized as negative, as it is about some changes making the traffic in one of the city parts worse. Message 3 was categorized as positive, as here the author expresses his or her gratitude to the employees of the bus company and the drivers, who kept to the schedule despite payment issues.
Each of these messages has three parameters. If we assess them, we can understand how active the users are in responding to the messages. Likes, comments, and reposts demonstrate this. The more reactions the users show toward these messages, the more important it is for the social media users and, respectively, the more important is the social indicator the message refers to. For qualitative assessment of quality of life in the region, we used not only the data on the number of messages with a certain emotional implication on each of the indicators but also the data on the reaction of the users to the corresponding message.
Automatic content analysis in selected communities
The database set includes posts from the walls of the regional VK communities retrieved through its public application programming interface (API). Each post had to be categorized into 1 of the 19 categories or as “junk.” The method is based on machine learning technologies of retrieval of unknown patterns from these texts. To create an automatic algorithm of texts classification, we have used the following conventional libraries of machine learning: Scikit Learn (https://scikit-learn.org/stable/), Pandas (https://pandas.pydata.org/), Numpy (https://www.numpy.org/), as well as a set of tools known as Natural Language Toolkit (NLTK; https://www.nltk.org/) for the natural language analysis. The algorithm is based on Python 3 programming language.
At the data preprocessing stage, we have deleted symbols belonging to neither English nor Russian alphabet. We have used stemming to bring all words to their basic forms. We have deleted all rare terms, which could have been typos. To be able to use different classification methods, we had to present the texts in the vector form. To transform the texts into the terms significance vector, we have applied term frequency–inverse document frequency (TF-IDF), where the word weight is used in proportion to the frequency these words occur in a document and in inverse proportion to the frequency of the word use in all documents from the sample. TF-IDF is frequently applied to present documents as numeric vectors reflecting the significance of each term from a certain term set (a number of terms determine the vector dimension) in each document. For each vector, we have taken into account not only separate terms but also digrams, that is, pairs of consecutive terms.
We have conducted a number of experiments to determine the best data for learning. To do that we have checked several data sets, including the number of comments, likes, reposts, and views and the number of words in a post. All these values have been scanned in accordance with their average value in a community the corresponding text was taken from. We have also considered the vectors of significance for the comments to the posts retrieved the same way, as well as for the posts texts. After that we have determined the best data set for this task: significance vectors of the words in the posts, the scanned number of words, and the number of comments, likes, reposts, and views.
Based on the obtained data, we have built the machine learning models. We have conducted a number of experiments, where we have categorized the samples as the one for learning and the one of a text, with their subsequent validation to select the most accurate model to classify categories and attitudes. After that, we have checked the models of gradient boosting, where we have used a prediction model as an ensemble of weak predictive models and the random forest with variations of hyper parameters. In the end, we have selected the models demonstrating the best result for the corresponding task. We have implemented the gradient boosting from LightGBM library. We have validated the data to determine the accuracy of the obtained models. The accuracy of the indicator’s classifier is 68%, and the accuracy of the attitude classifier is 79%.
QOLI for regions of the Russian Federation
After that, we calculated the QOLI for each of the selected regions. In this article, we calculated the QOLI in two stages. At the first stage, we calculated the online activity index (OAI) based on the data on the number of messages in different modes for each of the social indicators and the data on the users’ responses to those messages. The OAI is calculated as follows
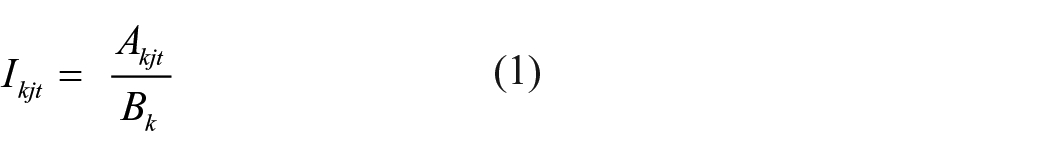
where Ikjt is the OAI for the respective region (k) for the indicator (j) for a certain mode (t). This index determines how intensively people discuss the respective topic in a certain region with account of the mode of messages. The OAI showcases urgency of the message for the region and subjective assessments of this indicator by the social media users.
Аkjt is the value on online activity in the certain region for the certain value of subjective quality of life; it is calculated according to the formula

where L is the amount of likes collected by the messages on or around a certain value of quality of life in the certain region in the certain attitude.
C is the number of comments collected by the messages related to the certain value of quality of life in the certain region. We have equated each comment with two likes because, in our view, this action of a user is an evidence of importance of these messages for the commentator. Here a like is a passive form of demonstrating support of this message.
R is a number of reposts of the messages on the certain value of quality of life in the certain region. We have equated each repost with five likes because, in our view, a repost is an evidence of complete and active support of this message by the user. This action means that the user not only expresses his or her consent with this message but also openly demonstrates his or her solidarity with the message. As compared with various forms of online activities, a repost is an evidence of the greatest topicality of this subject for the user. These values of weighing coefficients were calculated empirically after several tests and after discussing the calculated weighing coefficients in the previous publications.
Bk is a total number of subscribers in all selected communities in the region. This value demonstrates a relative value of online activity for this region.
k is a number of each region (1–83). The study involves 83 out of 85 regions of the Russian Federation. We have not managed to collect reliable data for two regions: Mordovia and Chechnya.
j is a topic of messages, that is, an indicator of quality of life, which we have included into the model of quality of life (1–19) (according to Table 1).
t is the attitude of messages (0, 1, or 2).
Thus, Ikjt shows intensity of discussion of a topic in the selected communities in the selected region. It is an evidence of urgency and topicality of this subject for the population of the region. Ikjt has been calculated for each attitude, that is, for each region, OAI has three values: one for positive attitude Ikj1, one for negative attitude Ikj2, and one for neutral attitude Ikj0. Attitude is defined as an emotional evaluation of a message; thus, the positive attitude means that the message contains some positive evaluation or expression of approval of some news or situation mentioned in the message; the negative attitude means it contains disapproval, resentment toward the contents of the message, while the neutral attitude means the message is purely informative and contains no evaluation.
The next calculation stage QOLI implies aggregating the calculated OAIs. Ikjt was calculated on the monthly basis, so we averaged the obtained monthly values in scale of the total period of study (during a year). To do that, we calculated the monthly mean value Ikjtm. The mean value Ikjtm was calculated by adding the OAI Ikjt for each month and dividing the sum by 12
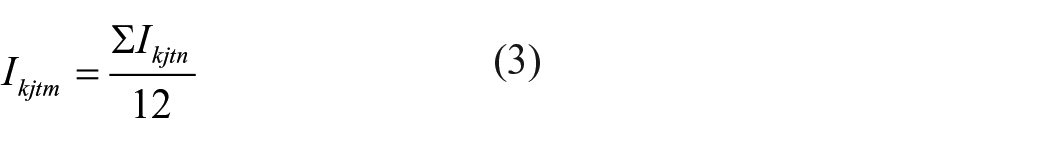
where n is each month of the year (January to December 2018).
Next, we determined the quality of life index QOLIkj for the respective region by subtracting the mean monthly values of the OAI for the positive Ikj1m and negative Ikj2m modes

where Ikj1m is a mean monthly OAI in the positive mode and Ikj2m is a mean monthly value of the OAI in the negative mode.
When we calculated the QOLI, we did not take into account the neutral messages. The final value of the QOLIk(tot) for each region k was calculated as a sum of the QOLIkjm for all indicators of quality of life j

We calculated the QOLI for separate indicators QOLIj(tot) as a sum of the QOLIkjm values for all regions k

Results of the study
Based on our results, we are able to draw conclusions on two parameters of online discussions of various quality of life indicators: attitude and intensity of these discussions. On one hand, we see prevalence of negative publications (we observe negative values in all indicators), which means that the OAI value for the negative attitude was higher than the one for the positive attitude (Table 3 here).
Quality of life index for separate indicators.
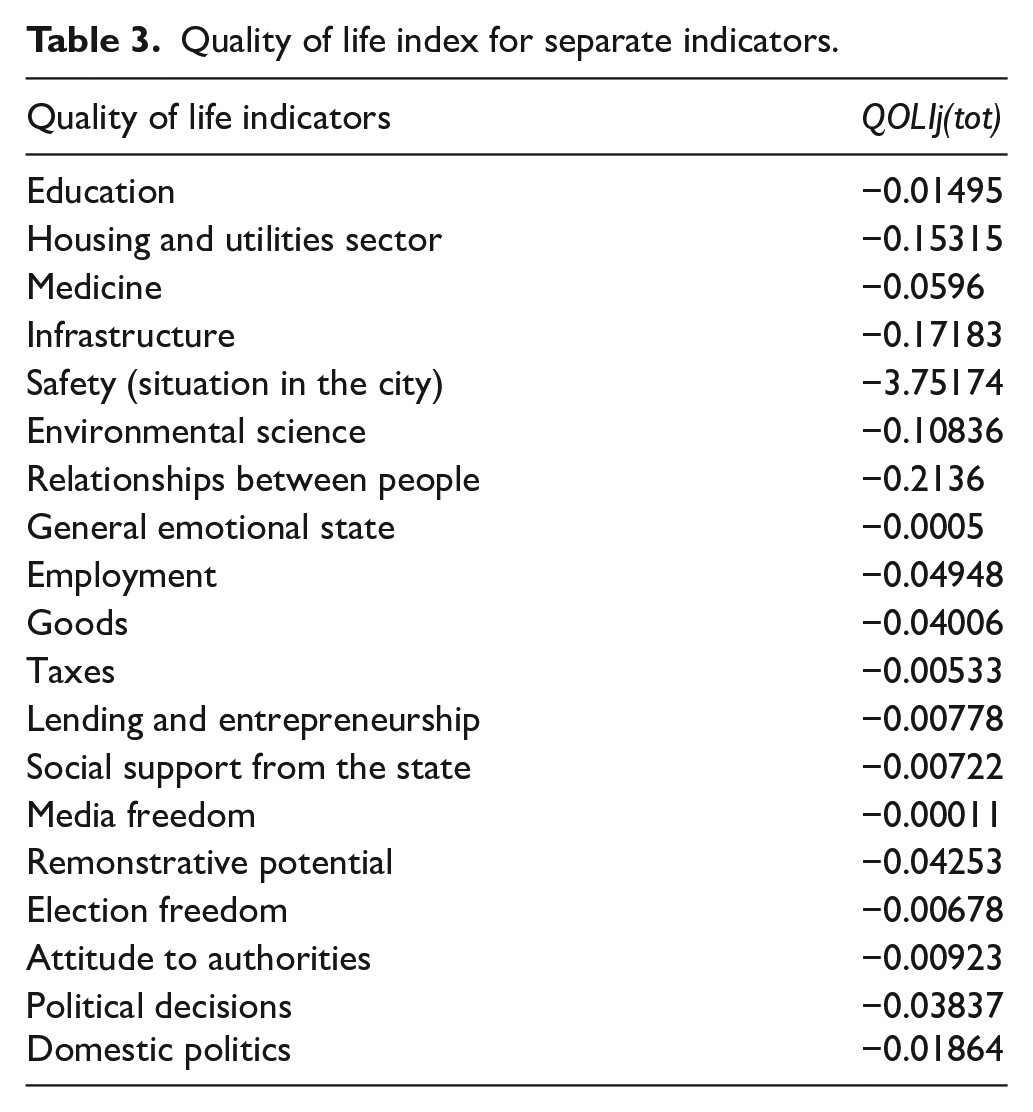
Thus, we come to the conclusion that in general the population is not satisfied with its quality of life. On the other hand, we see that safety is an unprecedented leader of all parameters, meaning that this topic is a subject of the most heated online discussions. Such indicators as relationships between people, infrastructure, housing and utilities, and environment attract far less attention.
Then, we have a close group consisting of such parameters as the condition of medicine, employment, remonstrative potential in the region, goods (assessment of the commercial state of the region), and assessment of political decisions taken by the regional authorities. Such topics as domestic politics, education, assessment of actions of certain political figures, as well as lending and entrepreneurship, social support by the state, freedom of elections, and taxation attract even less attention. Thus, the suggested QOLI is an indicator of social problems. It demonstrates the degree of dissatisfaction of the population with living conditions and indicates the most urgent issues for the people.
Such topics as freedom of speech in the media and general emotional state of the population cause the least interest. Low intensity of discussion of one’s own emotions can be explained by both cultural factors (reluctance to openly discuss one’s feelings and spirits) and the specific character of the selected communities (mostly they are informative communities discussing general problems typical for a certain region and settlement, problems faced by communities and not by individuals). It is possible that surveys can help to obtain more accurate data on this parameter. Low interest in freedom of speech in the media can be explained by the fact that this topic is discussed within the context of general political issues. So, freedom of speech in the media is blended with the general discourse on protests.
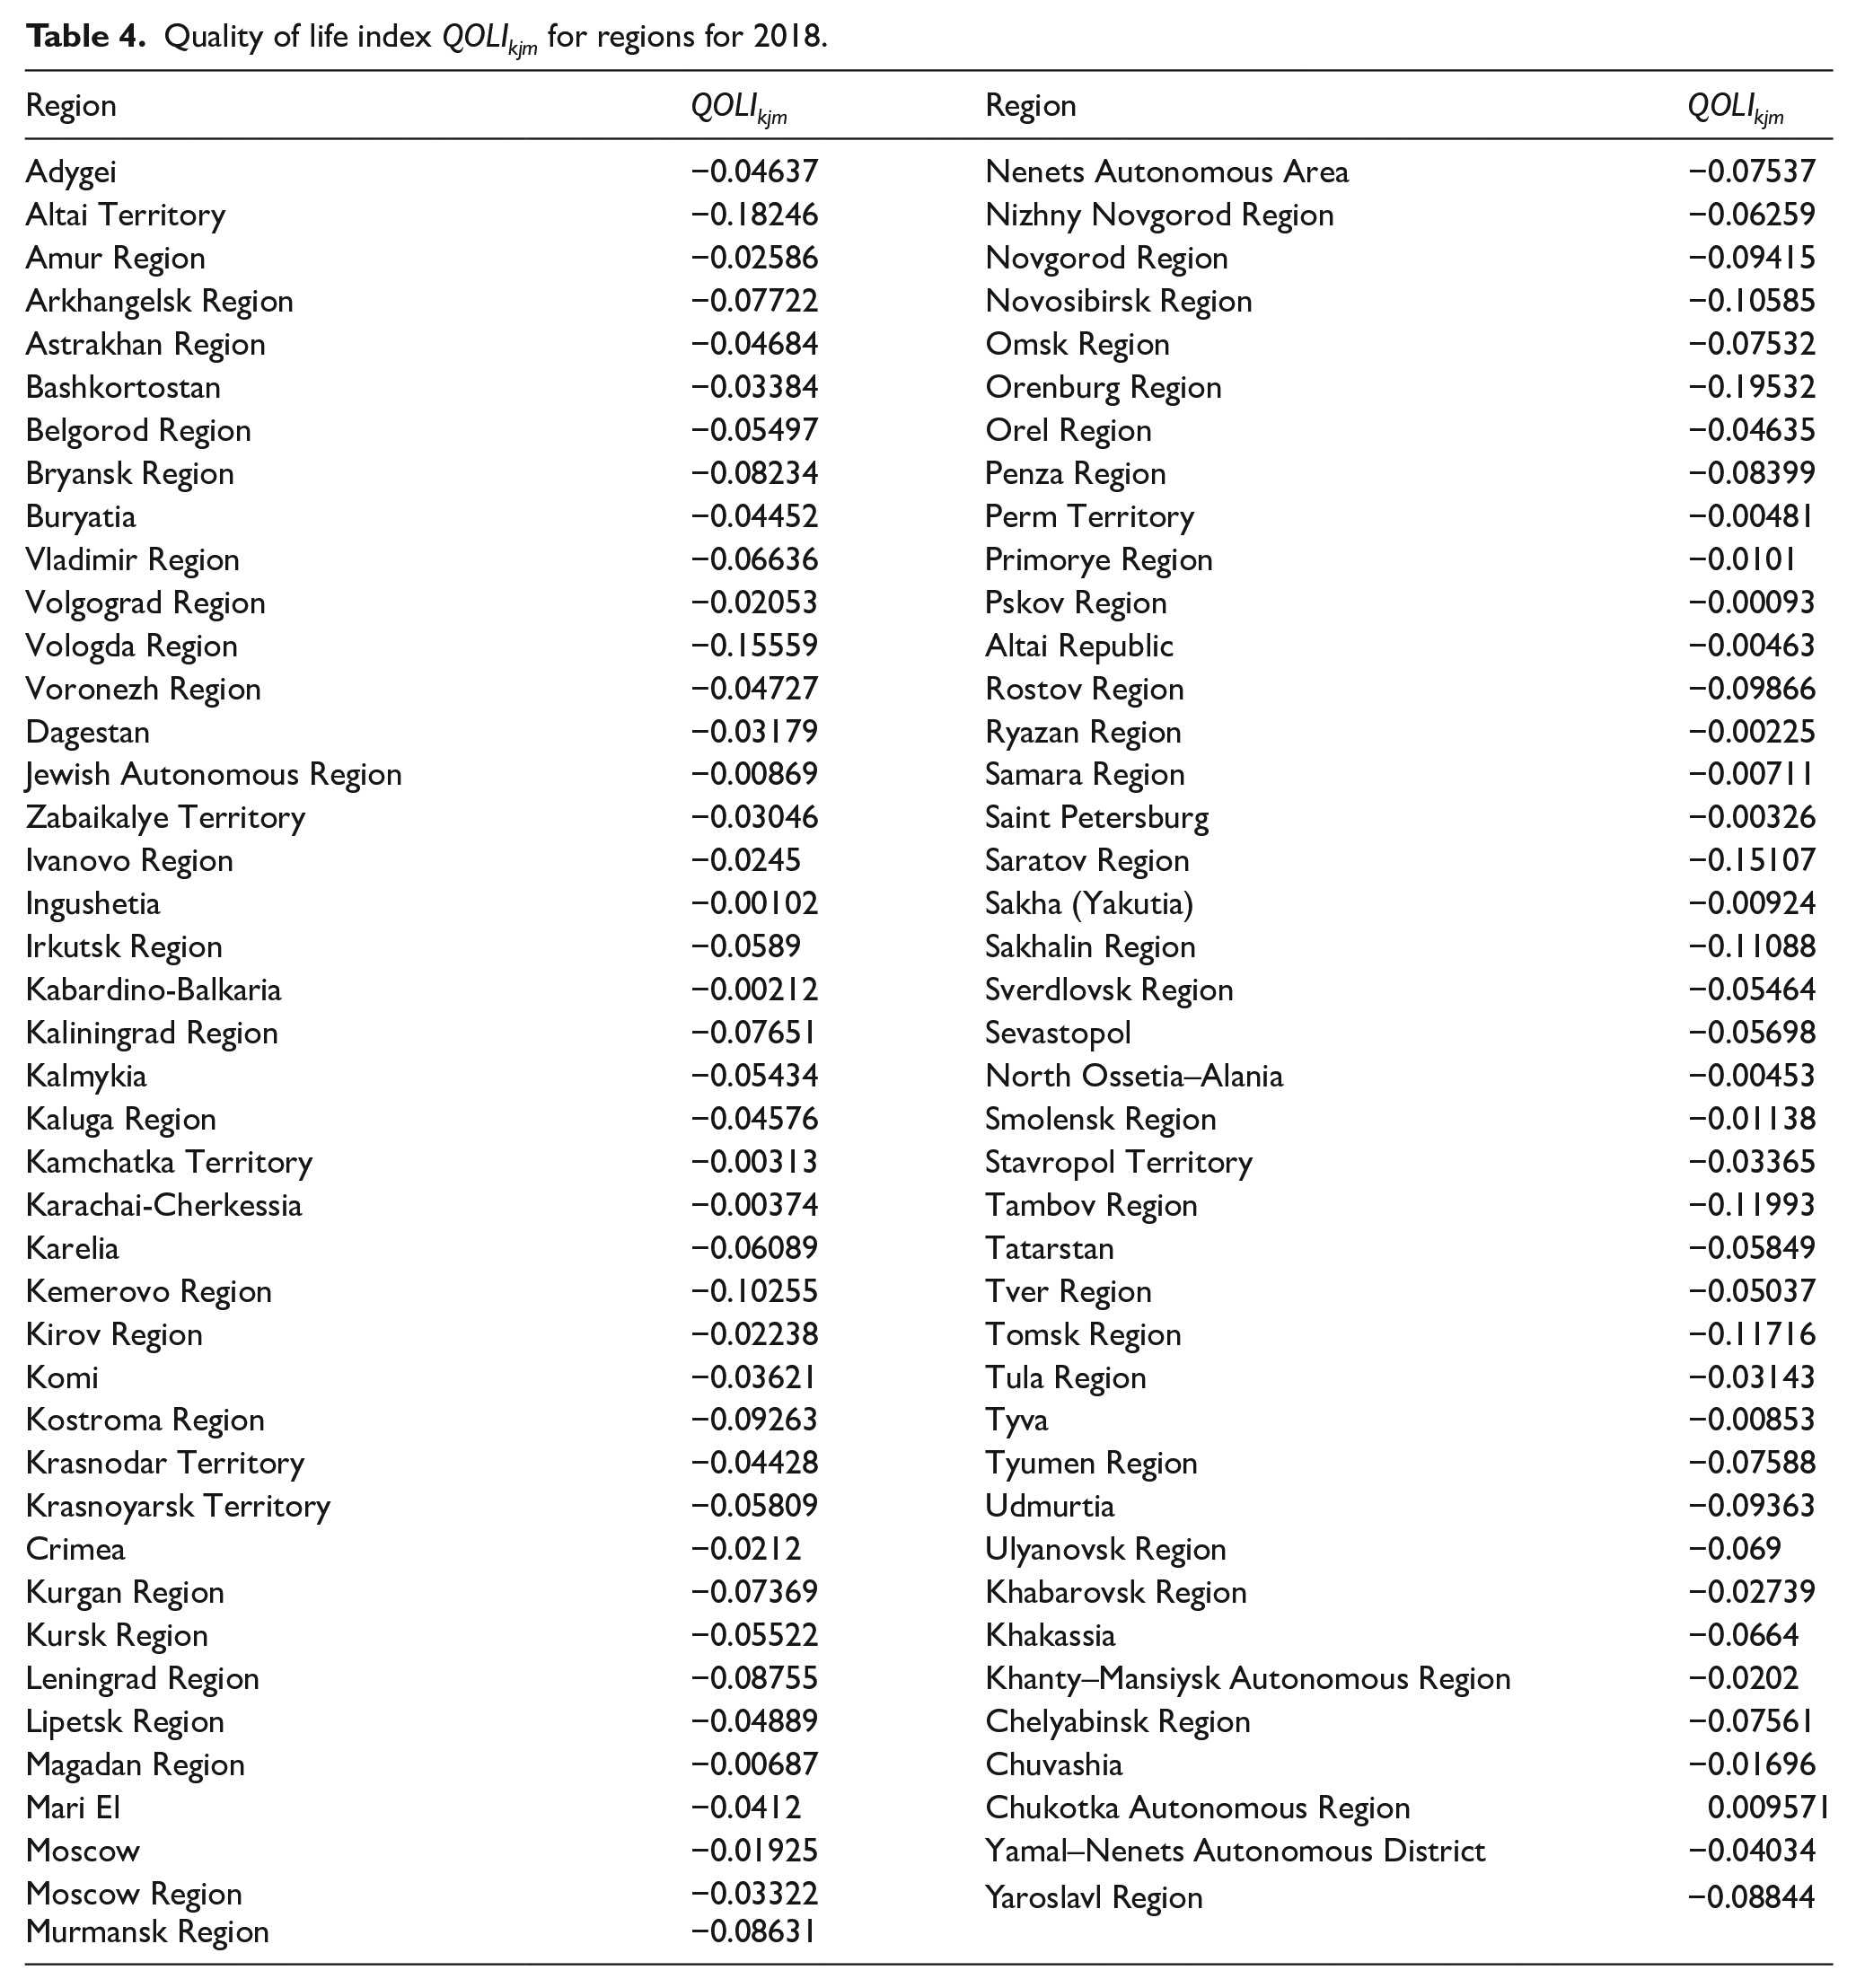
If we look at the data on the regions (Table 4 here), we see that in most regions, the QOLI is negative. The exception is the Chukotka Autonomous Region, where the OAI with the positive attitude is higher than the one with the negative attitude. The total positive QOLI in this region is made up from parameters such as the condition of infrastructure, employment, social support by the state, assessment of political decisions, and domestic politics. The remaining parameters are either negative or zero (i.e., they are not discussed in the selected communities or their messages are neutral). The regions with a “high” negative QOLI, but close to 0, include a number of national republics in the North Caucasus (Ingushetia, Kabardino-Balkaria, Karachai-Cherkessia, North Ossetia–Alania), as well as Altai Republic. The Pskov and the Ryazan regions, the Kamchatka and the Perm territories, and the city of Saint Petersburg have somewhat negative value of the QOLI. At the opposite pole of this list, we see the highest value of the life quality index represented by the Orenburg Region and a number of regions in the Western Siberia (Altai Territory, the Tomsk, the Novosibirsk, and the Kemerovo regions). This group also includes the Vologda, the Saratov, the Tambov, and the Sakhalin regions.
Quality of life index QOLIkjm for regions for 2018.
In Table 5, we present the data on OAI in three different attitudes for all indicators of quality of life: Ikj1 for the positive mode, Ikj2 for the negative mode, and Ikj0 for the neutral mode. This index evaluates the intensity of online activity in various regions according to different attitudes expressed in posts.
Online activity index Ikjtm in three attitudes for 83 regions.
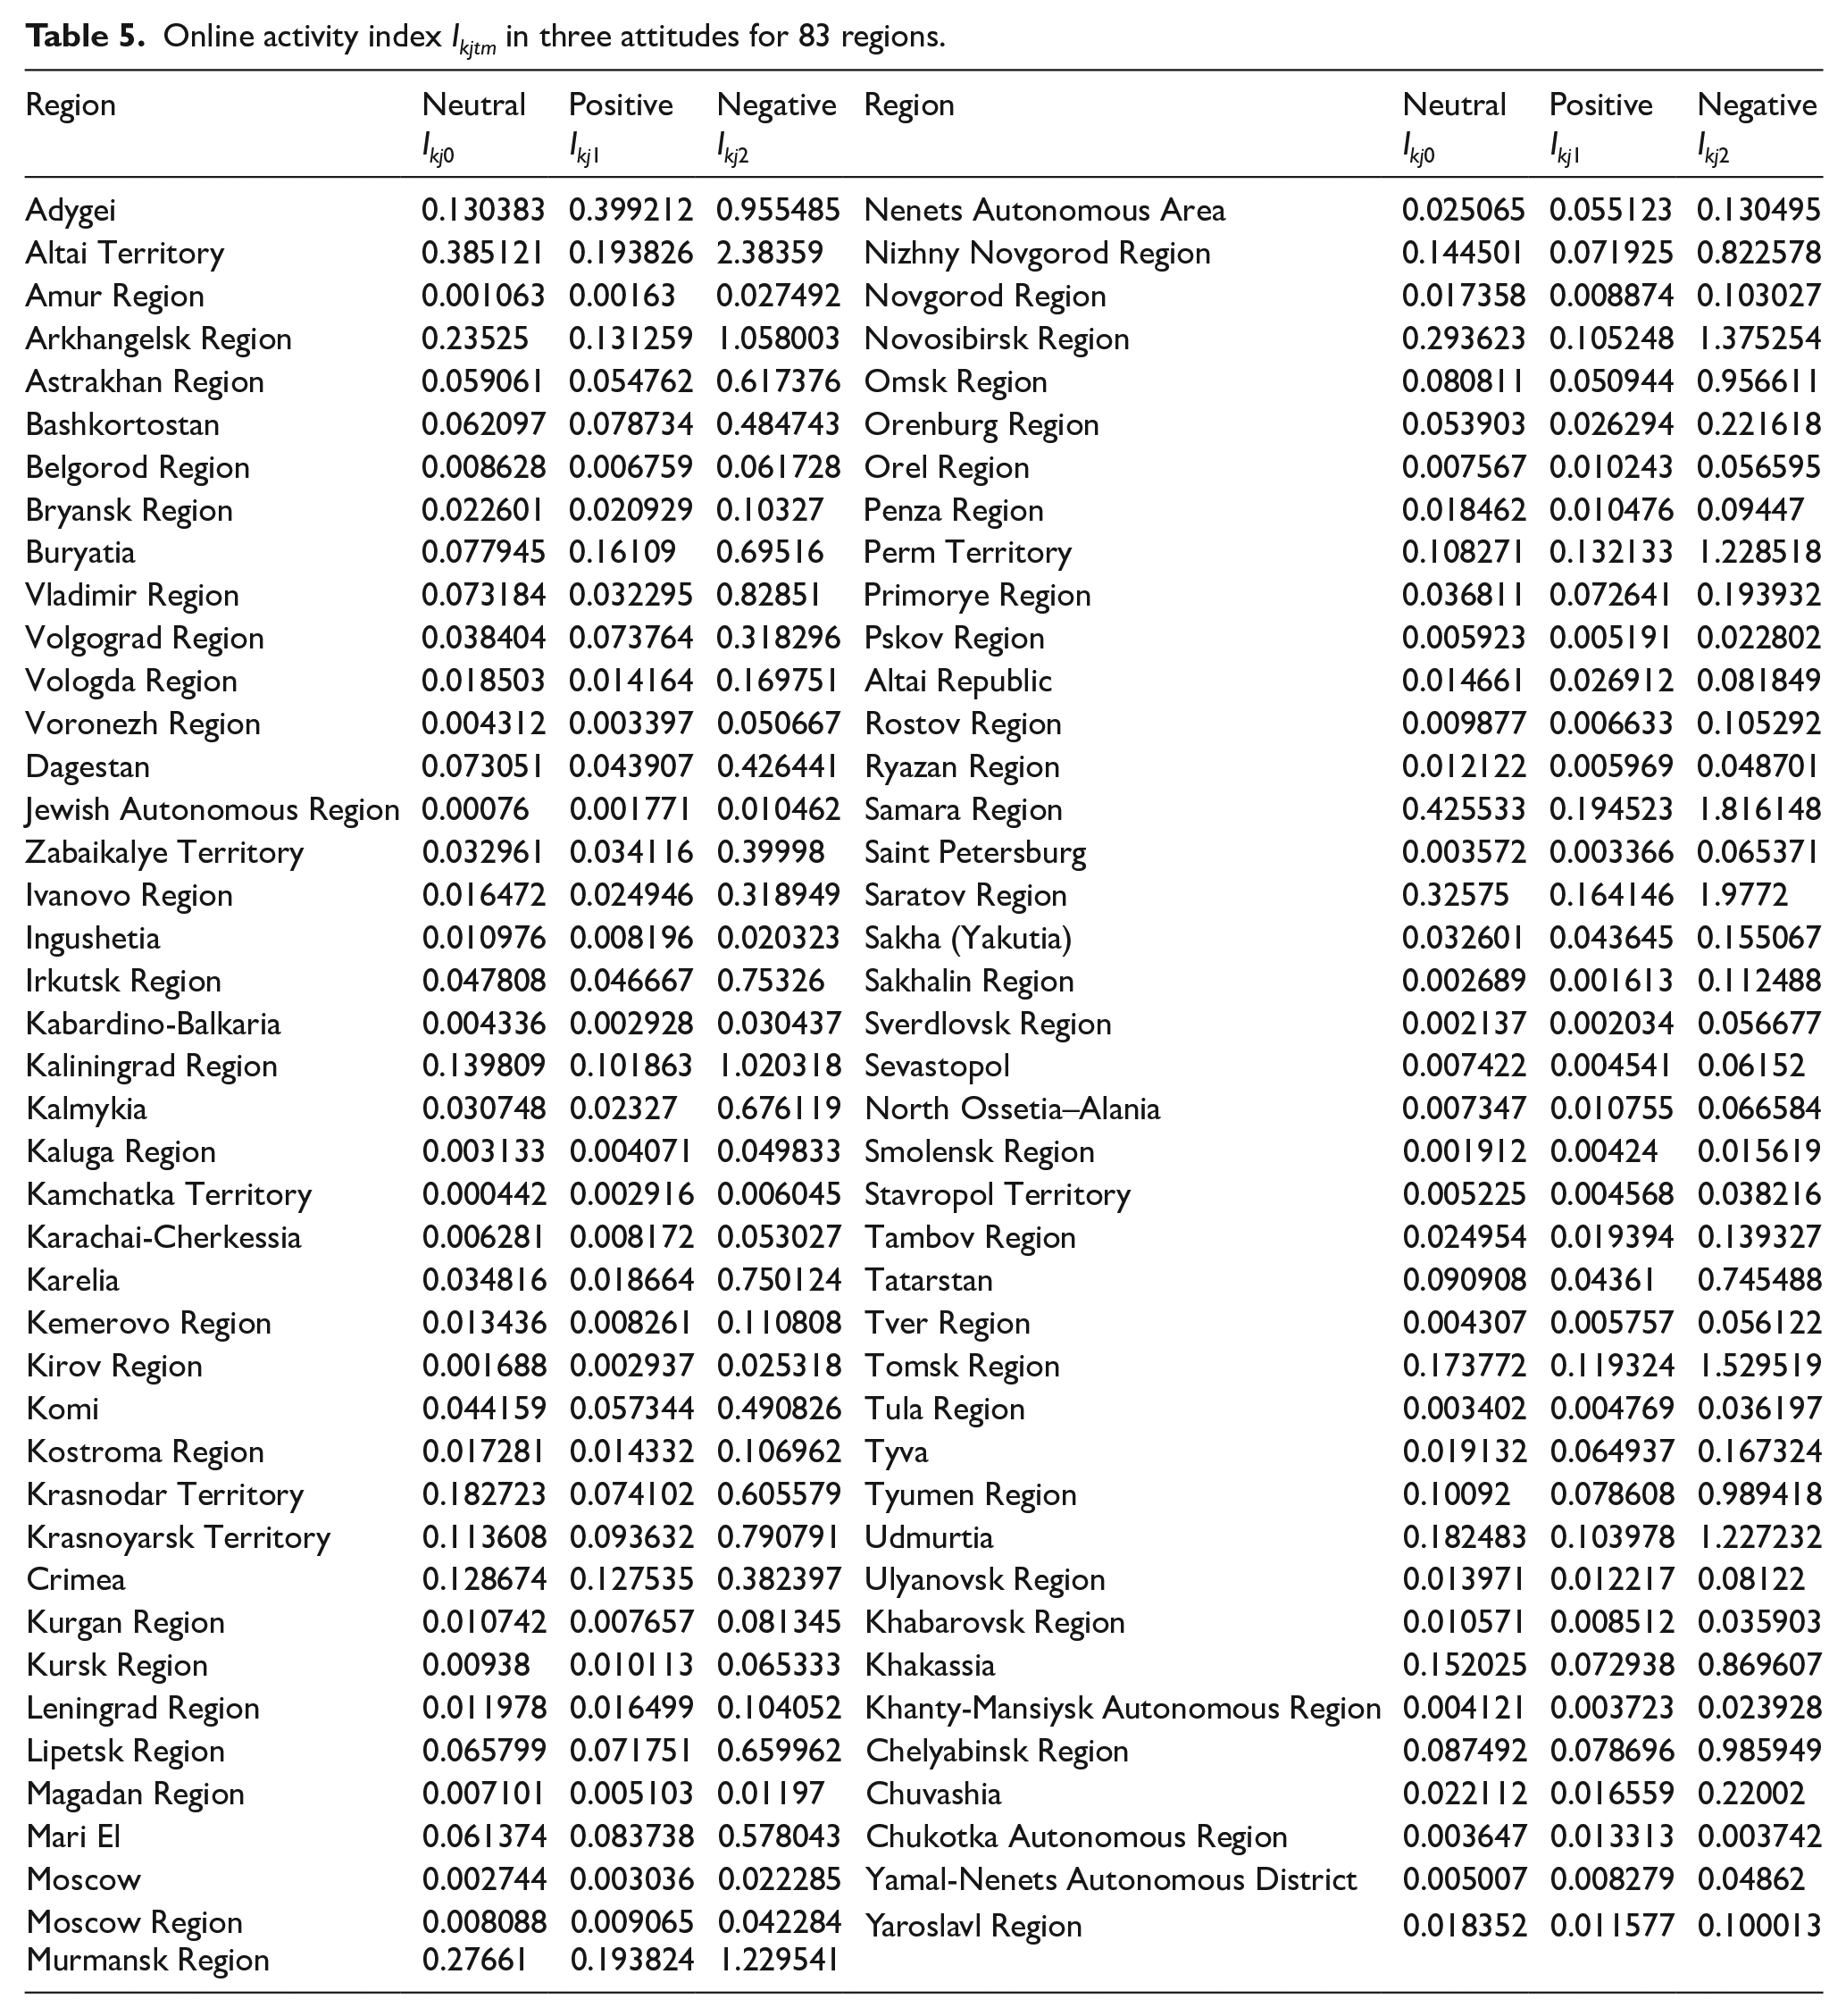
Thus, we have a very distinct picture: online activity in different attitudes has some evident patterns. In a certain way, our results demonstrate possibilities and limitations of the method. It is acceptable in the regions with high intensity, whereas for the regions with low intensity, some other methods of assessment have to be designed. This requires further investigations.
Discussion
The method we suggest has obvious advantages, but it also has evident drawbacks. The advantages tend to correspond to those of the digital methods to study life quality and wellbeing Sanchez et al. (2017) believe that the advantages of this method of quality of life assessment based on the social network data include higher particularization of the users’ assessment allocation in time and space, that is, the obtained information is more detailed and accurate. This information is available at any moment; the data can be downloaded online. A virtue of this method is its quickness, relatively low cost, and flexible methodology; the method is adjustable to any tasks and goals, whereas surveys consist of fixed questions making it easier to compare the results and the subsequent studies. But should the goals of studies change, surveys can no longer react flexibly to the urgent issues. Sanchez et al. (2017) come to the conclusion that Twitter-based data can be used to measure social indicators, and, though it is still impossible to level up the above-mentioned limitations, these data can definitely be used as supplementary to the results of some official surveys. This is especially true for smaller settlements where official surveys bring no representative results.
As to the drawbacks of our method, apart from the common limitations typical for all online methods, some specific limitations can be mentioned, which we identified while working on this study. Sanchez et al. (2017), for instance, note that the most important drawback of Twitter as a data source (the same can be said about all other social media) is issues of the sample representativeness. Users of the social media do not represent the whole population; they only represent the “digital population,” that is, just a portion of the population. This issue also means that we only study “voluntary” messages, not provoked by some factors.
Messages in social media are “extraordinary” because they reflect situations, which differ from conventional everyday experience of these users. These are the events, which caused surprise at the least and stronger emotions in many cases. The content we analyzed arises as the result of a strong emotion, which frustrates a person and makes him or her express the feelings. This character of the data we used serves as the cause of distortions in the obtained results.
This methodological issue makes us pay attention to the “digital gap” and “digital inequality” caused by this gap. The digital gap can be defined as the “gap between individuals, households, businesses and geographic areas at different socio-economic levels with regard both to their opportunities to access information and communication technologies (ICTs) and to their use of the internet for a wide variety of activities” (Organisation for Economic Co-operation and Development, 2001, p. 5). Three levels of the digital gap are identified in Russia: differences in technologies of internet access; differences in digital skills; and differences in chances and opportunities the internet grants (Dobrinskaya & Martynenko, 2019; Gladkova & Ragnedda, 2020; Voevodin et al., 2020). For our study, Levels 1 and 2 of this digital gap are important. It is well known that people living in cities have priority in accessing the internet as compared with those living in the country; younger people have priority as compared with the elderly, while individuals with higher education have priority as compared with those having only primary education (Acılar et al., 2012). It is obvious that all those factors restrict our method.
Russian regions are different in terms of the internet availability; 83.3% of the Russian population used internet in 2018, while 68.8% of the population used it every day (Regiony Rossii, 2020). However, in regions such as the Mari El Republic, 71.1% of the population uses the internet; in the Orel Region, 71.7%; in the Jewish Autonomous Region, 72%, while in the Khanty-Mansiysk and the Yamal-Nenets Autonomous districts, this value comprises 95.3% and 98.4%, respectively. The share of the active users, those who use internet every day or every other day, has more variations. In the Republic of Khakassia, this share comprises 50.8% of the population; in the Tver Region, it makes 53.8%, while in the mentioned Khanty-Mansiysk and Yamal-Nenets Autonomous districts, it is 86.9% and 90.1%, respectively.
This issue gets more complicated because of the fact that we used only the data from Vkontakte, the most popular but not the only Russian social network. Its popularity is different depending on the region and the settlement type. According to the surveys (February 2021), 68% of the Russian population use social media, out of which 55% are users of Vkontakte (Fond Obshchestvennoye Mneniye, 2021). These values demonstrate substantial population coverage; however, if we have a closer look at the distribution of Vkontakte users by age, we see that in the age group 18–30 years, this social network is used by 77%; in the age group 31–45 years, this value equals to 53%; in the age group 45–60 years, it is 25%, while in the age group 60+ years, only 7% use it. Thus, our study is representative of the opinions of the younger generations, while those of the older generations are much less taken into account. The older generations are hardly represented within the scope of our study, while their assessments, as we see it, can be considerably different from the perception of younger people (Peshkovskaya et al., 2021).
Next, considerable differences are also identified depending on the size of the settlement. In Moscow, for example (the population is more than 12.6 million people), only 28% use Vkontakte (Facebook is used by approximately the same number of people), while in cities with the population of more than 1 million people (14 cities, apart from Moscow), Vkontakte is used by 51%; in cities with the population of 250,000–1,000,000, it is used by 47%; in those with 50,000–250,000 people, 33% use it, while in towns with less than 50,000, it is used by 38% and in the country, by 28%. Thus, we can state that we were right to select those cities (the three largest cities in the region) because the share of the Vkontakte users in those cities is large. However, we must admit that a vast portion of the population (people from small towns and those living in the country) was left behind. Even if we increase the coverage of settlements and include villages and small towns, our sample will be distorted because far less people from such settlements use Vkontakte, as compared with medium and large cities.
One methodical drawback should be mentioned here. We were unable to overcome it in our study. In each region, we took the three largest cities. Normally, this approach covers the majority of the population in the respective region, as in the case of the Novosibirsk Region. However, this works not for all regions. For instance, the population of the Vladimir Region is 1,342,000 people, 647,000 of whom live in the cities (Vladimir, 357,000; Kovrov, 136,000; Murom, 107,000; and 47,000 live in the nearest municipal districts.), which comprises 48.2% of the whole population in the region. Thus, we were able to cover less than a half of the population in that region. This issue can be eliminated, if we study communities in all settlements of a certain region.
One of the limitations of our method is the fact that membership in a certain regional community does not always mean that its members currently live in the respective region. However, we assumed that if one is a member of a certain community discussing certain regional problems and events, he or she might have some connections with the respective region. He or she might have lived there before or frequently visits this region. Another limitation of the method is caused by possible influence of bots. In this study, we paid no attention to this factor. Another technical limitation is related to imperfection of the artificial intelligence. For example, it is unable to identify sarcasm of the messages. The limitations also include psychological issues of the social media users’ behavior. It is a well-known fact that users tend to react more to negative messages; thus, we see predominance of negative assessments over the positive ones.
Conclusion
This article offers a new method of subjective assessment of quality of life in different regions of the Russian Federation. This approach is not free from certain drawbacks, as was demonstrated above, but it offers a number of advantages, as compared with the conventional surveys. Further development of this method needs deeper understanding of interrelations of the obtained results with those of the conventional surveys. As was already mentioned earlier, online communication implies that people tend to react to negative contents more actively; thus, the obtained results are more indicative of problematic aspects of life in the respective region than of some achievements or positive changes. Focus on problems does not mean that life in those regions is bad or difficult. But it makes us understand what really worries people, what events or happenings reduce their satisfaction with life and worsen their quality of life.
We believe that the advantage of messages in the social media as a data source lies in the fact that they are equivalent, though very roughly, to the “direct speech” of the users expressing their current concerns. Information, which can be received from the conventional surveys, gives us no opportunity to grasp emotions and to get a “firsthand” message left by someone who faces the issues or has concerns. That is why we believe that the offered method can be interesting to monitor the subjective quality of life in the region for the authorities and for the institutions of the civil society and public organizations. Data of such monitoring can be used to get the information about quality of life in the respective region and how people see it, and to take such information into account for solving the administrative issues and planning its development.
It should be noted, however, that we are far from assuming that the suggested method to study quality of life can be comprehensive and can replace conventional methods to measure subjective and objective social indicators. Both digital and statistical methods and surveys have their restrictions. We think it is much more reasonable to speak about the mutual complementation of these methods to get a better picture of life in the regions. Thus, alongside with conventional subjective indicators measured by surveys, “digital” indicators can be applied, which are based on the analysis of the digital footprints left by the users.
Footnotes
Declaration of conflicting interests
The author(s) declared no potential conflicts of interest with respect to the research, authorship, and/or publication of this article.
Funding
The author(s) disclosed receipt of the following financial support for the research, authorship, and/or publication of this article: This study has been conducted with the financial support by Russian Science Foundation (grant no.: 18-18-00480 “Subjective indicators and psychological predictors of Quality of life”).