
Abstract
Background
Cerebrospinal fluid (CSF) α-synuclein seed amplification assay (αS-SAA) is a recognized biomarker of synucleinopathy. In Parkinson's disease (PD), its potential for predicting clinical outcome needs to be further assessed.
Objective
To evaluate the associations between clinical outcome and αS-SAA kinetic parameters in a retrospective cohort of PD patients, also investigating whether CSF total protein content influences such associations.
Methods
Study cohort included cognitively unimpaired PD (PD-CN, n = 40), PD with mild cognitive impairment (PD-MCI, n = 44), and PD with dementia (PDD, n = 10) with available clinical assessment at baseline. Among them, n = 28 PD-CN and n = 31 PD-MCI patients had 2-year follow-up, and CSF biomarkers reflecting pathophysiological pathways other than synucleinopathy.
Results
In PD-MCI, αS-SAA time-to-threshold (TTT) is associated with longitudinal changes in Mini-Mental State Examination. The association is stronger when accounting for CSF total protein concentration.
Conclusions
αS-SAA TTT may represent a prognostic factor for cognitive decline in PD-MCI.
Plain language summary
Parkinson's disease is characterized by the pathological aggregation and the consequent accumulation in the brain of a protein named alpha synuclein. We can check whether this protein is present in vivo (before autopsy) with a test performed on cerebrospinal fluid, called ‘α-synuclein seed amplification assay’. This test is not only able to verify if alpha synuclein pathology is present or not, but it has also the potential to investigate how much this protein has the pathological capability to aggregate. The potential of this test to predict signs and symptoms of the disease is currently being investigated. Therefore, we wanted to evaluate the correlation between this test and the clinical picture of 94 patients with Parkinson's disease, both cognitively unimpaired and impaired (both mild cognitive impairment and subjects with dementia). We observed that some measures of this test were associated with cognitive worsening over time. This is an important result because we can obtain in vivo prognostic information regarding cognitive worsening over time.
Introduction
Cerebrospinal fluid (CSF) α-synuclein seed amplification assay (αS-SAA) is an established method of detection for misfolded α-synuclein aggregates (seeds), serving as a diagnostic biomarker for synucleinopathies, such as Parkinson's disease (PD). Available data show an excellent αS-SAA performance in discriminating PD, even at the prodromal stage, from healthy controls and other disorders not related to α-synuclein misfolding. 1 The kinetic profile of α-synuclein amplification in αS-SAA may reflect the intensity of ongoing synucleinopathy, thus providing a measure of disease severity. In vitro, αS-SAA kinetic parameters representing amplification time: i.e., time to 50% maximum fluorescence (T50) or time to threshold (TTT) have a logarithmic association with the quantity of synthetic aggregates in the biological matrix tested.2–4 In CSF, total protein content represents a factor influencing αS-SAA result, since high-molecular weight CSF components, specifically lipoproteins, have an inhibitory effect on α-synuclein aggregation. 5 Therefore, investigating the effects of adjusting by CSF protein content the association between αS-SAA kinetic parameters and clinical outcomes might be of clinical relevance.
Here, we sought to investigate possible correlations between αS-SAA kinetics and clinical measures in a well-characterized PD cohort. To this purpose, we considered PD patients for whom a thorough clinical evaluation at baseline and follow-up, as well as a CSF neurochemical characterization, were available. 6 Additionally, we aimed to assess whether variations in CSF total protein concentration could have an influence on these associations.
Methods
Patients
A consecutive series of patients with αS-SAA and clinical diagnosis consistent with PD were grouped into cognitively healthy PD patients (PD-CN, n = 40), 7 PD subjects with mild cognitive impairment (PD-MCI, n = 44), 8 and PD individuals with dementia (PDD, n = 10). 9 Among them, 36 patients (13 PD-CN, 13 PD-MCI and 10 PDD) were under dopaminergic treatment at the time of recruitment. A thorough clinical characterization was performed, including a 2-yr clinical follow-up for n = 28 PD-CN and for n = 31 PD-MCI patients. Both at baseline and follow-up, Mini-Mental State Examination score (MMSE) and Montreal Cognitive Assessment (MoCA) were administered. Motor assessment included MDS-Unified Parkinson's Disease Rating Scale part III (UPDRS-III) and Hoen & Yahr staging (H&Y). All the patients included underwent lumbar puncture for CSF collection at baseline visit.
CSF samples collection and biomarker analysis
Lumbar puncture was performed according to international guidelines. 10 The 24-h αS-SAA protocol developed by Concha-Marambio and colleagues was performed at Amprion Inc., as previously described. 11 Briefly, CSF samples were evaluated in triplicate (40 μL/well) in a non-binding clear bottom 96-well plate containing a reaction mix consisting of 0.3 mg/mL recombinant α-Syn (Amprion, cat# S2020), 100 mM PIPES pH 6.50 (Sigma, cat# 80,635), 500 mM NaCl (Lonza, cat# 51,202), 10 μM ThT (Sigma, cat# T3516), and two 1/8-inch Si3N4 beads (Tsubaki Nakashima). The assay was performed in a BMG FLUOstar Omega shaker/reader at 42 °C, with 15-min shaking/incubation cycles. Maximum fluorescence (Fmax) from three replicates was used for result determination; if all three replicates present Fmax higher than 3,000RFU, the sample is deemed positive (S+). If only two cross the 3,000RFU threshold, the sample is considered inconclusive (we did not get inconclusive results in this series). If one or no replicate presents Fmax higher than 3,000RFU, the sample is considered negative (S-). For αS-SAA-positive AD patients, the following SAA-derived parameters (averaged on three replicates) were included in kinetic analysis: Fmax, time-to-threshold (TTT, time to reach 3000 RFU), F24h (fluorescence at 24h), AUFC (area under the fluorescence curve), Smax (maximum slope of the fluorescence curve), TSmax (time to reach the maximum slope), and AUFCdydx (area under the derivative of the fluorescence curve). Parameters were estimated using the Omega data analysis tool Mars (BMG). CSF samples were also analyzed at the Laboratory of Neurochemistry, University of Perugia, on the fully automated chemiluminescent platform Lumipulse G600-II (Fujirebio Inc) for β-amyloid 1-42 (Aβ42), β-amyloid 1-40 (Aβ40), t-Tau and p-Tau (Thr181) levels. Based on these measurements, CSF A/T/(N) profile was considered according to previously calculated internal cutoffs. 12 Briefly, A + status was defined for values of CSF Aβ42/Aβ40 < 0.072, T + was defined for values of CSF p-Tau > 50 pg/mL, N + for values of t-Tau > 392 pg/mL. For n = 71 patients, CSF levels of soluble amyloid precursor protein α and β (sAPPα, β), neurofilament light chain (NfL), phosphorylated neurofilament heavy chain (p-NfH), total α-synuclein (α-syn), neurogranin (Ng), soluble triggering receptor expressed on myeloid cells 2 (sTREM2), and chitinase-3-like protein 1 (YKL-40) were also available from previous investigations. 6
Statistical analysis
Student's t-test was used to compare total protein concentration in αS-SAA positive and negative PD patients. Linear mixed-effects models were used to assess whether baseline αS-SAA kinetic parameters predicted cognitive change over time. Separate models were fitted for MMSE and MoCA, including an interaction term between baseline TTT and visit (baseline vs. follow-up) and a subject-specific random intercept to account for repeated measures. The model was specified as: Cognitive score ∼ kinetic parameter + visit n°+ kinetic parameter * visit n° + (1 | subject id). Pearson's correlation and partial correlation (CSF total protein concentration as covariate) analyses were applied to assess the association between αS-SAA kinetic parameters and clinical scores at baseline and follow-up in the whole PD cohort. Benjamini-Hochberg (BH) correction in correlation analyses was also applied as previously described. 11 Gaussian/linear least absolute shrinkage regularization (LASSO) was applied to αS-SAA kinetic parameters, CSF total protein concentration, and other biomarkers, to rank the relative contribution in predicting 2-year change in MMSE score. The optimal penalization parameter λ was selected by cross-validation by considering λ greater by one standard error than that producing the lowest mean squared error (λ1SE). LASSO regression was performed by using the R glmnet package. 13 All the statistical analyses were performed on R v. 4.3.1.
Results
Baseline demographic and clinical details for each diagnostic group considered are summarized in Table 1.
Clinical features, A/T/N profile and αS-SAA in the subjects included in the study.
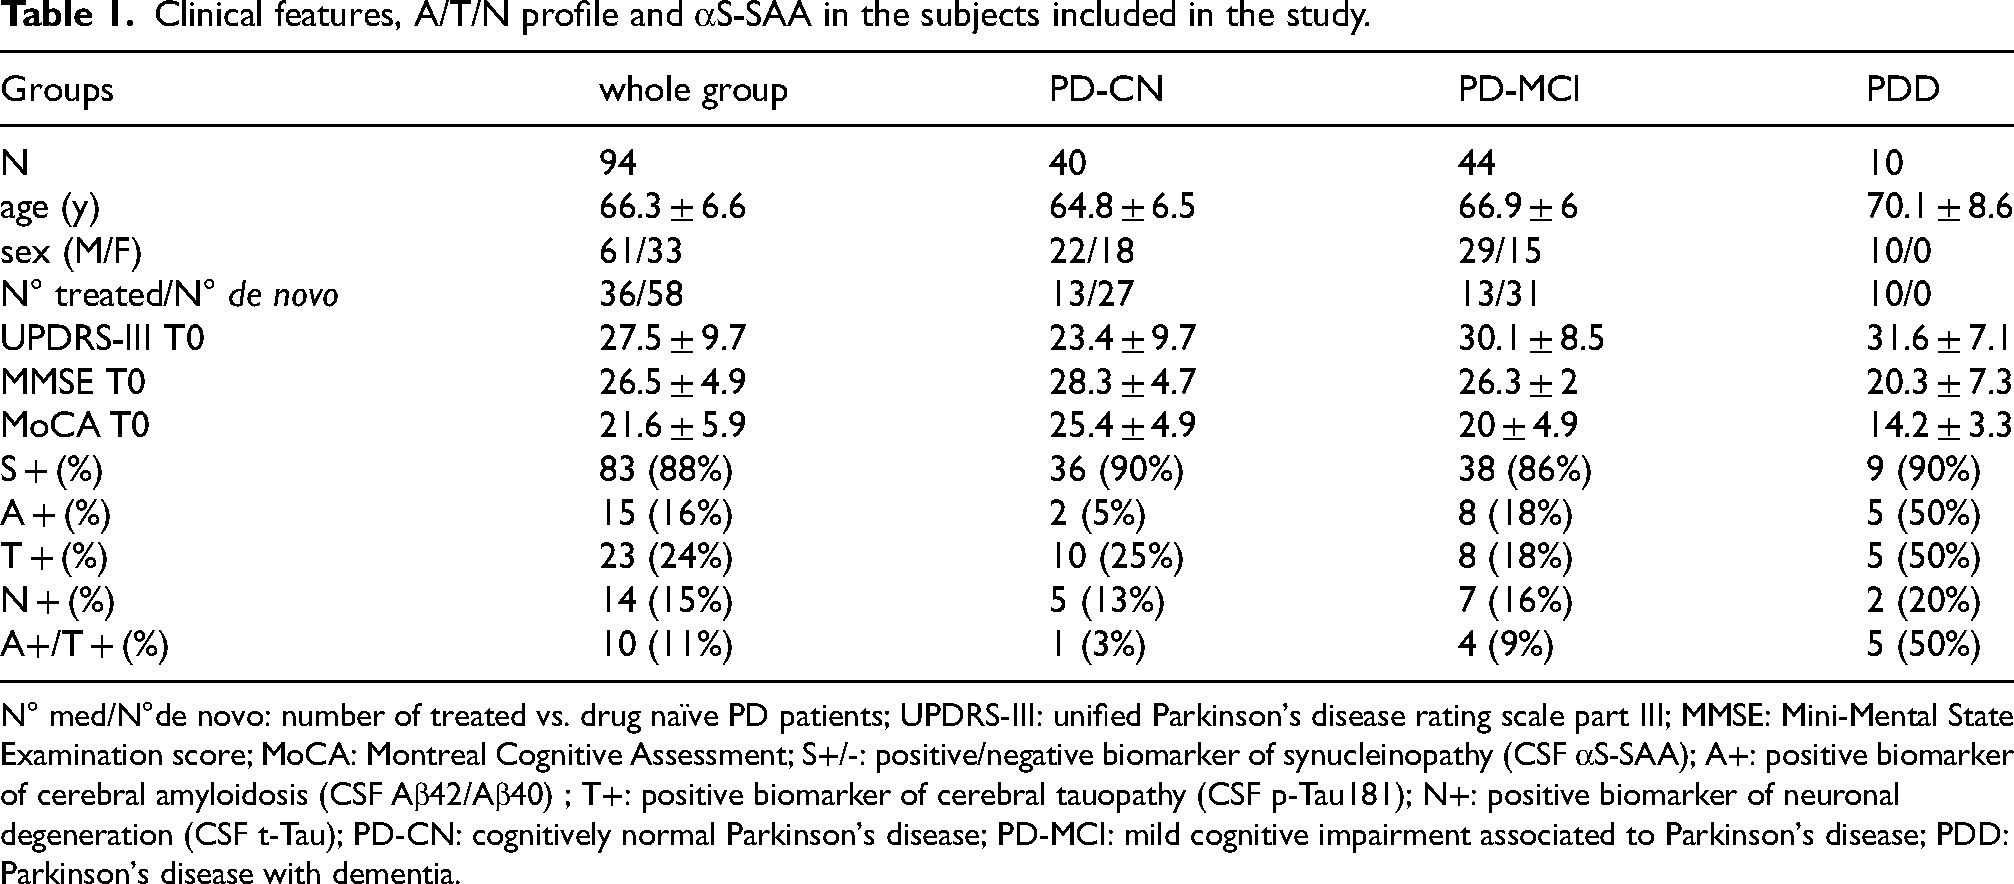
N° med/N°de novo: number of treated vs. drug naïve PD patients; UPDRS-III: unified Parkinson's disease rating scale part III; MMSE: Mini-Mental State Examination score; MoCA: Montreal Cognitive Assessment; S+/-: positive/negative biomarker of synucleinopathy (CSF αS-SAA); A+: positive biomarker of cerebral amyloidosis (CSF Aβ42/Aβ40) ; T+: positive biomarker of cerebral tauopathy (CSF p-Tau181); N+: positive biomarker of neuronal degeneration (CSF t-Tau); PD-CN: cognitively normal Parkinson's disease; PD-MCI: mild cognitive impairment associated to Parkinson's disease; PDD: Parkinson's disease with dementia.
No differences were found between treated PD/PDD patients and drug-naïve subjects in terms of CSF αS-SAA outcome and other biomarkers measurements.
Influence of CSF total protein concentration on αs-SAA kinetic parameters
In αS-SAA positive (S+) PD samples, high CSF total protein concentration was significantly associated to slower aggregation kinetics: Time-to-threshold (TTT) and time to maximum slope (TSmax) were positively correlated with CSF total protein concentration, while maximum fluorescence (Fmax), area under the fluorescence curve (AUFC), and maximum slope of the fluorescence trace (Smax) were negatively correlated with CSF total protein concentration. All these associations were statistically significant after considering multiple testing effects. Although there were significant effects on aggregation kinetics, total protein content was not found to be associated to S+/S- outcome in PD (p > 0.1), and mean CSF total protein concentration was not even found to be higher in S- PD (44 ± 11 mg/dL) as compared to S + PD (49 ± 19 mg/dL).
Association between αs-SAA kinetics and motor impairment
Among baseline clinical measures, UPDRS-III showed a weak negative association with TTT (r = −0.23, p = 0.04) and TSmax (r = −0.24, p = 0.03) (Table 2). After adjusting for CSF total protein concentration, these associations were more pronounced (TTT: r = −0.31, p = 0.006, TSmax: r = −0.31, p = 0.005). However, after multiple testing correction, the associations were not significant (p adj. = 0.06). Since UPDRS-III scores were available only for 66 patients with a short follow-up (2 years), we decided not to explore associations of longitudinal motor scores changes with αS-SAA kinetic parameters.
Pearson's correlations between αS-SAA kinetic parameters, clinical scores, age and CSF total protein content at baseline.
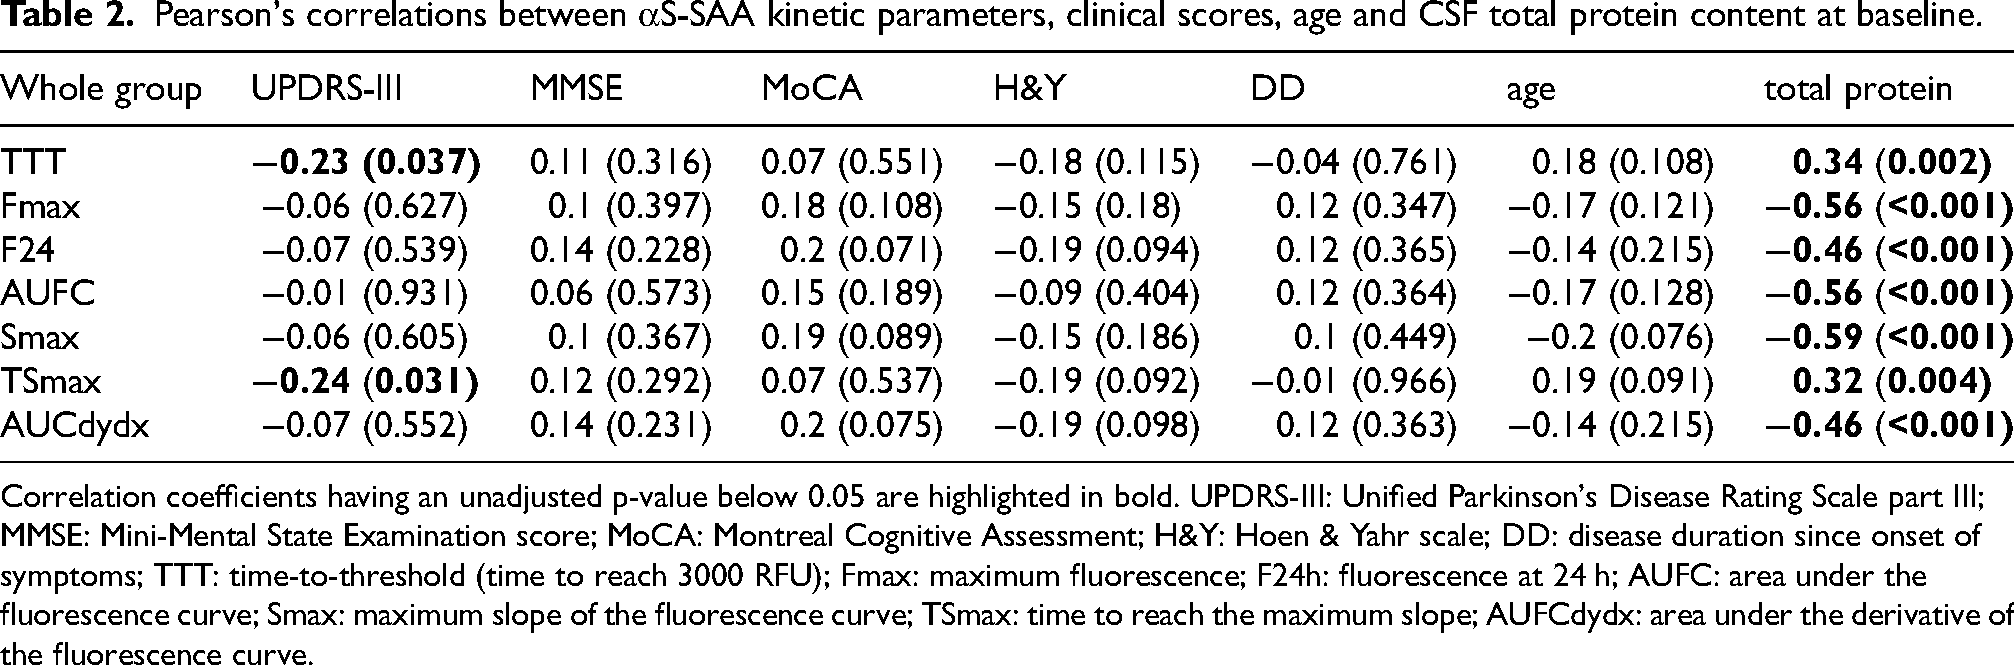
Correlation coefficients having an unadjusted p-value below 0.05 are highlighted in bold. UPDRS-III: Unified Parkinson's Disease Rating Scale part III; MMSE: Mini-Mental State Examination score; MoCA: Montreal Cognitive Assessment; H&Y: Hoen & Yahr scale; DD: disease duration since onset of symptoms; TTT: time-to-threshold (time to reach 3000 RFU); Fmax: maximum fluorescence; F24h: fluorescence at 24 h; AUFC: area under the fluorescence curve; Smax: maximum slope of the fluorescence curve; TSmax: time to reach the maximum slope; AUFCdydx: area under the derivative of the fluorescence curve.
Association between αs-SAA kinetics and cognitive measures
At baseline, MMSE and MoCA scores were not significantly correlated with αS-SAA kinetic parameters (Table 2). With respect to follow-up cognitive measures (available for n = 28 PD-CN and n = 31 PD-MCI patients), PD-CN patients had a relatively unaltered ΔMMSE (0.0 ± 2.2) and ΔMoCA (−0.3 ± 4.7) at 2-year follow-up. In this group, by applying linear mixed models at the two visits considered, none of the kinetic parameters was associated to MMSE or MoCA. PD-MCI patients showed more marked MMSE changes at 2-year follow-up (−0.7 ± 3.3) and ΔMoCA (−1.3 ± 3.7). In PD-MCI, by applying linear mixed models, TTT was found to be significantly associated with MMSE change (Figure 1(a)). Identical results were obtained for TSmax. With respect to MoCA, just a trend was identified with results not reaching statistical significance (p = 0.17). The association between MMSE change and TTT/TSmax was found to be statistically significant also by applying Pearson's correlation analysis (r = 0.54, p = 0.003 for TTT shown in Figure 1(b), r = 0.53, p = 0.004 for TSmax, p adj. = 0.012 for both). The associations were stronger when accounting for CSF total protein concentration (TTT: r = 0.59, p = 0.0016, p adj. = 0.006 shown in Figure 1(c), TSmax: r = 0.58, p = 0.002, p adj. = 0.006).
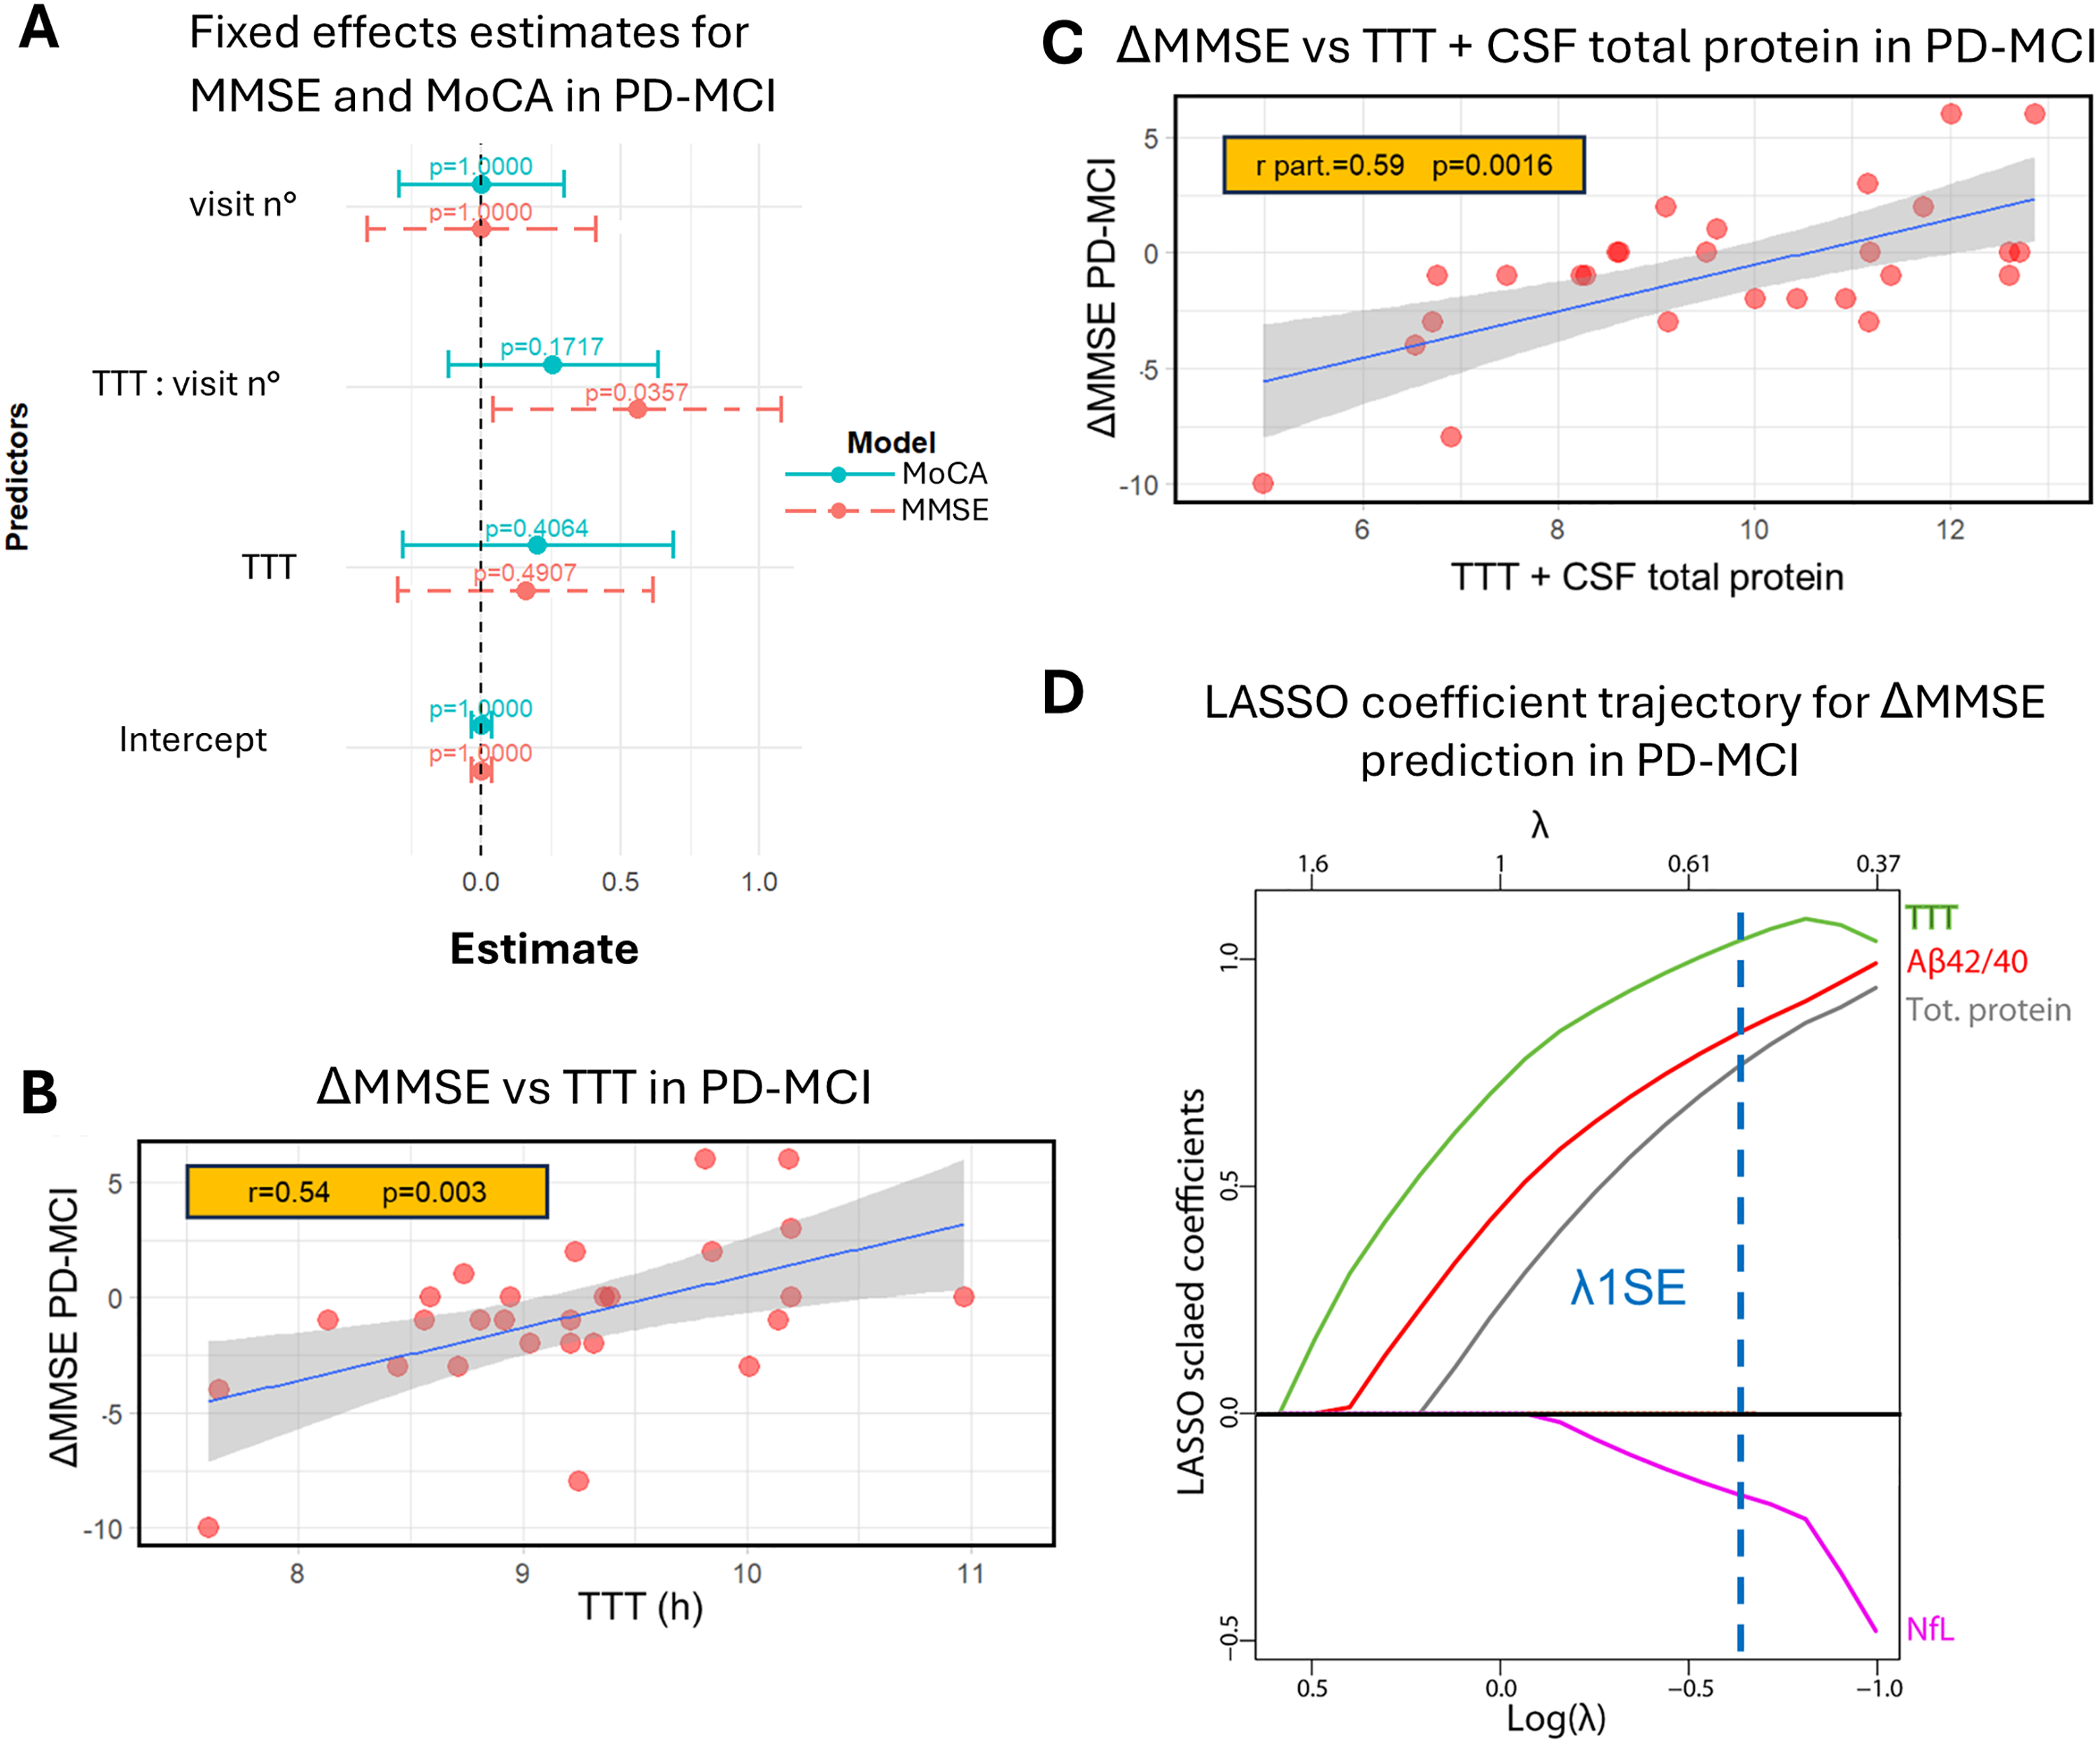
Association between cognitive decline and different CSF measures in PD-MCI. (a) Estimated fixed effects from the linear mixed models (LMM) for MMSE and MoCA at baseline and 2-year follow-up in PD-MCI. Points represent the effect estimates, with error bars indicating 95% confidence intervals. P-values related to effects between TTT and MMSE/MoCA change at 2-year follow-up are shown. A dashed line at zero indicates the threshold for non-significant effects. (b) Linear regression for ΔMMSE vs. TTT and Pearson's correlation coefficient (r) for n = 27 PD-MCI subjects. (c) Linear regression for ΔMMSE vs. a linear combination of TTT and CSF total protein concentration and partial Pearson's correlation coefficient (r part.) for n = 27 PD-MCI subjects. In both plots, the 95% CI of the linear regression is also displayed. (d) Plot of scaled coefficients (z-scored) of the Gaussian LASSO model predicting 2-year ΔMMSE in PD-MCI at varying penalization parameter λ. A dashed line corresponding to the value of λ at 1 standard error from the optimal one (λ1SE) is displayed. Unscaled (raw) coefficients of the LASSO model at λ = λ1SE are also shown.
We then analyzed all the CSF measures available in PD-MCI patients (αS-SAA kinetic parameters, total protein concentration, sAPPα, sAPPβ, Aβ42/40, t-tau, p-tau181, NfL, p-NfH, total α-syn, Ng, sTREM2, YKL-40) by means of a Gaussian LASSO regression analysis, to rank the contributions of these baseline parameters towards cognitive decline, assessed by means of MMSE score change after 2 years. The trajectories of LASSO scaled coefficients are shown in Figure 1(d). TTT was the first variable showing a non-zero coefficient at decreasing penalization, and thus the one most strongly associated with MMSE worsening in PD-MCI. TTT was then complemented by Aβ42/40, total CSF protein concentration, and NfL.
Discussion
In our study, two CSF αS-SAA kinetic parameters, TTT and TSmax, reflecting the speed of αS-SAA amplification reaction, were found weakly associated with baseline motor outcome in the whole group and moderately associated with cognitive decline in the PD-MCI subgroup. These results are in agreement with the recent literature showing the relationship between a faster αS-SAA reaction and cognitive decline in PD. 14
After considering CSF total protein concentration as a covariate, the association between clinical scores and CSF αS-SAA kinetic parameters was more pronounced. The explanation could be that higher CSF protein content, partially reflecting a higher CSF lipoprotein content, produced slower α-synuclein aggregation, as previously found. 5 However, the result of the assay—positive vs. negative—was not influenced by CSF total protein concentration.
To further explore the association between cognitive decline and CSF profile in PD-MCI, we applied LASSO regression to rank the contribution of αS-SAA kinetic parameters and previously measured CSF biomarkers 6 in predicting MMSE change at 2-year follow-up. Among all the parameters considered, αS-SAA TTT was the variable most strongly associated with MMSE change. The variables that best complemented it were CSF Aβ42/40, CSF total protein concentration and, to a lesser extent, CSF NfL (Figure 1(d)).
These findings are of interest, since PD-MCI patients may show variable clinical trends, including cognitive stability or improvement. Our findings suggest a potential link between the severity of synucleinopathy, as reflected by CSF αS-SAA TTT and TSmax, and the progression of cognitive impairment. It is well known that α-synuclein seeds are invariably found in CSF of patients with cortical Lewy body pathology.15,16 Moreover, cases with amygdala and brainstem predominant pathology are more likely to present α-synuclein seeds in CSF when sparse Lewy body disease is also found in cortical areas, suggesting that the extent and location of synucleinopathy may be associated to CSF levels of α-synuclein seeds. 17 Thus, it is possible that CSF αS-SAA seeding kinetics reflects the burden of synucleinopathy in the cortex, thus predicting worse cognitive outcome.
Indeed, while the results obtained for MMSE are pretty robust, the association between MoCA changes at follow-up and TTT was not statistically confirmed. The reason for this discrepancy remains unclear. One possibility is the relatively small sample size of the PD-MCI group with available follow-up data. However, in two previous studies demonstrating a link between αS-SAA kinetics and cognitive impairment, seeding kinetics correlated with MoCA, but in both cases, MMSE scores were converted into MoCA equivalents.14,18 Furthermore, neuroimaging and neuropathological studies have consistently shown that MMSE is associated with cortical pathology in PD, including cortical thinning, amyloid plaques, and tau tangles. 19 While findings in the literature are not entirely consistent,20,21 there is evidence that MoCA is more sensitive in detecting cognitive impairment at baseline in PD, whereas MMSE may be better suited for tracking cognitive decline over time.22–24
Our study has some limitations that should be acknowledged. The follow-up period was relatively short and available for only a limited number of PD-CN and PD-MCI patients, with no follow-up data for the PDD group. These constraints highlight the need for replication of our findings in larger, well-characterized longitudinal cohorts. However, our cohort was comprehensively characterized both clinically and in terms of biomarkers, strengthening the reliability of our findings.
Overall, our findings show that CSF αS-SAA kinetic parameters are potential predictors of cognitive decline in PD-MCI. The prognostic performance of CSF αS-SAA kinetic parameters can be further improved after accounting for CSF total protein content.
Footnotes
ORCID iDs
Ethical considerations
All the procedures involving human subjects were performed following the Declaration of Helsinki. The study was approved by the local Ethics Committees (Comitato Etico Aziende Sanitarie Regione Umbria 19369/AV and 20942/21/OV).
Consent to participate
All participants gave written informed consent to use medical data and biomaterials for research purposes.
Funding
The author(s) disclosed receipt of the following financial support for the research, authorship, and/or publication of this article: GB was supported by the Postdoctoral Fellowship for Basic Scientists grant of the Parkinson's Foundation (Award ID: PF-PRF-934916). LCM is funded by the Michael J Fox Foundation (MJFF-021233). LP and LG are funded by the European Union—Next Generation EU – PNRR M6C2 - Investimento 2.1 Valorizzazione e potenziamento della ricerca biomedica del SSN (PNRR-MAD-2022-12376035).
Declaration of conflicting interests
The author(s) declared the following potential conflicts of interest with respect to the research, authorship, and/or publication of this article: Prof. Parnetti served as an Advisory Board Member for Fujirebio, IBL, Roche, and Merck. Dr. Concha, Ms. Farris, and Mr. Ma are inventors of several patents related to SAA technology and are associated with Amprion Inc., a biotech company focused on the commercial utilization of SAA for diagnosis. The remaining authors declared no potential conflicts of interest with respect to the research, authorship, and/or publication of this article.
Data availability statement
All the relevant biomarker data generated or analyzed during this study are available to the corresponding authors upon reasonable request.