
Abstract
Background
Circular RNAs (circRNAs) constitute a distinctive subclass of RNAs that are known for their regulatory roles in fundamental cellular processes. Due to their increased stability and ubiquitous expression, circular RNAs have been widely studied as potential molecular targets in various diseases, including neurodegenerative diseases. While several studies have found differentially expressed circRNAs associated with Parkinson's disease (PD), none has looked specifically into PD progression.
Objective
To elucidate the role of circRNAs in the progression of PD by identifying dysregulated circRNAs associated with PD progression and to pinpoint potential downstream miRNAs and associated differentially expressed gene targets.
Methods
In this study, we have utilized large-scale, longitudinal, and deep RNA-seq data from two independent cohorts, namely the Parkinson's Progression Marker Initiative (PPMI) and the Parkinson's Disease Biomarker Program (PDBP), to characterize circRNA expression in patients of early PD stage.
Results
We identified six circRNAs significantly differentially expressed in whole blood samples obtained from PD patients over time. Additionally, we were able to map a competing endogenous RNA (ceRNA) network with potential downstream miRNA-mRNA targets and, with the help of co-expression analysis, to identify genes associated with PD progression. Our findings provide compelling evidence for a dysregulated circRNA interactome as an indicator of PD progression, with changes in the expression of these circRNAs and downstream gene targets being significantly associated with changes in UPDRS III scores in PD patients.
Conclusions
Our results strongly indicate the association of circular RNAs with PD progression and emphasize its significance as a critical molecular marker.
Plain language summary
Circular RNAs (circRNAs) are stable RNA molecules, some of which have been linked to cellular processes involved in neurodegenerative diseases. Their role in Parkinson's disease (PD) progression has not been well explored. In this study, we analyzed blood samples from 168 people with early-stage PD and 76 healthy individuals using RNA sequencing data from two large research programs, PPMI and PDBP. We identified six circRNAs that were significantly dysregulated over time in early-stage PD patients from both cohorts. Furthermore, changes in expression levels of these circRNAs could help predict disease progression based on UPDRS III (On) scores with reasonable accuracy (AUC of 0.693 [0.594–0.792]). We also explored how these circRNAs might influence gene regulation through microRNA (miRNA) sponging, identifying a circRNA-miRNA-mRNA network linked to PD-associated pathways. Our findings suggest that these circRNAs could serve as potential biomarkers for tracking PD progression and provide insights into its molecular mechanisms.
Keywords
Introduction
Parkinson's disease (PD) is a progressive neurodegenerative disease clinically characterized by the lateral manifestation of severe motor symptoms (bradykinesia, resting tremors, postural instability, or muscular rigidity) with non-motor complications, ranging from autonomic dysfunctions to sleep disorders, usually preceding the motor deficits.1,2 PD cases are primarily sporadic, with familial cases only making up approximately 5–10%. 3 The neuropathological hallmark of PD is the progressive deposition of misfolded a-synuclein aggregates known as Lewy bodies (LBs) in the brain, along with the loss of dopaminergic neurons in the substantia nigra pars compacta (SNpc).4–6 The period between the initial pathology in the brain with some pre-motor symptoms and the onset of motor symptoms may span multiple years. 7 Moreover, it has been estimated that the onset of motor symptoms occurs with a loss of at least 30% of total dopaminergic neurons in the SN. 8 Approximately 90,000 people over the age of 65 are diagnosed annually, and with no cure identified, the annual economic burden of PD care is estimated at $52 billion in the U.S.9–11
Currently, PD treatments primarily focus on symptom management, and although some promising candidates are being investigated, no disease-modifying drugs or treatments are available.9,12 The heterogeneity in symptom manifestation and disease progression among PD patients is a significant obstacle in successfully implementing effective disease-modifying therapies from pre-clinical models to clinical trials.13,14 Stratification of PD patients using a combination of various motor and non-motor symptoms has been proposed to elucidate the clinical characteristics dictating progression in PD.15,16 However, exploring and identifying effective molecular signatures associated with the early stages of PD progression is vital to track the effect of potential therapeutic approaches. Additionally, concordance between the transcriptomic profiles in the brain and peripheral blood in PD patients has recently been reported, highlighting the significance of studying potential reliable molecular markers for PD in the blood. 17
Circular RNAs (circRNAs) have been identified in several eukaryotes, with many being conserved across species.18,19 In addition to being tissue- and developmental-stage-specific, circRNAs are abundantly expressed in the brain, especially the synaptic region.18,20,21 Moreover, the lack of free ends makes them more resistant to exonuclease degradation than their linear counterparts. 21 This increased resistance to degradation has also been attributed to the accumulation of circRNAs in neural tissues in an age-dependent manner.22–24 Their neural specificity and enhanced stability make circRNAs an interesting molecular target in the context of several neurodegenerative diseases, including PD.25,26
Although often expressed in lower levels than their respective host genes, circRNAs possess binding sites for microRNAs (miRNAs) and RNA binding proteins (RBPs), making them key regulators in several biological processes.21,27,28 CircRNAs have been implicated in several mechanisms associated with neuronal cell death in PD, including aberrant apoptosis and enhanced oxidative stress. CircZip-2, one of the highly expressed circRNAs in C. elegans, serves a protective role against PD by modulating the expression of miR-60. Silencing of its transcription competitor, Zip-2 mRNA, reduced a-synuclein aggregation in the C. elegans PD model and decreased reactive oxygen species (ROS) production levels in the wild-type. 29 Another study in 1-methyl-4-phenyl-1,2,3,6-tetrahydropyridine (MPTP) induced PD mouse models reported the downregulation of circDLGAP4, whose knockdown in vitro increased apoptosis and mitochondrial dysfunction. 30 In post-mortem brain samples from PD patients, circSLC8A1 was upregulated in the SN region. This elevated expression was also observed in neuronal cells treated with the oxidative stress-inducing neurotoxin Paraquat, indicating an association of increased circSLC8A1 levels with higher oxidative stress. 31 Such growing evidence suggests underlying regulatory roles of multiple circRNAs in the pathogenesis and, most likely, in the progression of PD.
Only a few studies have analyzed the expression profiles of circRNAs unique to PD pathogenesis, with most studies being limited in sample size and the number of circRNA candidates being studied.31–34 Ravanidis et al. utilized RT-PCR to study 87 selected circRNAs in peripheral mononuclear blood cells (PBMCs) from 60 idiopathic PD patients. 33 Kong et al. explored circRNA profiles in peripheral blood samples from 4 PD patients using RNA-seq. 32 Separately, Zhong et al. utilized microarray detection to identify circRNA candidates associated with different disease stages using plasma samples from PD patients. 34 Finally, using transcriptomics data from whole blood samples collected from two large-scale cohorts, Whittle et al. identified three differentially expressed circRNAs in early idiopathic PD patients. 35 The identification of several circRNAs uniquely dysregulated in blood samples from PD patients, which are linked to the regulation of key PD hallmarks, strengthens the potential of circRNAs as molecular markers for PD progression. However, circRNAs linked to PD progression have yet to be explored using longitudinal data. Here, we present an analysis of circRNA expression profiles obtained from peripheral blood samples of participants from the Parkinson's Progression Marker Initiative (PPMI) cohort, a large-scale longitudinal study with PD patients and non-PD controls. The PPMI cohort includes data from samples collected from early-stage PD patients over several years. In addition, for comparative purposes, we also analyzed RNA-seq data obtained from peripheral blood samples from the Parkinson's Disease Biomarker Program (PDBP) cohort. While this cohort is distinctly different from the PPMI cohort and any interpretation of results must be cognizant of this difference (see discussion below), no other deep circRNA sequencing longitudinal data from early-stage PD patients is currently available. Unlike previous studies and analyses of the PPMI data, we are specifically looking into PD progression.
From both cohorts, we identified several novel circRNAs associated with disease progression. Subsequently, we unraveled the circRNA interactome, a network of interactions between these circRNAs, their associated miRNA targets, and downstream genes. The changes in the expression of dysregulated circRNAs can also predict a progressed PD state as defined by the UPDRS III (On) scores. By comparing known PD pathways and the existing literature on circRNAs in PD, we place our findings in the larger context of transcriptomics dysregulation in PD and present substantial evidence supporting the regulatory role of circRNAs in PD progression.
Methods
Datasets and sample selection
We used total RNA sequencing data obtained from whole blood samples of participants enrolled in the longitudinal Parkinson's studies PPMI (https://www.ppmi-info.org/) and PDBP (https://pdbp.ninds.nih.gov/). Both PPMI and PDBP studies abided by the Declaration of Helsinki and Good Clinical Practice guidelines after approval from the local ethics committee at the participant recruitment site. We utilized the data from the PDBP study as an independent cohort to support our observations from the PPMI study. We also obtained the corresponding small RNA sequencing data for the samples in the PPMI cohort. Since our objective focuses on exploring circRNAs that are associated with the progression of PD at early stages and analyzing their expression, samples from PD participants at early Hoehn Yahr (HY) stages at the time of enrollment were selected (PPMI: n = 357, PDBP: n = 146). Additionally, samples from age and sex-matched healthy control participants (HC) were also included in our dataset for both cohorts (PPMI: n = 144, PDBP: n = 68) (Supplemental Table 1). For the PPMI study, we utilized the raw fastq files for samples from selected participants at three different time points, namely Baseline, Year 2, and Year 3 (n = 495), whereas, in the case of our secondary cohort, the data from Baseline and Year 2 were used (n = 210). We note that for the PDPB cohort, no sequencing data for Year 3 or later is available. Also, it is critical to remember that PD does not progress linearly and that the Baseline for patients in PPMI and PDBP differ despite identical HY scores. Specifically, PDBP patients were in a more advanced PD state at the time of Baseline sampling.
Quality assessment and pre-processing workflow
The pre-processing quality assessments and the adapter trimming of the raw fastq files were performed using FASTQC 36 and Trimmomatic. 37 Trimmed reads were aligned to the GRCh37 (hg19) human reference genome using STAR (v.2.7.2d). 38 Samples with reference genome mapping rates of <70% were excluded (n = 27) from the downstream analyses (Supplemental Table 2). A custom workflow was developed using Snakemake (v.6.0.5) to automate the pre-processing steps. This workflow incorporated the CIRIquant (v.1.1.2) workflow proposed by Zhang et al. 39 to identify and quantify circRNAs. CIRI2 40 was selected as the tool of choice for circRNA identification. Gene counts were also computed as part of the CIRIquant workflow utilizing StringTie (v.2.1.7). The human reference genome GRCh37 with annotations from GENCODE 19 was provided to the CIRIquant pipeline. For the small RNA sequencing data pre-processing, the smRNA-seq pipeline from nf-core was used. 41
Sample level quality control and outlier detection
Dimensionality reduction was performed using principal component analysis (PCA) on the top 500 most variable circRNAs and, independently, the top 500 most variable genes to verify if clinical factors like race, family history of PD, sex, site of sample collection, or Hoehn Yahr stage are contributing to the variation within the samples at a global level. To this end, circRNA and gene reads were first filtered by requiring a minimum of 2 and 10 reads, respectively, in 30% of the total samples in each cohort (Supplemental Data and Supplemental Figures 1–3).42,43 Subsequently, circRNAs and genes were transformed independently using the Variance Stabilizing Transformation (VST) function of the DESeq2 (v.1.38.3) package. PCA was performed by applying the prcomp function from the stats (v.4.2.2) package to the filtered, VST-transformed circRNA read counts. Samples were also tested for outliers using Rosner's Test function from the EnvStats package (v.2.8.1) applied to Principal Component 1. The PCA results were visualized using the plotPCA function from the DESeq2 package. The samples identified as outliers by Rosner's Test (PPMI: n = 0; PDBP: n = 2) were excluded from downstream analysis (Supplemental Figure 4).
Characterization of identified circRNAs
To maintain consistency among the dataset, we further excluded samples of PPMI participants with known PD-risk-associated genetic mutations (LRRK2+/GBA+/SNCA+) or with missing data (PPMI: n = 27) from the downstream analysis (Table 1). The same filtering criteria mentioned above were applied to obtain our final list of circRNAs for each cohort. Using their coordinate IDs previously obtained from CIRIquant, these circRNAs were annotated using circPrimer2.0, 44 allowing us to retrieve information about the circRNAs’ host genes, circBase IDs, strands, and more. We used CircBase 45 to obtain additional information about circRNAs, such as spliced length and circRNA subtype.
Demographics of participants. The clinical metadata of the samples selected from the participants included in the final dataset.
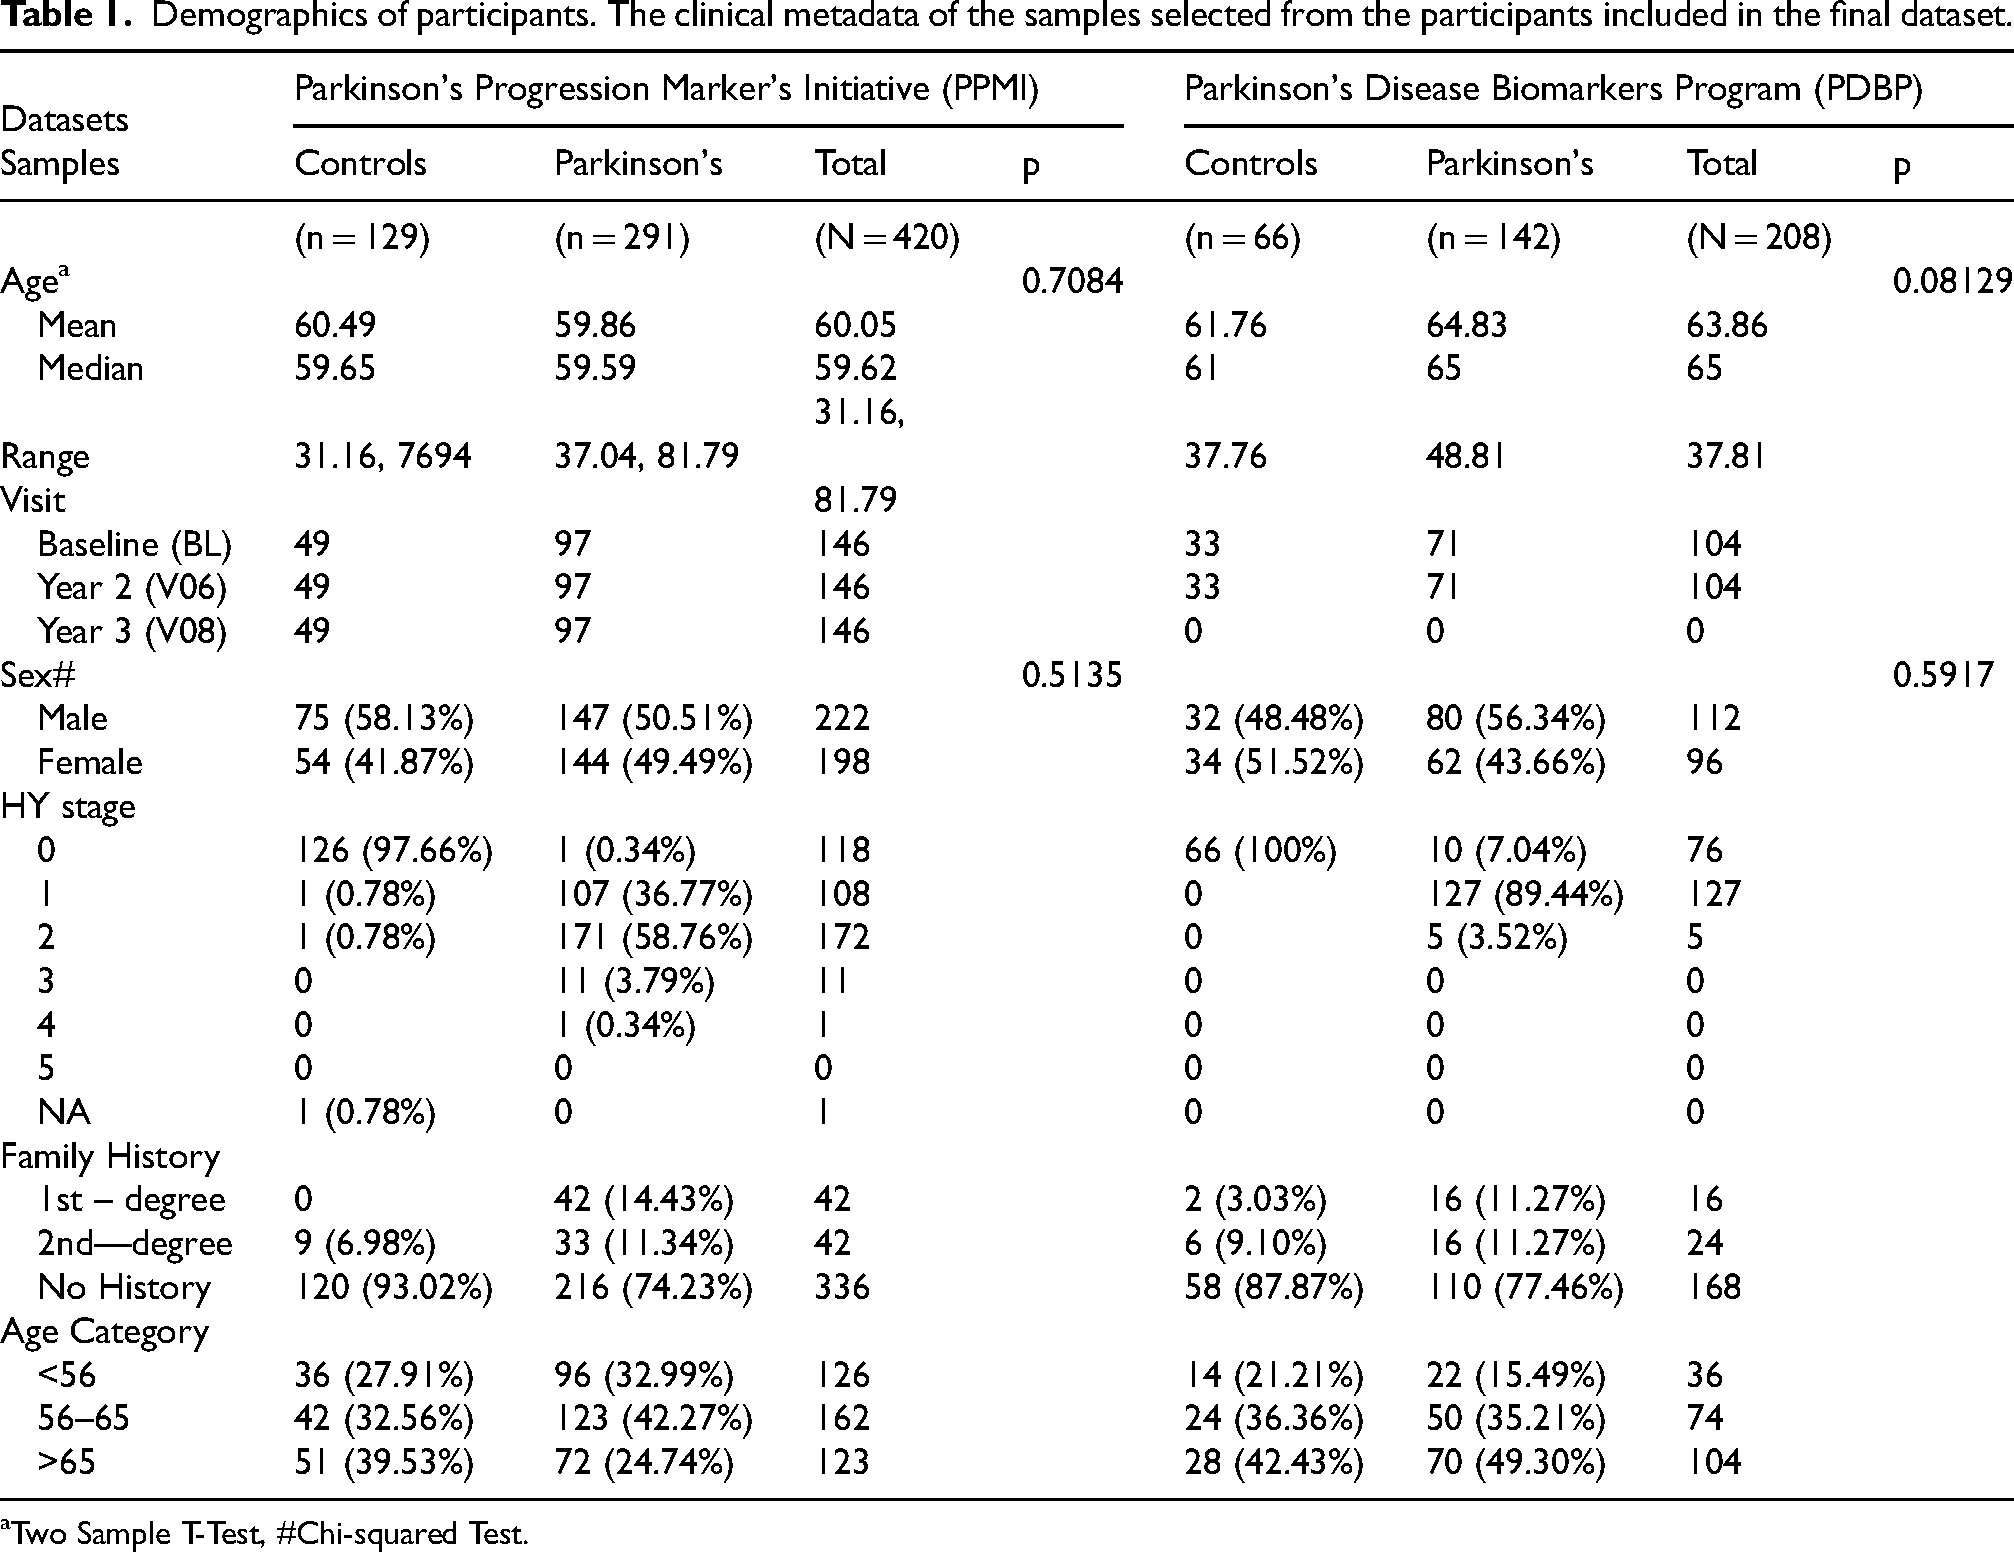
Two Sample T-Test, #Chi-squared Test.
Differential expression analysis
For differential expression analysis, paired analysis was performed for the samples in each of two groups – PD patients (PPMI: n = 291, PDBP: n = 142) and controls (PPMI: n = 129, PDBP: n = 66) – at three different time points (Baseline, Year 2, and Year 3) for the PPMI cohort and two different time points (Baseline and Year 2) for the PDBP cohort. To this end, the participant number was included in the design formula. Because adding many covariates in the design formula can complicate the DE analysis and misrepresent results due to over-fitting, we accounted only for the disease group, time point in the study, and the participant ID in the circRNA expression analysis design matrix.
For gene expression analysis, the participants’ sex was also included in the design formula. Differential expression analysis was performed using EdgeR (R package v.3.40.2). 46 Both circRNA and gene read counts were pre-filtered using the filterByExpr function in the EdgeR package. The libraries were normalized using Trimmed Means of M-value (TMM) normalization. 47 EdgeR's QLF Test function detected the differentially expressed circRNAs and genes while using the Benjamini-Hochberg (BH) method to correct for multiple testing. CircRNAs and genes with FDR < 0.05 and |logFC| > 0.25 were considered differentially expressed. Post-hoc power analysis was performed to select the cutoff for the logFC such that we achieved an estimated power of 80% for detecting differences in the mean values (Supplemental Figure 5). The mature miRNA counts obtained from the nf-core pipeline were also normalized using TMM normalization.
circRNA-miRNA-mRNA network construction
The circRNA-sponging pipeline developed by Hoffman et al. was modified and implemented for the downstream analysis. 48 First, miRanda 49 and TarPmiR 50 were utilized to identify target miRNAs with binding sites in dysregulated circRNAs. Furthermore, to ensure the selection of high-confidence miRNAs, the predicted miRNA targets were ranked based on their scores, and the targets in the lower 25% quantile were filtered out. Additionally, only miRNA targets detected in the corresponding small RNA seq data in the PPMI cohort (obtained from the same sample) were selected for downstream analysis. Spearman's rank correlational analysis was performed on the normalized read counts to detect significantly and negatively correlated circRNA-miRNA pairs, as negative correlation indicates a sponging effect. 48 miRTarBase 51 database and TargetScan 52 were utilized to identify the sponging miRNAs’ downstream mRNA targets. SPONGE 53 was then utilized to identify the significant ceRNA interactions.
To identify the genes among the significant ceRNA interactions relevant to PD progression, Weighted Gene Correlational Network Analysis (WGCNA) (v.1.72.1) 54 was performed on the top 25% of genes with the highest variance in PD samples. Although the WGCNA method does not require pre-filtering as it utilizes unsupervised clustering to identify gene modules, selecting genes with the highest variance in expression has previously helped to filter out the lowly expressed genes and reduce computational load during network construction.54,55 While choosing only those differentially expressed genes for WGCNA might appear sufficient and suitable, it is not recommended. 54 Before the WGCNA, gene counts were normalized using the Variance Stabilizing Transformation function from the DESeq2 package. Signed network construction was selected, and Pearson's correlation was utilized to detect the relationship between the gene modules and several clinical traits (HY Stage at ON/OFF states, Montreal Cognitive Assessment (MoCA) Scores, Unified Parkinson's Diseases Rating Scale (UPDRS) Scores: Part I, II, III at ON/OFF states, Total scores at ON/OFF states). After identifying key gene modules, genes with module membership (MM) > 0.8 and gene significance (GS) < −0.15 were selected as potential hub genes. We then intersected the list of hub genes with differentially expressed genes in PD participants at Year 2 and the genes identified in the significant ceRNA network. Gene Ontology (GO) and KEGG overrepresentation analysis was performed using the enrichGO function from the clusterProfiler (v.4.10.1) 56 package in R. The list of selected genes used for network construction in WGCNA was chosen as background genes for the gene enrichment analysis (a.k.a. ‘gene universe’). The p-value and q-value cutoffs were set to 0.05, and the Benjamini-Hochberg method was used for multiple testing. Networks were constructed using CytoScape (v.3.9.1). 57
To explore the clinical relevance of the mapped circRNAs identified, we assessed the association of the change in the expression of the RNAs in the network to the change in the UPDRS III scores between the first two years in the PPMI study. For each of the 97 PD participants, the change in circRNA expression was calculated by subtracting the TMM normalized counts of the Baseline samples from those of Year 2 samples. A change in the UPDRS III score of 4.63 or higher has been a minimal but clinically relevant indicator of worsening PD. 58 Accordingly, based on the change in UPDRS III (OFF and ON) scores, PD participants were assigned a new progression variable, where a score change >4.63 was considered progression. Filtering out participants with missing clinical data, two groups of PD participants’ data were used for modeling: 65 participants with complete UPDRS III OFF scores and 91 participants with complete UPDRS III ON scores. To evaluate the predictability of PD progression, a regularized multivariate logistic regression model with 10-fold inner and 10-fold outer cross-validation was performed using nestedcv (v. 0.7.8) and glmnet (v.4.1.8). 35 To avoid class imbalance effects in the modeling, randomsample function from nestedcv package was used for oversampling the minority class.
Statistical analyses
Statistical tests were performed using R. The ggplot2 package (v.3.4.4) in RStudio was utilized for data visualization. Independent T-test and chi-square tests were performed to compare the mean differences between PD and control participants in each cohort. For a Wilcoxon rank sum test we used the stat_compare_mean function from the ggpubr (v.0.6.0) package to compare means between groups. Differential Expression Analysis, Weighted Gene Correlation Network Analysis, and Gene Enrichment Analysis were performed in R using EdgeR (v.3.40.2), WGCNA (v.1.72.1), and clusterProfiler (v.4.10.1), SPONGE (1.24.0) packages.
Results and discussion
Characteristics of circRNAs identified in samples from participants at early stages of PD
To identify the circRNAs in the blood samples from selected PD and control participants following quality control, we employed the CIRIquant circRNA quantification workflow with CIRI2 as the chosen tool for circRNA identification. We additionally applied robust filtering to exclude circRNA candidates with low reads (<2 reads in over 30% of the total samples). 4685 circRNAs were identified in 468 whole blood samples collected from 156 PPMI participants at three different time points during the study (Supplemental Table 3.1–3.2). Of those, 660 were unique to control participants, and 74 were unique to PD participants. In contrast, 4069 circRNAs were identified in 208 samples collected from 104 PDBP participants at two different time points during the study (Supplemental Table 3.3–3.4). Of those, 327 circRNAs were unique to samples from control participants, whereas 267 circRNAs were unique to samples from PD participants (Figure 1(a), Supplemental Figure 6). Using circPrimer 2.0 to annotate the identified circRNAs, we identified several novel/unannotated circRNAs unique to HC, PD, or both (Figure 1(b), Supplemental Table 3.5). However, the number of circRNAs unique to PD was lower than the number of circRNAs unique to controls. This observation aligns with the previous reports of a lower number of circRNAs in PD postmortem brain tissues and a global reduction of circRNAs levels in whole blood samples from PD patients compared to the controls.31,35 It has also been proposed that reduced levels of circRNAs in PD can be attributed to upregulation in viral infection-activated RNase L. 35 RNase L degrades endogenous circRNAs (with 16–26 bp RNA duplexes) and activates protein kinase R (PKR), triggering innate immune response. 59
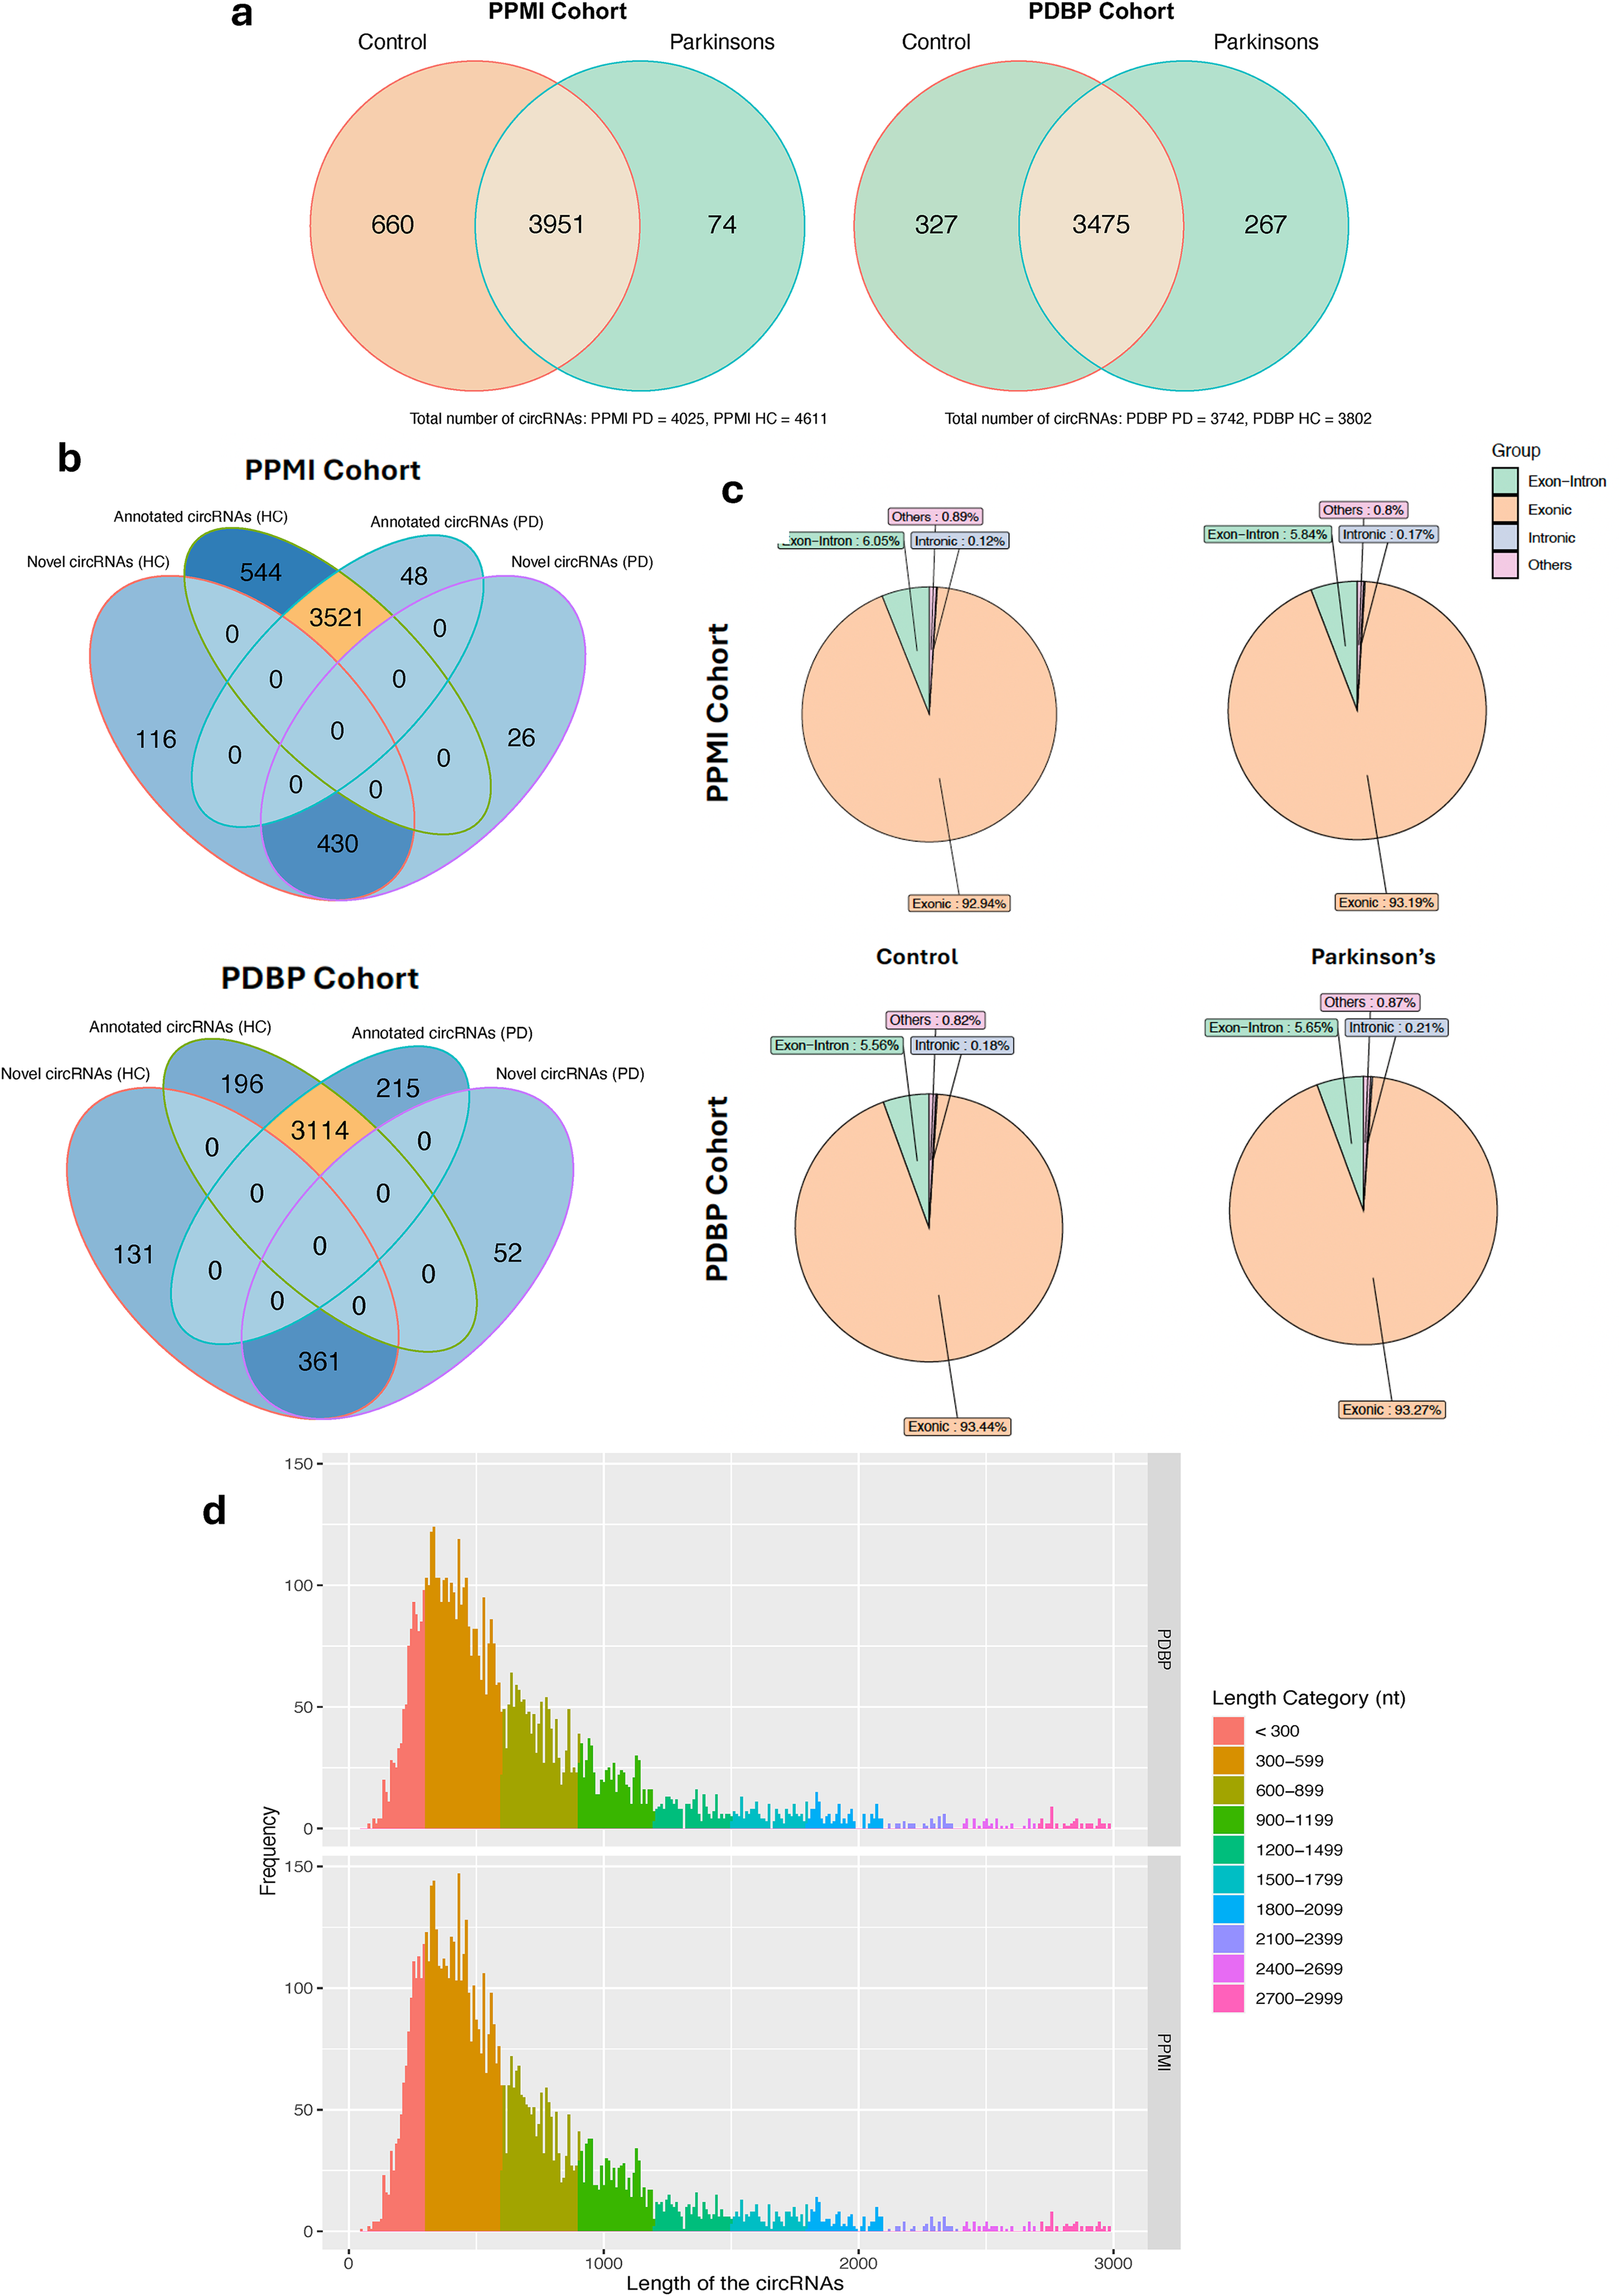
Characteristic profiles of circRNAs in the whole blood samples. (a) Venn Diagram depicting total circRNAs identified in samples obtained from Control and PD participants in the PPMI (n = 420) and PDBP (n = 208) studies. (b) Venn Diagram showing the number of annotated and novel circRNAs in control and PD samples in PPMI and PDBP studies. (c) Types of annotated circRNAs identified in control and PD samples. (d) Length distribution of annotated circRNAs (<3000nt in length identified in the PPMI and PDBP. The histograms’ bin number was set to 300.
Also, over 92% of the known circRNAs identified in samples from PPMI and PDBP datasets were exonic in both subgroups, i.e., HC and PD (Figure 1(c), Supplemental Table 3). Most annotated circRNAs identified in our analysis were between 300nt and 600nt long (Figure 1(d)). Comparing the total read counts of the circRNAs with their corresponding linear RNAs revealed that, in almost all cases, the linear RNAs were more highly expressed than the circRNAs (Supplemental Figure 6).
circRNAs are differentially expressed in Parkinson's disease participants throughout the study
By performing paired analysis of samples (n = 291) collected from PD participants in the PPMI cohort at three different time points, we identified 28 and 43 circRNAs to be differentially expressed (FDR < 0.05 and |logFC| > 0.25) at Year 2 and Year 3, respectively, when compared to Baseline (Supplemental Table 4.1–4.2). In Year 2, 23 circRNAs were found to be significantly downregulated, and 5 circRNAs were significantly upregulated (Figure 2(a)). Next, we utilized the sequencing data of a second, independent cohort (PDBP; n = 142) and identified 48 differentially expressed circRNAs (FDR < 0.05 and |logFC| > 0.25), with 29 of them being downregulated and the remaining 19 circRNAs being upregulated in PD participants at Year 2 (Figure 2(b)). Six circRNAs: circSLC8A1 (hsa_circ_0000994), circMAN1A2 (hsa_circ_0000118), circVRK1(hsa_circ_0000566), circPICALM (hsa_circ_0023936), circZNF91 (hsa_circ_0109315), and circEMB (hsa_circ_0001481) were found downregulated at Year 2 in both cohorts (Figure 2(c)). Consistency in the logFC was observed among the differentially expressed circRNAs identified in both cohorts (Figure 2(d)).
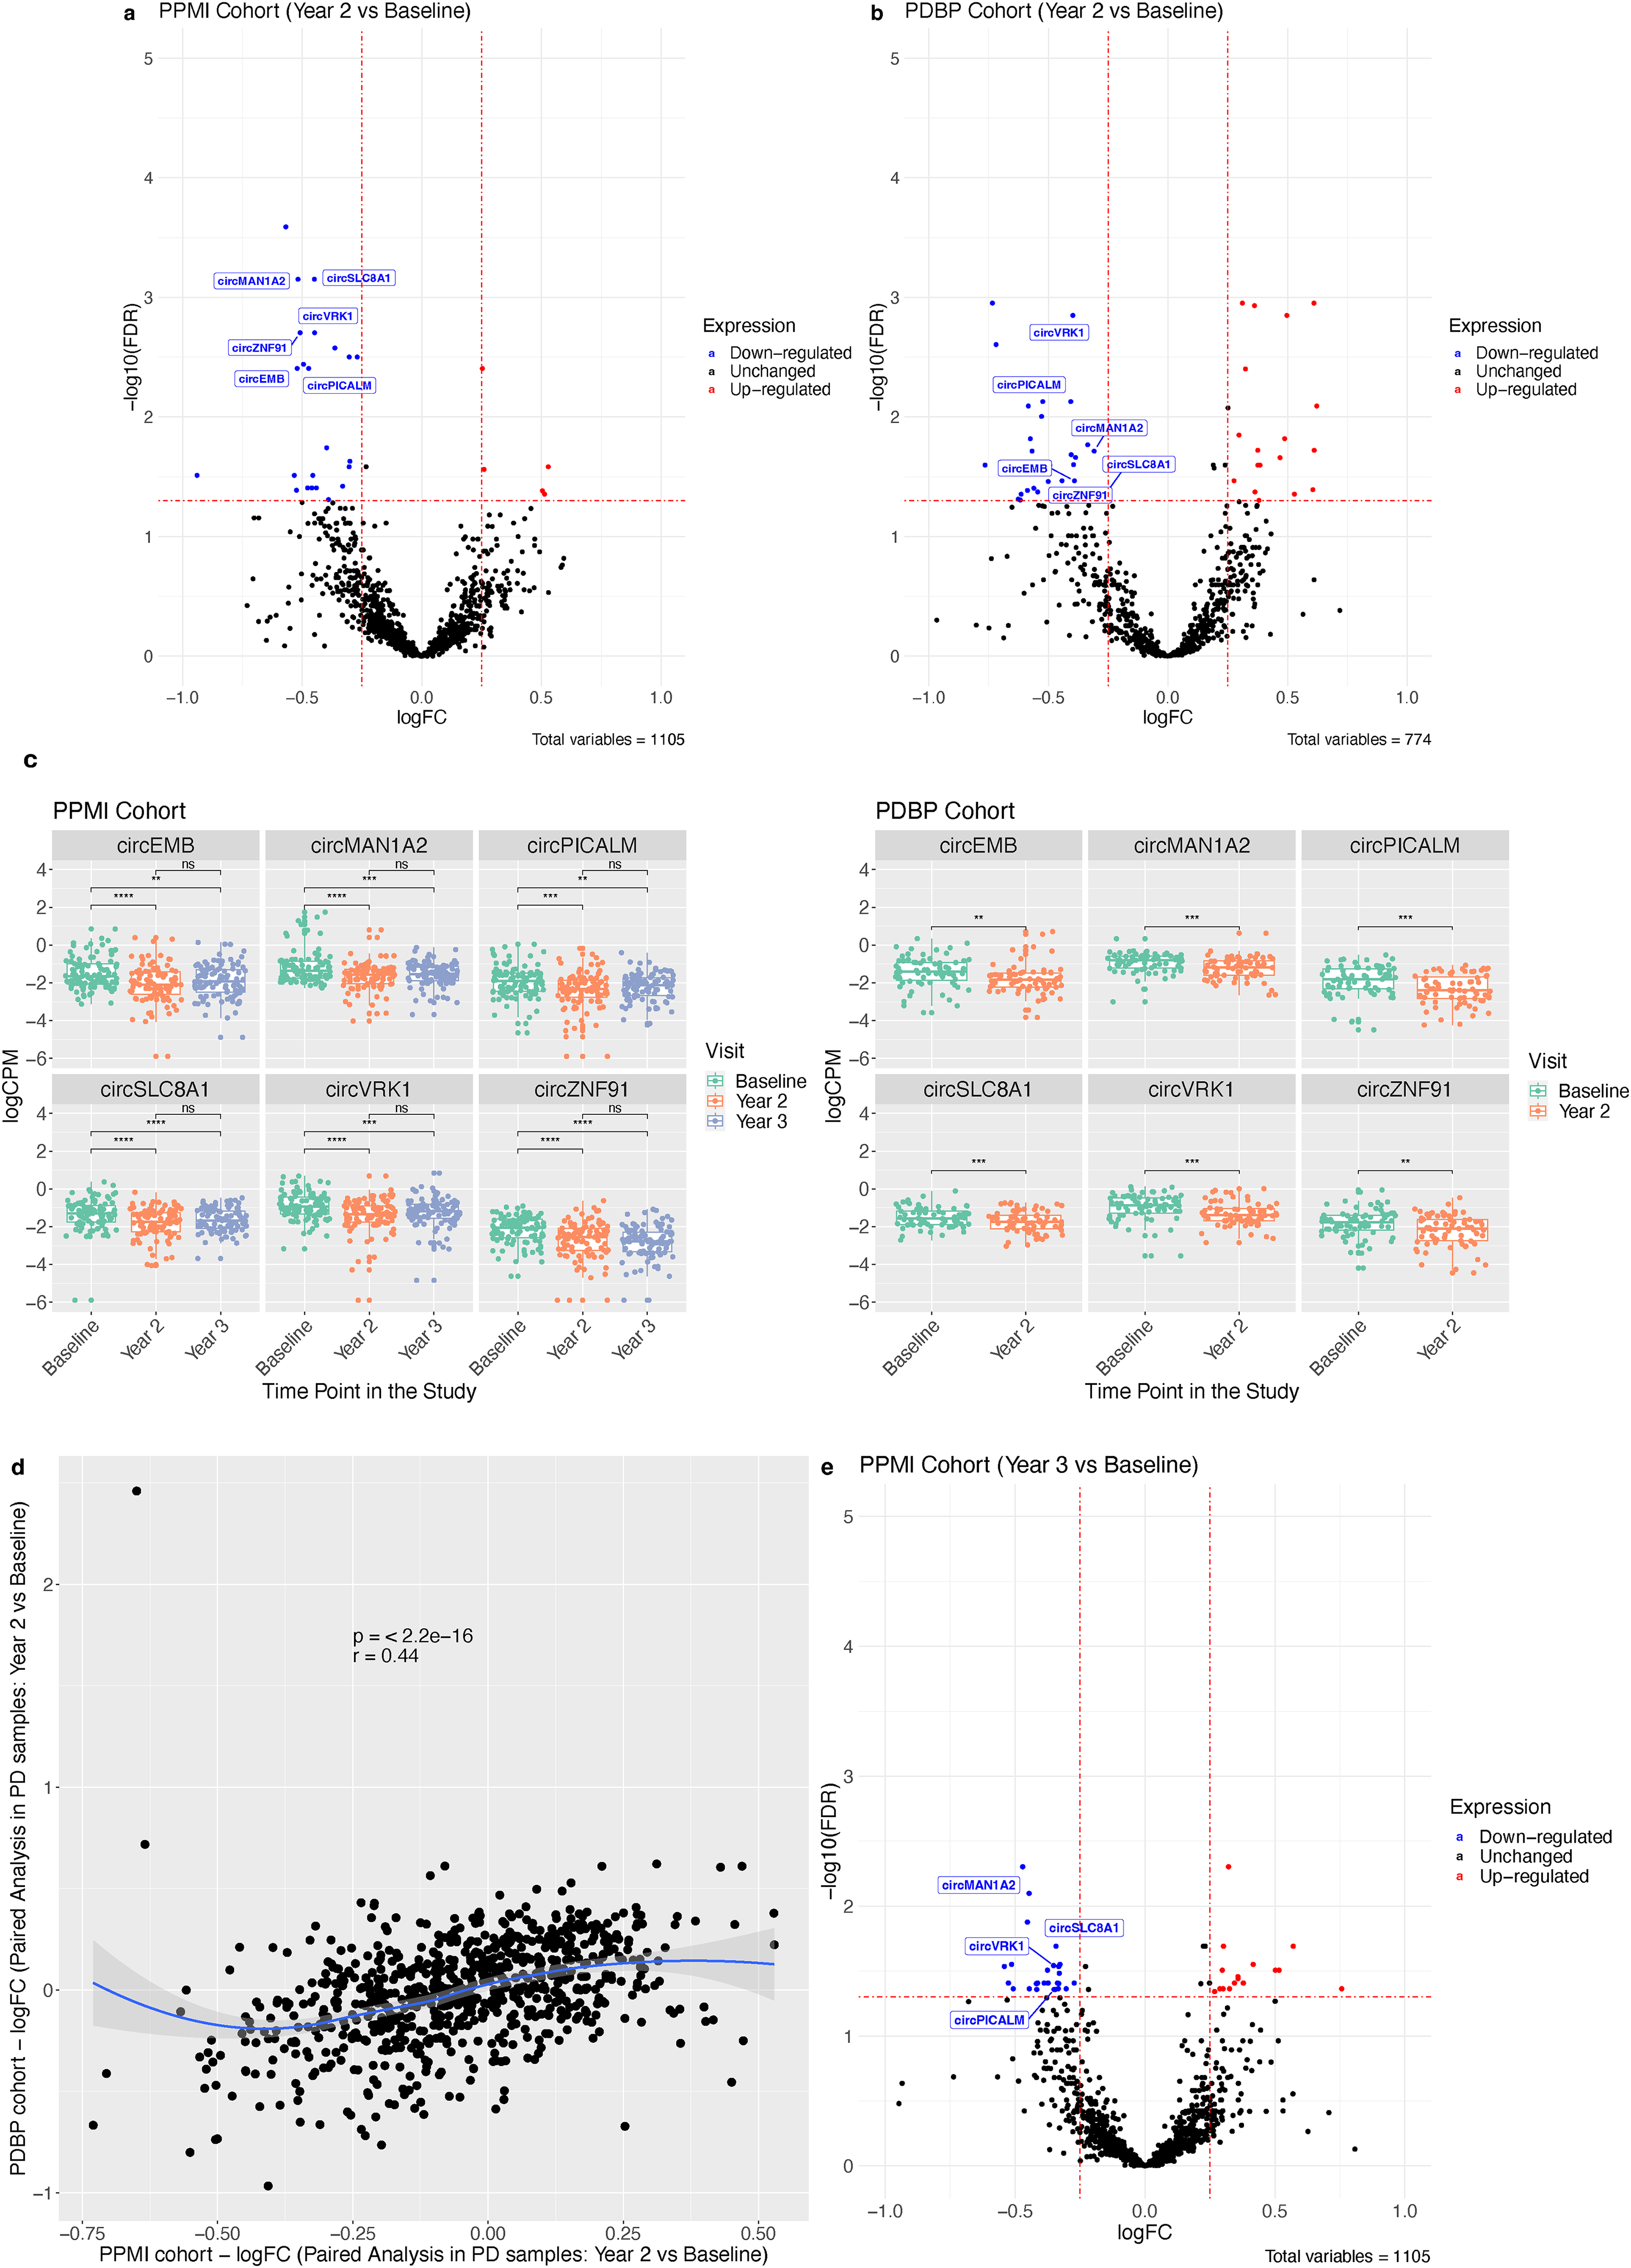
Differentially expressed circRNAs in Parkinson's disease participants. Volcano plots depicting the differentially expressed circRNAs in samples collected from PD participants at Year 2 compared to the Baseline in (a) the PPMI cohort and (b) the PDBP cohort. circRNAs with false discovery rate (FDR) < 0.05 and log Fold Change (logFC) < −0.25 are considered downregulated. circRNAs with FDR < 0.05 and logFC > 0.25 are upregulated. circRNAs with FDR > 0.05 or |logFC|<0.25 are not significant. (c) Boxplots depicting normalized logCPM circRNAs read counts of the six circRNAs identified by EdgeR to be downregulated in samples from PD participants at Year 2 in both cohorts. logCPM represents the logarithm of Count Per Million (CPM), the normalized raw circRNA read counts. Paired Wilcoxon Test was used to compare the means and test significance. (d) Scatter plot depicting the concordance among the logFC values of the circRNAs that were identified in both PPMI and PDBP cohorts. Spearman's Correlation was used for this analysis, and local polynomial regression (LOESS) was used for the smooth curve fitting with the surrounding grey shading indicating the standard error mean with 95% confidence interval. (e) Volcano plots depicting the differentially expressed circRNAs in samples collected from PD participants at Year 3 compared to Baseline in the PPMI cohort.
Additionally, in the PPMI cohort, we identified 43 significantly differentially expressed circRNAs (FDR < 0.05 and |logFC| > 0.25) at Year 3 compared to Baseline. Of those, 16 circRNAs were upregulated, and 27 were downregulated (Figure 2(e), Supplemental Table 4.3). Notably, more circRNAs were upregulated in Year 3 compared to Year 2, indicating a trend of upregulation in circRNA levels in PD samples over time. Interestingly, miRNA expression seems to follow an opposite trend, with more miRNAs being downregulated over time in PD samples from the PPMI study. 60 We also performed paired analysis on control samples at different time points but did not identify any significant dysregulation among circRNAs in Year 2 and Year 3 samples from the PPMI cohort (Supplemental Figure 7, Supplemental Table 4.4–4.5). Similar observations were made for the control samples from the PDPB cohort (Supplemental Figure 7, Supplemental Table 4.6). Since the PDPB cohort only has samples from Baseline and Year 2, comparing the results from the PPMI and PDPB cohorts must be based on these two time points. Thus, we used the circRNAs identified in Year 2 samples of both PD cohorts for our downstream analysis.
Further, we analyzed gene expression in our samples (Baseline, Year 2, and Year 3 in the PPMI study and Baseline and Year 2 in the PDBP study; Supplemental Figure 8a-c, Supplemental Table 5.1–5.3) and observed that the host genes of the dysregulated circRNAs circSLC8A1 and circVRK1 were not significantly dysregulated at Year 2 compared to Baseline (Supplemental Figure 8d, e). However, correlation analysis of circRNA and host gene expression found a moderate positive correlation (Supplemental Figure 9).
Identification of potential miRNAs and detection of downstream gene targets in PD using co-expression networks
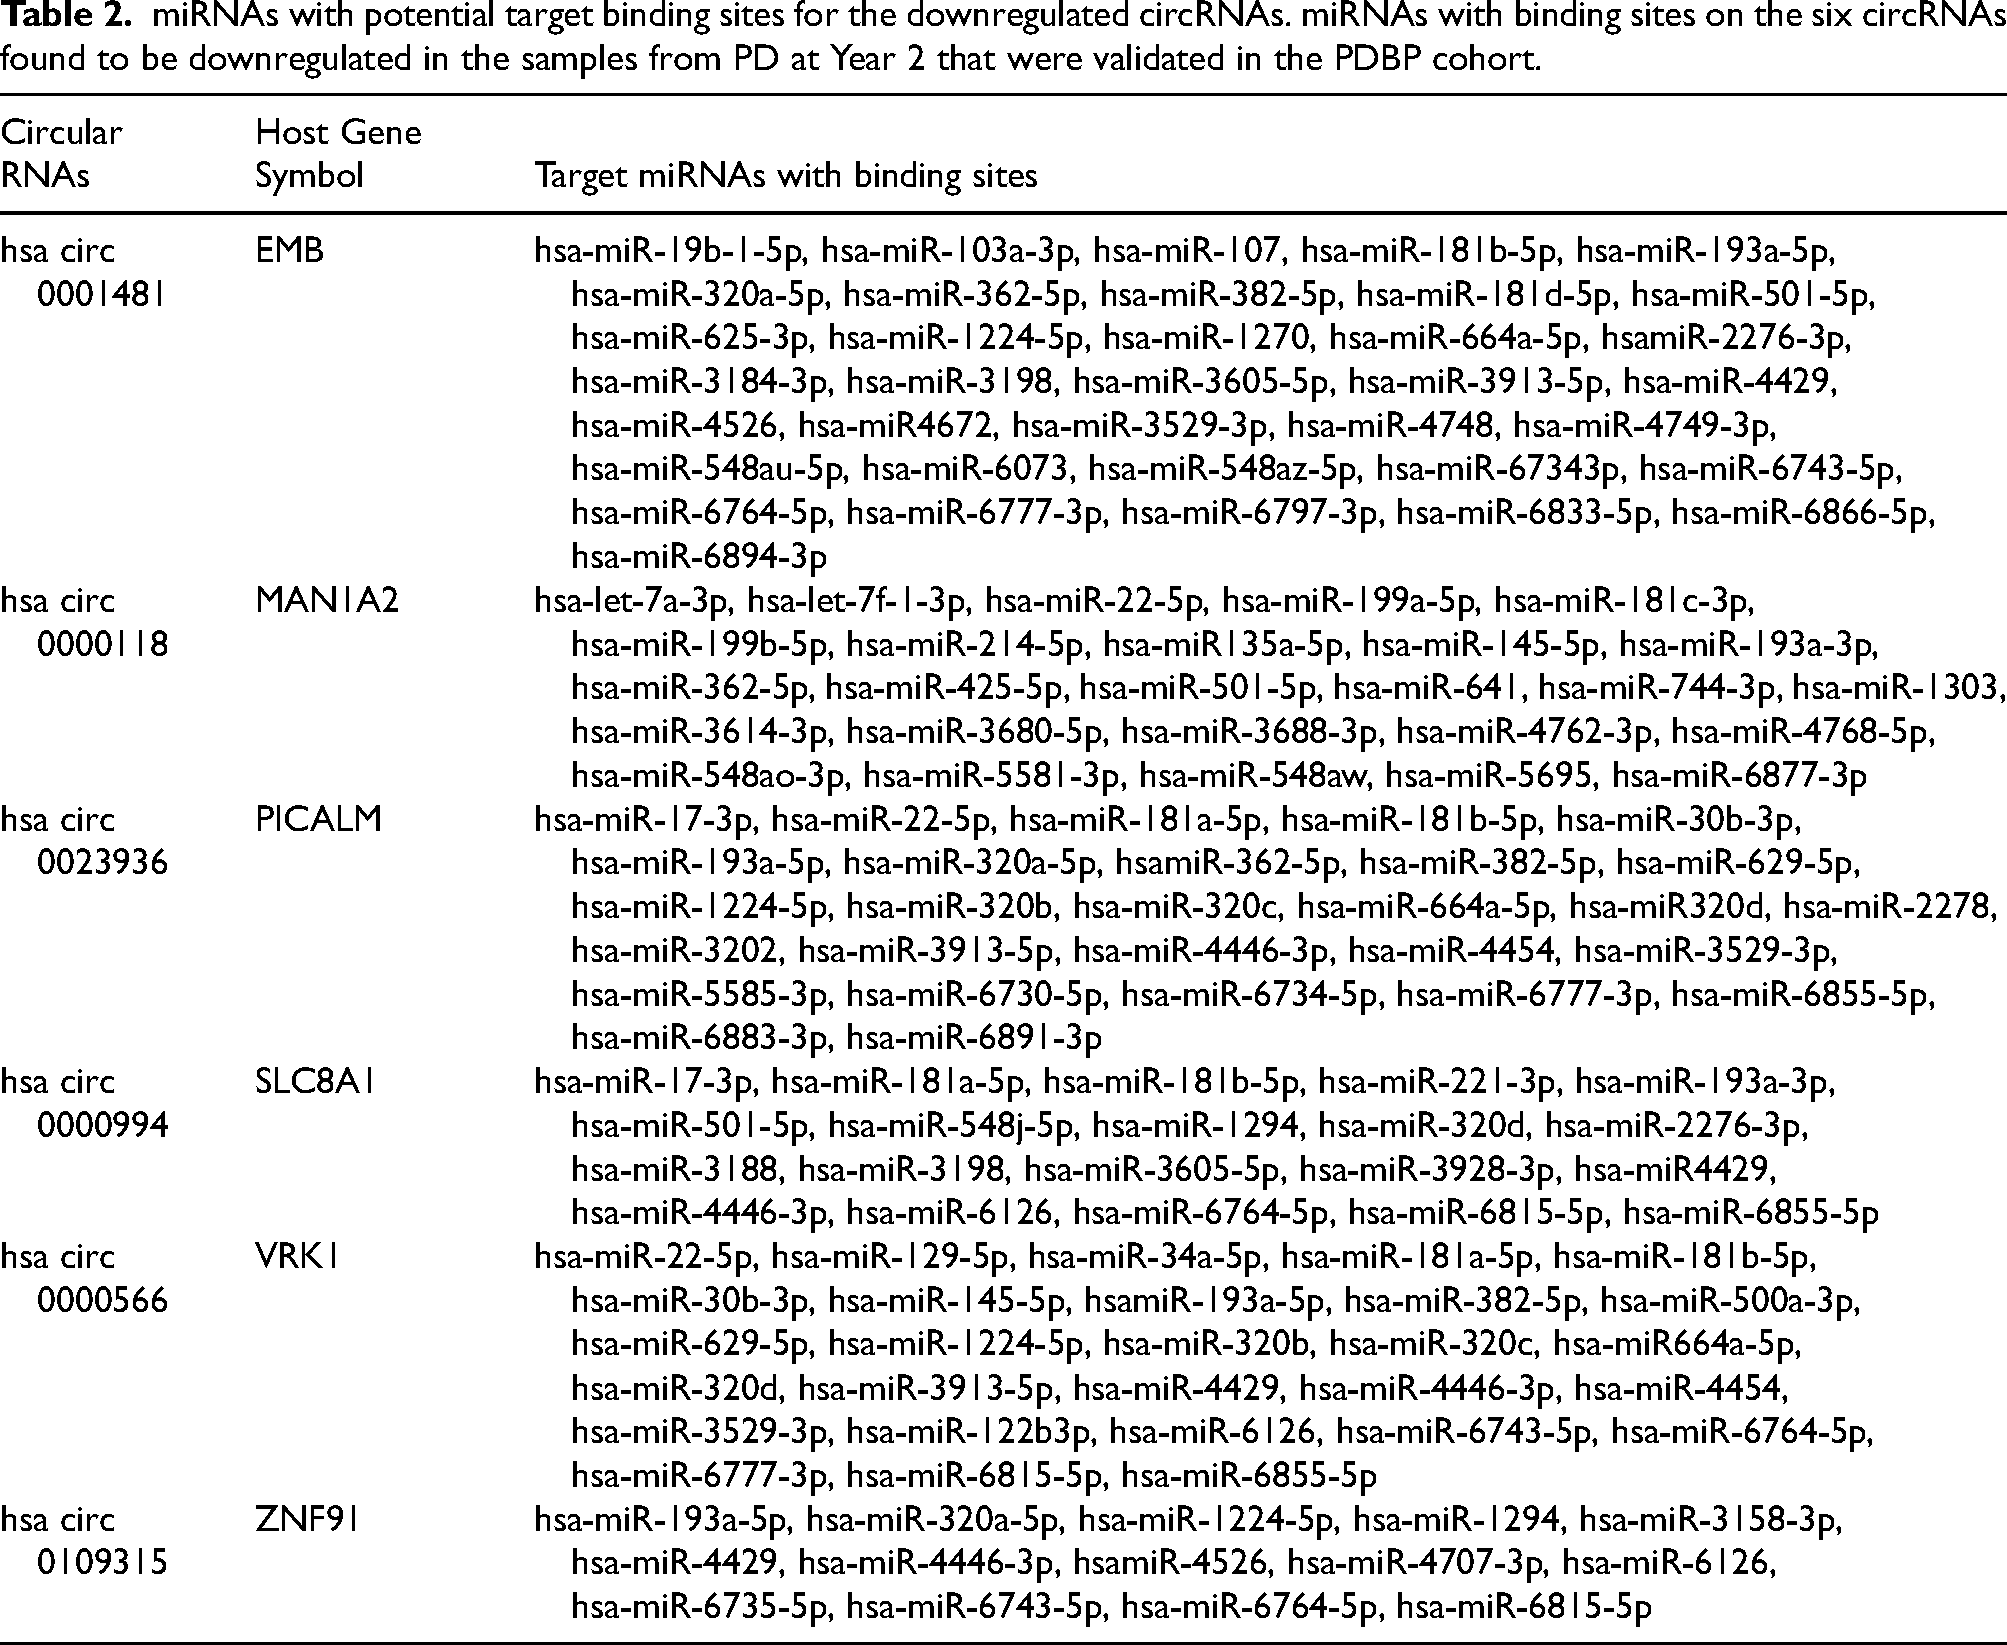
The competitive endogenous RNA (ceRNA) hypothesis suggests transcript regulation modulated by crosstalk between protein-coding and non-coding RNAs via miRNA binding sites. 61 Additionally, circRNAs are known to regulate various biological processes via miRNA-sponging. Hence, we next analyzed miRNAs with binding sites on the previously identified dysregulated circRNAs and their downstream gene targets. Using TarPmiR and miRanda, we identified 816 potential miRNA targets with binding sites on the 6 downregulated circRNAs in samples from PD participants at Year 2 (Supplemental Table 6.1). Out of those miRNAs, we further selected 764 miRNAs that were also detected in the small RNA seq data obtained from the same participants in the PPMI cohort. Correlational analysis between the circRNA expression and selected miRNA targets revealed that 99 miRNAs have a sponging effect (Table 2, Supplemental Table 6.2). Using TargetScan and miRTarBase, we identified 7465 unique downstream gene targets of those miRNAs with sponging effect (Supplemental Table 6.3). The SPONGE tool identified 146 significant competitive endogenous RNA (ceRNA) interactions between circRNA-gene pairs (Supplemental Table 6.4, Supplemental Figure 10).
miRNAs with potential target binding sites for the downregulated circRNAs. miRNAs with binding sites on the six circRNAs found to be downregulated in the samples from PD at Year 2 that were validated in the PDBP cohort.
To determine the gene targets most relevant to PD progression, we utilized WGCNA on the top 25% of genes with the highest variance in the PD samples from the PPMI cohort; 15,605 genes were selected for the analysis. Hierarchical clustering of the samples with a dendrogram height cutoff threshold of 80 identified seven samples as outliers, which were subsequently removed (Supplemental Figure 11). 54 Based on the scale-free topological fitting curve, the power was set to 10, and a signed co-expression network was constructed, clustering the genes into 18 modules (Figure 3(a) and (b)). Next, for each gene module we calculated its eigengene value, representing the expression of the genes clustered in the module. We then used Pearson's correlation coefficient to determine associations between the eigengene values of the gene modules and various progression-related traits, including different time points in the study and some of the benchmark clinical metrics used to assess the progression of PD. Two of the modules, Turquoise (r = −0.16, p = 0.007) and Pink (r = −0.14, p = 0.02), were selected as the modules of interest for further analysis, because both were significantly associated with Year 2 and Baseline time points and positively – albeit only weakly – correlated to at least two other clinical metrics (Figure 3(c)). We further explored the relationship between module membership and gene significance values in Year 2 for each gene in the turquoise and pink modules and found strong positive correlations (Figure 3(d)). We further filtered the genes in these modules based on their gene significance and module membership (|GS| > 0.15 and MM > 0.8) to obtain a list of potential hub genes.
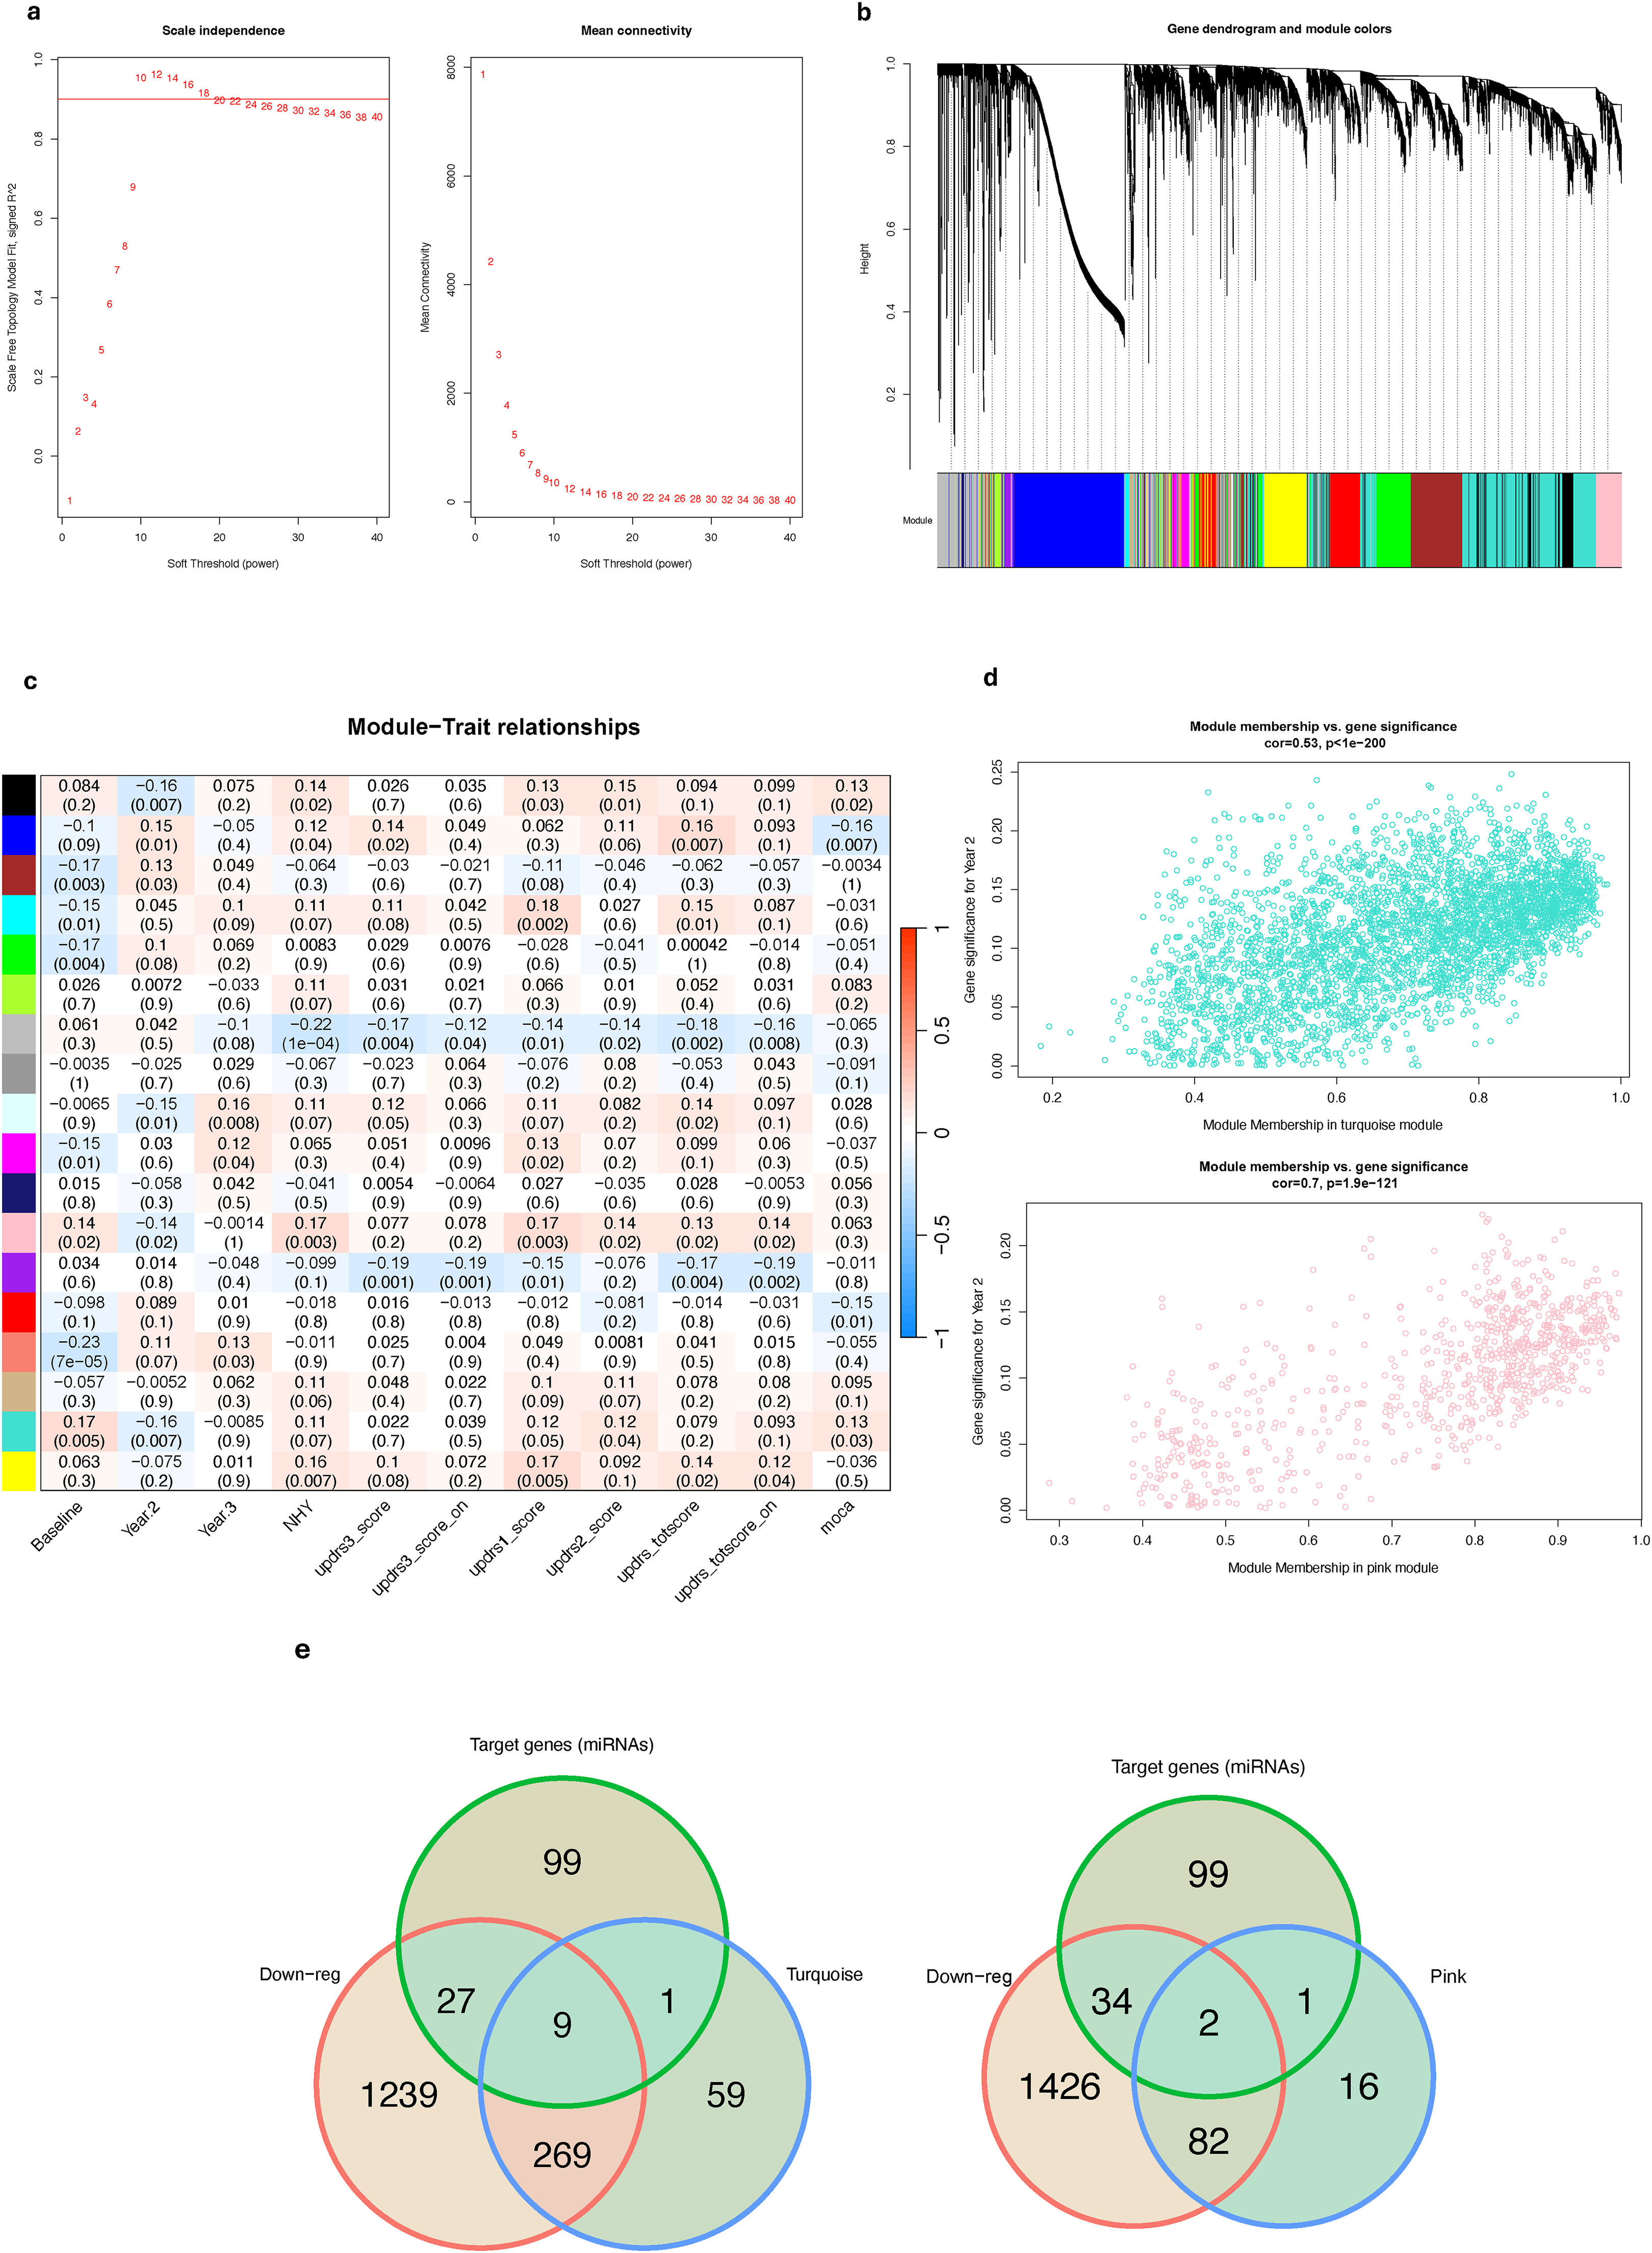
Co-expression modules help identify the gene targets of interest in the PPMI cohort. (a) Curves depicting scale-free fit index and mean connectivity for soft threshold power selection. (b) Dendrogram showing genes clustered into modules using hierarchical clustering based on topological overlap matrix dissimilarity. (c) Heatmap depicting the correlation metrics between the modules of gene clusters with various benchmark clinical metrics used to access PD progression. (d) Correlation plots depicting the relationships between the module membership of genes in the turquoise and pink modules to the level of gene significance of association with Year 2 in the study. (e) Venn diagrams depicting common gene targets that were identified to be dysregulated in samples from PD participants at Year 2 in the PPMI cohort, gene targets that miRNAs with binding sites in validated dysregulated circRNAs in samples from PD participants at Year 2, and genes in turquoise and pink modules.
Next, based on these results, we checked if the hub genes in turquoise and pink modules met two other conditions, namely (1) being significantly dysregulated in samples from PD participants in the PPMI cohort at Year 2 and (2) being one of the gene targets in the significant ceRNA network of the dysregulated circRNAs. We detected 11 significantly downregulated genes of interest in the turquoise and pink module (Figure 3(e), Supplemental Table 7). These genes were selected as the genes of interest for the downstream enrichment analysis and network visualization.
Gene ontology and KEGG enrichment analysis of the gene targets identified using WGCNA
To elucidate the processes and pathways that the potential target genes were involved in, we performed Gene Ontology (GO) and KEGG pathway enrichment analysis on the 11 downregulated genes using the enrichGO function in clusterProfiler and utilizing the hypergeometric approach (Supplemental Table 8.1). Using GO overrepresentation analysis, the top 5 terms in which the genes were found to be over-represented were protein folding chaperone (MF – GO:0044183, p.adj = 0.01), nuclear pore (CC -
GO:0005643, p.adj = 0.04), ubiquitin-protein transferase activity (MF- GO:0097027, padj = 0.04), histone chaperone activity (MF- GO:0140713, padj = 0.04), and histone binding (MF- GO:0042393, padj = 0.04) (Figure 4(a)). On the other hand, KEGG pathway analysis identified nucleocytoplasmic transport (hsa03013, p.adj = 0.01) as the pathway in which 2 of the 11 gene targets were present (Figure 4(b), Supplemental Table 8.2).
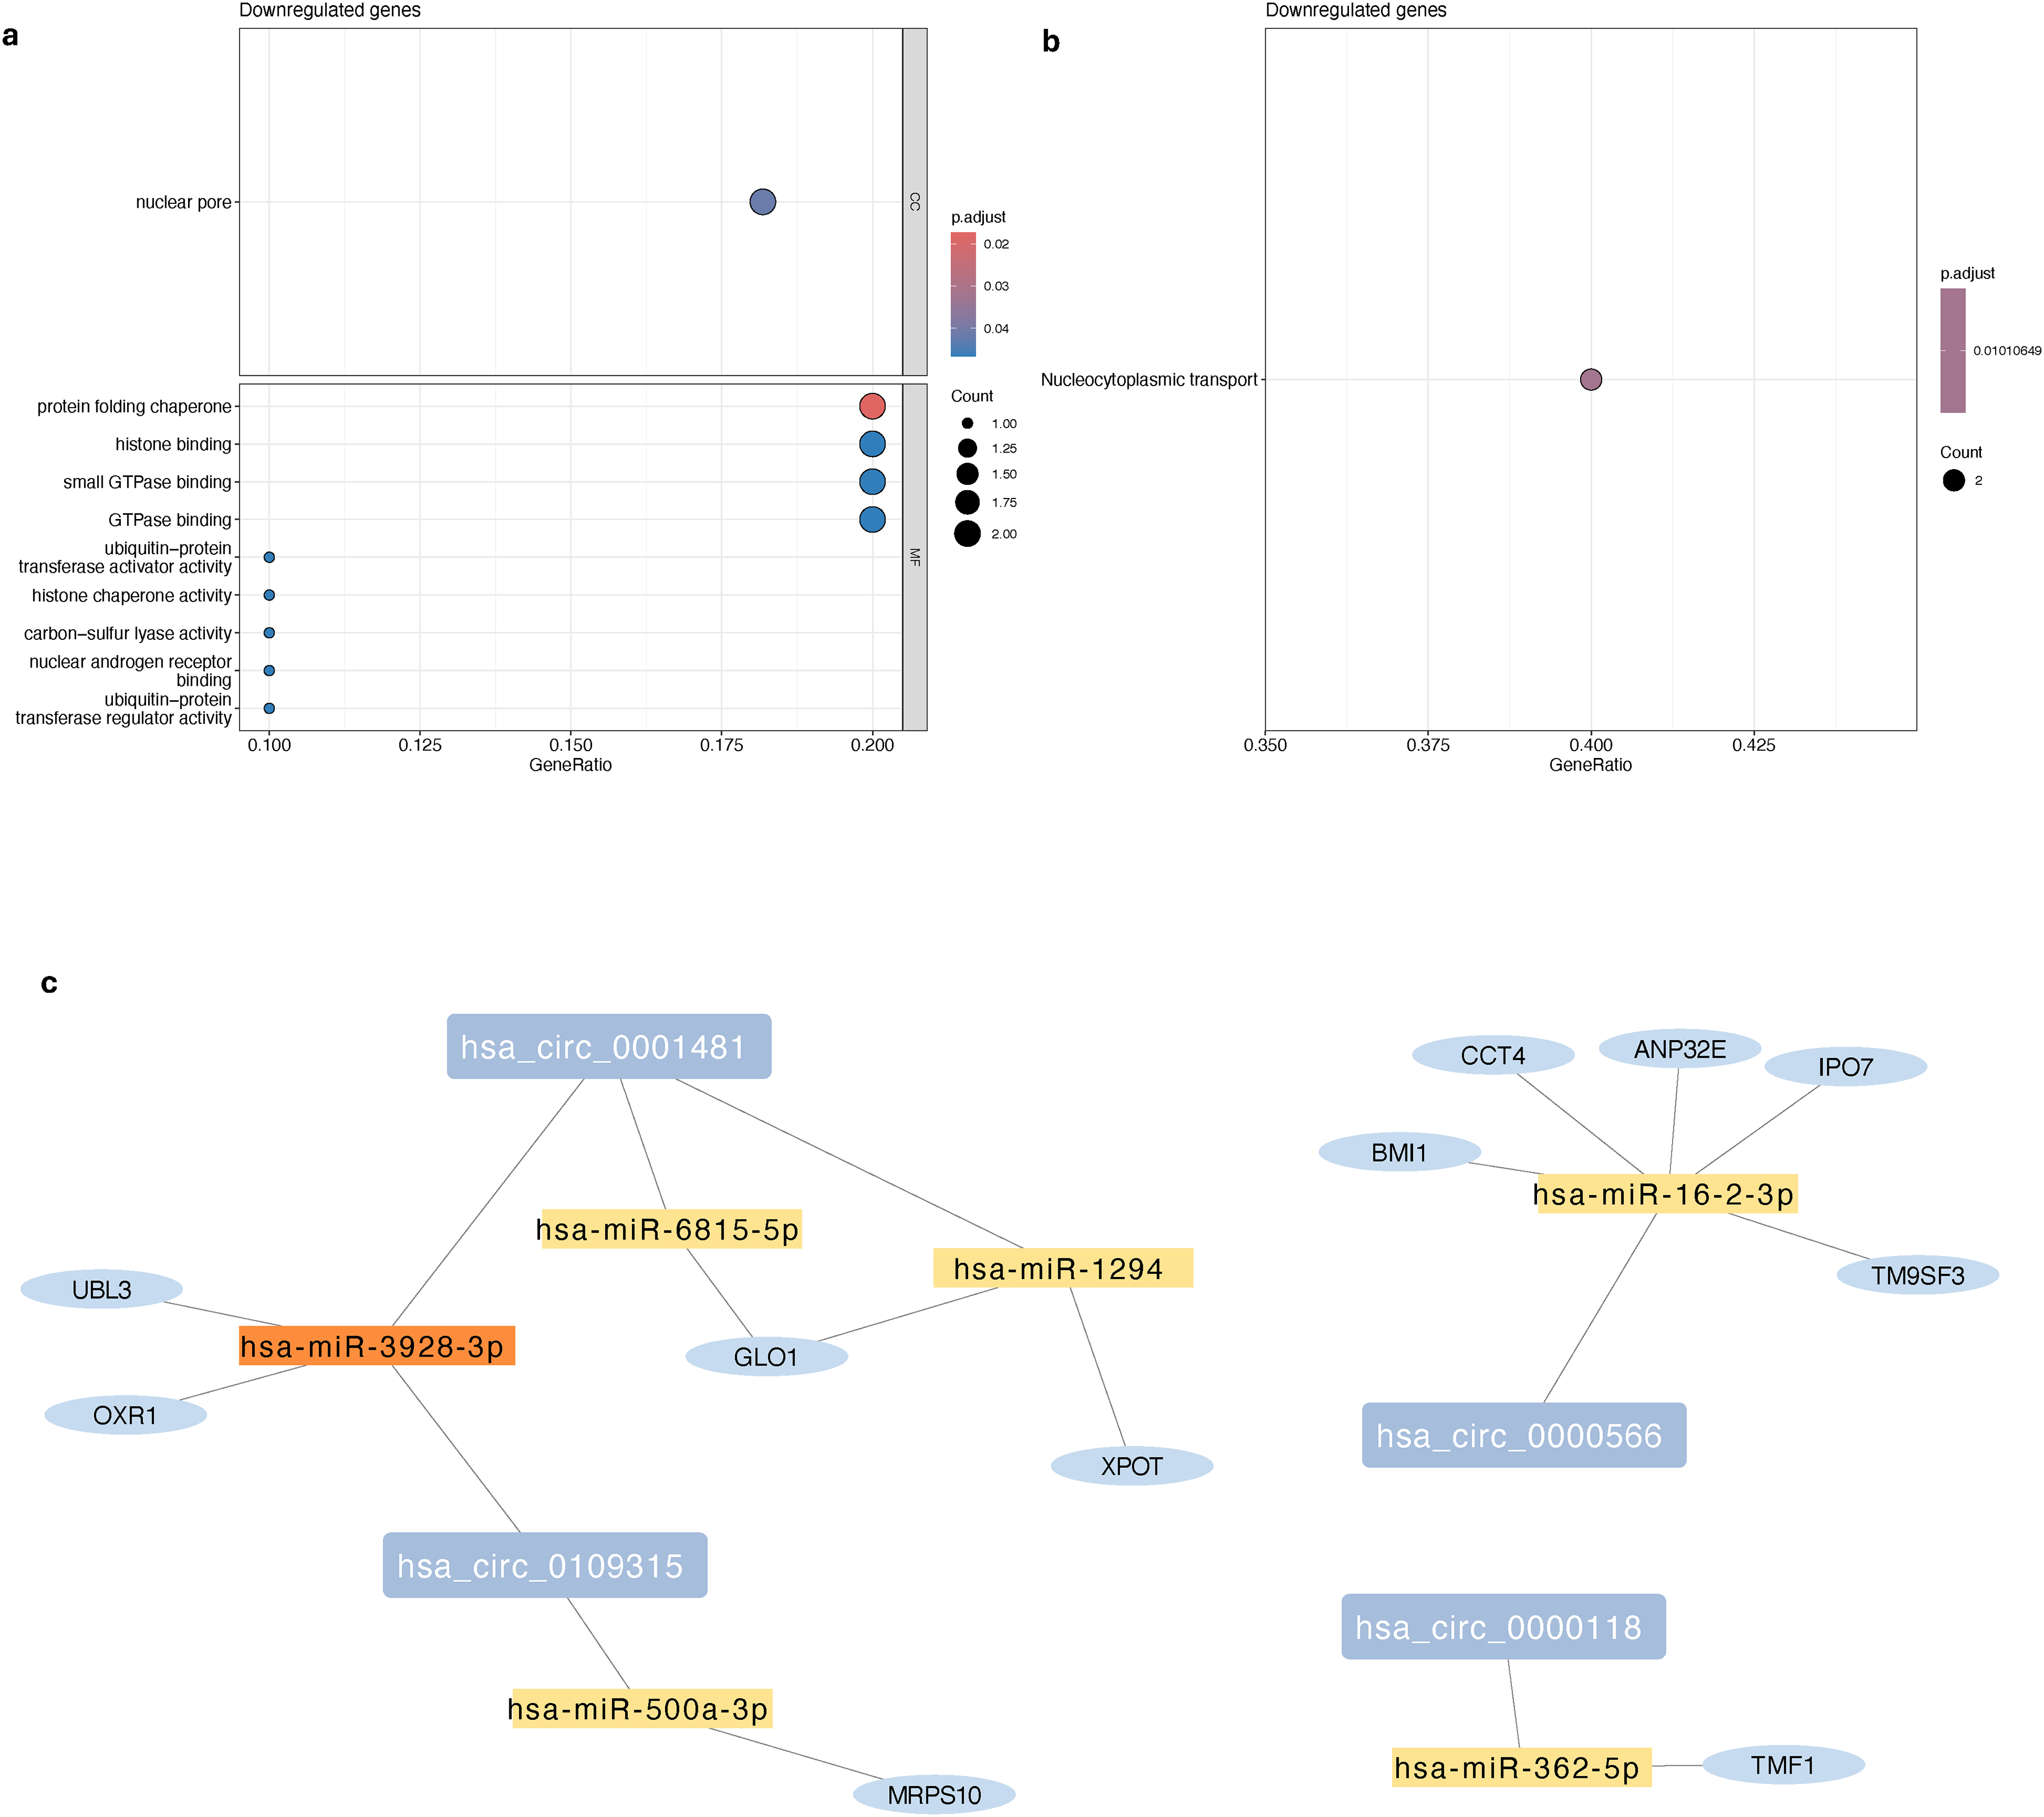
circRNA-miRNA-mRNA interactome network in Parkinson's disease. (a) Dotplot depicting the top terms in three categories of Gene Ontology (Cellular Composition: CC, and Molecular Function: MF) in target genes that were found to be significantly downregulated in PD samples at Year 2, (b) Dotplot depicting top pathways identified by the KEGG overrepresentation analysis that the target genes that were found to be significantly downregulated in PD samples at Year 2. (c) Visualization of the interactome network constructed using the dysregulated circRNAs in PD samples, gene targets identified using WGCNA, and the miRNA with sponging effect on the circRNAs that were found to be downregulated in PD participants at Year 2.
Network visualization of circRNA-miRNA-mRNA interactome
Based on the 11 target genes identified in the weighted gene correlation network, we created a circRNA-miRNA-mRNA interactome network. This interactome includes the 6 identified downregulated circRNAs of interest, the 6 miRNAs, with binding sites on those circRNAs and predicted sponging effect, and their 11 upregulated gene targets (Figure 4(c)). Visualizations of the regulatory networks indicate that multiple circRNAs or miRNAs in the network target the same miRNAs and genes. Together, these networks represent an emerging circular interactome that appears significantly dysregulated during PD progression.
circRNAs as predictors for PD progression
UPDRS III scores assess the motor complications in PD patients 62 and are recorded for PD patients on medications. Patients in a clinical state with good response to medication are said to be in an “ON” state, whereas patients on medication with poor response are in an “OFF” state. We explored the potential of the identified six circRNAs of interest as predictors of disease progression in PD participants of the PPMI cohort. Although all the participants in the PPMI cohort were unmedicated at the year of enrollment, by Year 2, most were under some form of PD medication treatment. Gene expression has been reported to be a better predictor than circRNAs for classifying early idiopathic PD. 35 Hence, we also tested if changes in expressions of the circRNAs and their eleven downstream gene targets, and only those gene targets can be used to predict PD progression. We performed a multivariate regularized logistic regression to classify participants with a progressed PD based on their UPDRS III scores at both the OFF and ON states. 58 The changes in the expression of circRNAs of interest (AUC: 0.488 [0.352–0.623]), their downstream gene targets (AUC: 0.516 [0.380–0.652]) or a combination of both (AUC: 0.441 [0.313–0.569]) performed poorly when predicting participants with clinically relevant progression based on UPDRS III scores at “OFF” states (Supplemental Figure 12(a)). However, the combined changes in circRNA expression and target gene expression (AUC: 0.703 [0.604–0.802]) and the changes in only circRNA expressions (AUC: 0.693 [0.594–0.792]) were reasonable predictors of PD progression for participants in an “ON” state (Supplemental 12b, c, Supplemental Table 9). This suggests that the change in the expression of the identified circRNAs was associated with clinically relevant PD progression as defined by UPDRS III (On) scores.
Due to their regulatory functions and higher stability, circRNAs have been widely explored as potential biomarkers in various diseases, including PD. Previously, only a few studies have analyzed the expression profiles of circRNAs in whole blood samples from PD patients and compared them to controls.32–34 The changes in the expression of circRNAs in patients at early stages of PD relevant to the progression of the disease using longitudinal data had yet to be assessed. Our study utilized bulk-RNA sequencing data from two large longitudinal studies, the PPMI and the PDBP, to identify dysregulated circRNAs in PD patients at early stages of the disease when compared to control participants. We identified hundreds of circRNAs associated with PD participants and explored their general characteristics and expression.
Using paired analysis, we were able to identify several circRNAs that are differentially expressed in samples from PD participants of both cohorts compared to HC at different time points (Year 2 versus Baseline/year of enrollment for both PPMI and PDBP and Year 3 versus Baseline for PPMI). Of those, six circRNAs were differentially expressed in Year 2 compared to Baseline in both cohorts. When comparing circRNAs identified at different time points in the PPMI cohort, more circRNAs were upregulated in samples from PD participants in Year 3 than in Year 2 compared to Baseline levels. Age-dependent accumulation of circRNAs has been previously reported in various models, such as Drosophila 22 and C. elegans, 24 as well as in brain tissue samples from mice. 23 However, the dysregulation in circRNA expression levels we observed in the paired analysis of PD samples was not observed in the paired analysis of samples collected from control samples at similar time points. These observations strongly suggest that the dysregulation in circRNA levels is specific to PD rather than normal aging. That said, due to largely varying sample sizes of patient sub-cohorts associated with treatments, we could not explore the effects of various PD medications on circRNA expression. Therefore, a potential medication effect on circRNA dysregulation cannot be excluded. Also, at the time of enrollment, PD participants in the PPMI cohort were unmedicated, whereas the same was not true for participants in the PDBP cohort. This could have limited the overlap of dysregulated circRNAs in the PDBP and PPMI cohorts, while the actual number of dysregulated circRNAs in the early PD phase could have been more significant. Although we used a low HY stage as a selection criterion, participants were still treated with different medications at different time points.
Out of all the circRNAs identified to be differentially expressed in both cohorts, only a couple of them had been previously identified in the context of PD studies. circSLC8A1 has been previously detected to be significantly upregulated in post-mortem brain samples from the substantia nigra (SN) region of PD patients, and its expression was found to be modulated by oxidative stress. 31 Its host gene, the Solute carrier family 8 member A1 (SLC8A1), encodes a sodium/calcium exchanger and regulates cytosolic calcium transport and homeostasis.63,64 Although interesting, the observations on the expressions of the circSLC8A1 in the brain and blood may not be associated. However, the role of circulating exosomal circRNAs in PD and their effects on the neuronal cellular environment must be further studied. A past study on miRNAs reported that MPP+-treated rat primary neurons take up serum-derived exosomes from MPTP-treated mice in co-culture, aggravating oxidative stress injury by suppressing the OXR1 gene via hsa-miR-137 regulation. 65
We also analyzed gene expression in the samples from the PPMI and PDBP cohorts (Supplemental Figure 8) and observed that for circSLC8A1 and circVRK1, the dysregulation was specific to the circRNA. That is, the corresponding host gene was not found to be differentially expressed. Moreover, two of the host genes of the six circRNAs of interest have been implicated in various biological mechanisms associated with neurodegeneration. PICALM (Phosphatidylinositol-binding clathrin assembly protein) is a known genetic risk factor in the late onset of Alzheimer's disease. It is critical for the trans-vascular Aβ clearance through clathrin/PICALM-mediated endocytosis. 66 Nonsense mutations in another host gene, VRK1 (Vaccinia Related Kinase 1), cause spinal muscular atrophy with pontocerebellar hypoplasia (SMA-PCH) and can affect neuronal migration by regulating APP, which is the precursor protein for Aβ. 67
Since one of the major functions of circRNAs includes regulation via microRNA-sponging, and since the regulatory ceRNA network has not been studied well in PD, we focused on the six differentially expressed circRNAs in PD samples of both cohorts. Out of the >100 predicted target miRNAs with binding sites for the six dysregulated circRNAs, we specifically focused on 99 whose expression was negatively correlated with that of the circRNAs of interest, indicating a potential sponging effect. We also explored whether the dysregulation of circRNAs affects downstream gene regulation via predicted target miRNAs and identified thousands of potential gene targets for the predicted miRNAs. Adopting the framework developed by Hoffman et al., we next implemented the SPONGE (Sparse Partial correlation ON Gene Expression) tool that uses regression and sensitivity correlation to identify significant gene-circRNA pairs with shared miRNAs, creating a ceRNA network.48,53 To narrow down the list and focus on genes most relevant to PD, we performed a co-expression analysis on the genes from PD samples using WGCNA. We identified two co-expressed gene clusters significantly associated with the time points of interest (Year 2 and Baseline) and other metrics used to evaluate PD progression in a clinical setting. Based on the co-expression results, we shortlisted co-expressed genes in the significant ceRNA network and genes that were dysregulated at Year 2. We identified 11 downregulated downstream gene targets relevant to PD progression.
Furthermore, GO and KEGG enrichment analysis revealed that the downregulated target genes were mainly enriched in the protein folding chaperone and nucleocytoplasmic transportation pathways. Dysregulation in nucleocytoplasmic transport has been linked to several neurodegenerative diseases, including PD. 68 Nuclear accumulation of a-syn in the hippocampal neurons induced the development of motor and cognitive deficits and promoted pathological phosphorylation of the α-syn at the 129 serine (ph-S129 α-syn) in mice. 69 Higher total α-syn and ph-S129 α-syn have also been reported in blood samples from PD patients with deteriorating motor symptoms. 70 Additionally, the UBL3 protein, encoded by one of the identified downstream gene targets in our ceRNA network, is known to directly interact with α-syn; this interaction is downregulated by oxidative stress. 71 Knocking out UBL3 significantly upregulated ph-S129 α-syn in the substantia nigra of the KO mice. 72 The disruption of the nucleocytoplasmic transport in the context of PD needs to be studied further. Based on our analysis, we created an interactome network of the dysregulated circRNAs in samples from PD participants with their target miRNAs and downstream dysregulated gene targets. The change in expression of the circRNAs of interest, in combination with the changes in expression of their downstream gene targets, allows patients to be grouped into those with and those without progressed PD.
Because a potential medication effect on circRNA dysregulation cannot be excluded, in the future, these findings, together with the broader consequences of transcriptional dysregulation, should be further investigated in human iPSC models, where the expression levels of these circRNAs and their predicted miRNA targets identified through association in this study can be experimentally validated. Although cell and animal models are available and widely used to study specific cellular mechanisms associated with PD pathology, they are not appropriate for validating the observations from PD progression-related results as they cannot sufficiently replicate the clinical features of PD patients. 73
In conclusion, our study profiled circRNA expression in blood samples from PD patients and identified circRNA dysregulation associated with disease progression. We also derived a novel PD-progression-linked interactome network comprising (a) the dysregulated circRNAs, (b) their potential miRNA targets that contain corresponding binding sites enabling miRNA sponging, and (c) the downstream gene targets of these miRNAs. This network has the potential to serve as a significant predictor of clinical motor manifestations during PD progression. We have presented strong evidence supporting the idea of dysregulated circular RNAs as an indicator of PD progression. Moreover, it is perceivable that circRNAs, mediated by their interactome, also play an active role.
Supplemental Material
sj-docx-1-pkn-10.1177_1877718X251331930 - Supplemental material for Identification of a circRNA-miRNA-mRNA interactome associated with Parkinson's disease progression
Supplemental material, sj-docx-1-pkn-10.1177_1877718X251331930 for Identification of a circRNA-miRNA-mRNA interactome associated with Parkinson's disease progression by Lisa Shrestha and André Leier in Journal of Parkinson's Disease
Supplemental Material
sj-xlsx-3-pkn-10.1177_1877718X251331930 - Supplemental material for Identification of a circRNA-miRNA-mRNA interactome associated with Parkinson's disease progression
Supplemental material, sj-xlsx-3-pkn-10.1177_1877718X251331930 for Identification of a circRNA-miRNA-mRNA interactome associated with Parkinson's disease progression by Lisa Shrestha and André Leier in Journal of Parkinson's Disease
Footnotes
Acknowledgments
Data used in the preparation of this article were obtained from the Accelerating Medicine Partnership® (AMP®) Parkinson's Disease (AMP PD) Knowledge Platform. For up-to-date information on the study, visit https://www.amp-pd.org. The AMP® PD program is a public-private partnership managed by the Foundation for the National Institutes of Health and funded by the National Institute of Neurological Disorders and Stroke (NINDS) in partnership with the Aligning Science Across Parkinson's (ASAP) initiative; Celgene Corporation, a subsidiary of Bristol-Myers Squibb Company; GlaxoSmithKline plc (GSK); The Michael J. Fox Foundation for Parkinson's Research; Pfizer Inc.; AbbVie Inc.; Sanofi US Services Inc.; and Verily Life Sciences. “ACCELERATING MEDICINES PARTNERSHIP” and AMP are registered service marks of the U.S. Department of Health and Human Services. The Parkinson's Disease Biomarker Program (PDBP) consortium is supported by the National Institute of Neurological Disorders and Stroke (NINDS) at the National Institutes of Health. A full list of PDBP investigators can be found at ![]() . The PDBP investigators have not participated in reviewing the data analysis or content of the manuscript.
. The PDBP investigators have not participated in reviewing the data analysis or content of the manuscript.
Ethical considerations
The data used in this paper were obtained from the PPMI and PDBP studies. Both studies were conducted after approval from the local ethics committee in accordance with the Declaration of Helsinki and Good Clinical Practice guidelines.
Funding
The author(s) disclosed receipt of the following financial support for the research, authorship, and/or publication of this article: This work was funded by a start-up package provided to Dr Leier through the UAB Dept. of Genetics and the UAB Informatics Institute. PPMI – a public-private partnership – is funded by the Michael J. Fox Foundation for Parkinson's Research and funding partners, including 4D Pharma, Abbvie, AcureX, Allergan, Amathus Therapeutics, Aligning Science Across Parkinson's, AskBio, Avid Radiopharmaceuticals, BIAL, Biogen, Biohaven, BioLegend, BlueRock Therapeutics, Bristol-Myers Squibb, Calico Labs, Celgene, Cerevel Therapeutics, Coave Therapeutics, DaCapo Brainscience, Denali, Edmond J. Safra Foundation, Eli Lilly, Gain Therapeutics, GE HealthCare, Genentech, GSK, Golub Capital, Handl Therapeutics, Insitro, Janssen Neuroscience, Lundbeck, Merck, Meso Scale Discovery, Mission Therapeutics, Neurocrine Biosciences, Pfizer, Piramal, Prevail Therapeutics, Roche, Sanofi, Servier, Sun Pharma Advanced Research Company, Takeda, Teva, UCB, Vanqua Bio, Verily, Voyager Therapeutics, the Weston Family Foundation and Yumanity Therapeutics. Data used in the preparation of this article were obtained [on September 19, 2019] from the Parkinson's Progression Markers Initiative (PPMI) database (www.ppmi-info.org/access-data-specimens/download-data), RRID:SCR_006431. For up-to-date information on the study, visit ![]() ”. Use of a mix of Tier 1 and Tier 3 data: Our analysis used RNA-Seq data and metadata from selected participants obtained from PPMI upon the request and approval of the PPMI Data Access Committee. We thank Dr Ashley Harms for her support and help with the manuscript. We would also like to thank Dr David Standaert, Dr Tatjana Coric, Dr Tatiana Marquez-Lago, and Dr David Schneider for their guidance and discussion.
”. Use of a mix of Tier 1 and Tier 3 data: Our analysis used RNA-Seq data and metadata from selected participants obtained from PPMI upon the request and approval of the PPMI Data Access Committee. We thank Dr Ashley Harms for her support and help with the manuscript. We would also like to thank Dr David Standaert, Dr Tatjana Coric, Dr Tatiana Marquez-Lago, and Dr David Schneider for their guidance and discussion.
Conflicting interests
The author(s) declared no potential conflicts of interest with respect to the research, authorship, and/or publication of this article.
Data availability
The raw total and small RNA sequencing data for the PPMI Cohort used in this study is available at https://www.ppmi-info.org/. The raw total RNA sequencing from the PDBP Cohort is available at https://www.amp-pd.org. All the R scripts used for data analysis and visualization are publicly available in this GitHub repository: ![]() .
.
Supplemental material
Supplemental material for this article is available online.
References
Supplementary Material
Please find the following supplemental material available below.
For Open Access articles published under a Creative Commons License, all supplemental material carries the same license as the article it is associated with.
For non-Open Access articles published, all supplemental material carries a non-exclusive license, and permission requests for re-use of supplemental material or any part of supplemental material shall be sent directly to the copyright owner as specified in the copyright notice associated with the article.