
Abstract
Background
Development of objective, reliable and easy-to-use methods to detect the onset of motor changes in Parkinson's disease (PD) is required to identify the temporal window in which neuromodulatory therapies could be implemented. Turning impairments are present at early stages of PD. However, it is unclear, to date, whether circular walking is also altered in prodromal PD.
Objective
Explore the predictive potential of circular walking in prodromal PD.
Methods
We included 102 subjects from a nine-year prospective cohort study (with 712 participants) in the current nested case-control analysis: 16 diagnosed with PD during follow-up (incident PD) and 96 healthy controls, matched in gender, age, and education with a 1:6 ratio. Forty-one gait features were extracted from baseline assessments with accelerometers under single and dual-tasking conditions. A Cox proportional hazards regression analysis was used to test the temporal association of non-correlated gait features to the probability of being diagnosed with PD.
Results
We identified associations between time from baseline measurement to PD diagnosis for eleven gait features, mostly based on harmonic ratios, step and stride variability, and index of harmonicity, partially in combination with gait speed. Most significant associations indicated that low gait symmetry and low rhythmicity were associated with larger hazard of being diagnosed with PD. Area under the curve ranged 0.63-0.69.
Conclusions
Despite low sensitivity and specificity, the findings potentially reflect prodromal motor impairments of PD manifested during circular walking, assessed quantitatively with a low-cost and wearable instrument. This will contribute to the characterization of pre-diagnostic PD motor symptoms.
Plain language summary
Parkinson's disease (PD) is a progressive condition that affects movement. Detecting motor changes early, even before clear symptoms appear, could help identify the right time to start treatments that slow down the disease. Turning and circular walking are often affected early in PD, but it is unclear if these impairments begin before a PD diagnosis. This study looked at how people walk in circles to see if it could predict PD before diagnosis. Researchers analyzed data from 102 people in a long-term study. Sixteen of these participants developed PD during the study, and 96 healthy individuals (matched by age, gender, and education) were used as controls. We used a single wearable sensor to measure 41 walking features during simple and multi-tasking walking tests. The results showed that certain walking features like symmetry, rhythm, and stride consistency were linked to a higher likelihood of developing PD. People with less symmetrical and less rhythmic walking patterns were more likely to develop PD. However, the ability to predict PD based on these features alone was limited. In summary, this study suggests that circular walking patterns measured with low-cost wearable devices may reveal early motor impairments in PD. Although further work is needed, these findings could help improve how we identify and monitor early PD symptoms.
Introduction
Parkinson‘s disease (PD) presents with a long pre-diagnostic phase (up to many years, 1 or even decades 2 ). This phase is characterized by a progressive development of motor and non-motor symptoms, which negatively impact the daily-functioning of affected individuals.3,4 A valid detection of prodromal impairments provides a window of opportunity to prevent pathophysiologic changes of the dopaminergic system, 5 using neuromodulatory or even neuroprotective therapies.6,7 This is especially relevant in view of increasing evidence on potential therapeutic strategies that may retard or even counteract disease progression. 8
Detection of symptoms in this prodromal phase is however challenging. In a study on a cohort with idiopathic rapid eye movemeny (REM) sleep behavior disorder, olfactory loss was the earliest predictor of conversion to PD, with an onset >20 years before conversion, followed by impaired color vision, constipation and erectile dysfunction (onset 10–16 years before conversion), and slight urinary dysfunction and subtle cognitive decline (onset 7–9 years before conversion). Other studies reported the appearance of prodromal gait impairments with an average of 4.4 years before diagnosis, 9 often appearing simultaneously with rigidity (4.4 years) and limb bradykinesia (4.2 years). 10 These findings relied on clinical manifestations, 11 i.e., on semi-quantitative and qualitative clinical assessments, characterized by low-sensitivity 12 and poor intra and inter-rater reliability,13,14 and the tests targeted symptoms that are not always present in all patients with PD. 15 In other studies, imaging tools have been used to quantitatively detect initial16–18 and progressive 19 presynaptic dopaminergic dysfunction, supporting early diagnosis of PD. 20 However, these techniques are costly16,17 and not specific for PD, 20 often presenting low availability and involving high exposure to radiation,16,17 which precludes their use as a global screening instrument for prompt diagnosis of the disease. 21
Body-fixed-sensors (BFS), are easily usable in a clinical context22,23 and have been proposed as a tool to identify subtle gait impairments in early stages of PD.24,25 Particularly, in a study based on the assessment of straight gait with a BFS on the lower back, step time variability and asymmetry of gait were associated with a shorter time to PD diagnosis. 26 The location of the sensor on the low back allows an ergonomical, well accepted, easy-to-use and valid gait spatiotemporal assessment near the center of mass27,28 representative of the overall human motion pattern, 29 and used to assess turning, 30 gait stability, falling risk and balance control. 31
In PD, the biomechanical mechanisms involved in turning seem to be independent of and more altered than in linear walking performance. 32 This has been shown in the assessment of the timed up and go test, characterized by a sequence of tasks (sit-to-stand, walking, turning while walking, and stand-to-sit), among which, walking while turning was the most sensitive to PD gait impairments. 33 Circular gait requires redirection of lower limbs by asymmetric stepping, dynamic stability control and anticipatory orientation of gaze towards a new direction, which may delineate walking deficits, earlier than during straight walking. 34 Not surprisingly, turning impairment is associated to disease specificity, 30 progression 35 and severity, and is among the early motor deficiencies of clinically evident PD. 36 Altogether, we hypothesize to find disease-predictive value of gait features, assessed in circular gait, already at prodromal phases of PD. Thus, quantitative assessments of circular gait deterioration may reflect preclinical markers of PD, which might be even more evident under challenging conditions, e.g., with dual-task performance, 37 due to the potential interference of a simultaneous cognitive, visual or motor task on the circular gait performance. 38 Particularly, dual tasking that requires deviating the gaze from the path to a peripheral view may impose an additional executive and visuospatial challenge, 39 and thus, it may reveal subtle motor impairments that could increase falling risk while compromising safety, 37 already at early stages of the disease. 40
In this nine-year prospective nested case-control study, we aim to investigate whether circular gait (i.e., continuous turning or also referred as curved walking) is predictive of clinically evident PD. Particularly, in this exploratory study we will evaluate the associations of circular gait features, assessed with a single low-back BFS under single and dual-task conditions, with the risk of developing PD.
Methods
Study design and setting
All participants of this exploratory study were assessed as part of the TREND study (Tübinger evaluation of Risk factors for Early detection of Neurodegenerative Disorders).21,41 This is a prospective (starting in 2009) follow-up study in 715 individuals aged older than 50 years, aiming to define markers for an early diagnosis of PD and Alzheimer's disease (http://www.trendstudie.de).21,41 The TREND study is registered with the German Clinical Trials Registry (DRKS) under the number DRKS00022058.
Participants
The Helsinki Declaration of 1975 was respected; local ethics approval was obtained from the Medical Faculty, University Hospital of Tübingen (No. 90/2009BO2). All subjects provided informed written consent. Inclusion criteria of the TREND study were being a healthy adult older than 50 years and being free of significant hearing or visual impairments. Exclusion criteria for all study participants comprised: (1) inability to provide written informed consent (i.e., Montreal Cognitive Assessment [MoCA] < 18 points), (2) other diseases affecting the central nervous system such as the diagnosis of a neurodegenerative disease, stroke, or inflammatory central nervous pathology, (3) the administration of dopaminergic or antipsychotic drugs. Detailed inclusion and exclusion criteria are provided in previous publications.26,41 Within the follow-up of 9 years, 16 participants converted to clinically evident PD according to the United Kingdom Brain Bank Society criteria. 13 These participants were included in the current exploratory study and referred to as “incident PD” (iPD). Ninety-six healthy control participants (HCs), without prodromal markers, 41 were matched with 16 individuals from the iPD cohort for sex, age and years of education. We chose a 1:6 matching ratio (for each iPD individual, six HCs were matched in sex, age and educational level) to achieve good statistical power within an adequate confidence interval, 42 since a nested case-control study design with good matching procedures is expected to yield estimates that are as efficient and unbiased as estimates from the full cohort study. 43 An overview of demographic of both groups is presented in Table 1. In addition, clinical data which was collected at baseline is provided in Table 1. This includes the total score obtained from the Beck Depression Inventory, which is one of the most frequently employed measures of depression in PD, and the somatic items included in the scale raise questions about its ability to differentiate depression from manifestations of the disease; 44 the Geriatric Depression Scale, which primarily measures anxiety, apathy and fatigue in PD 45 and the REM Behavior Disorder Screening Questionnaire. 46
Demographics and clinical data.
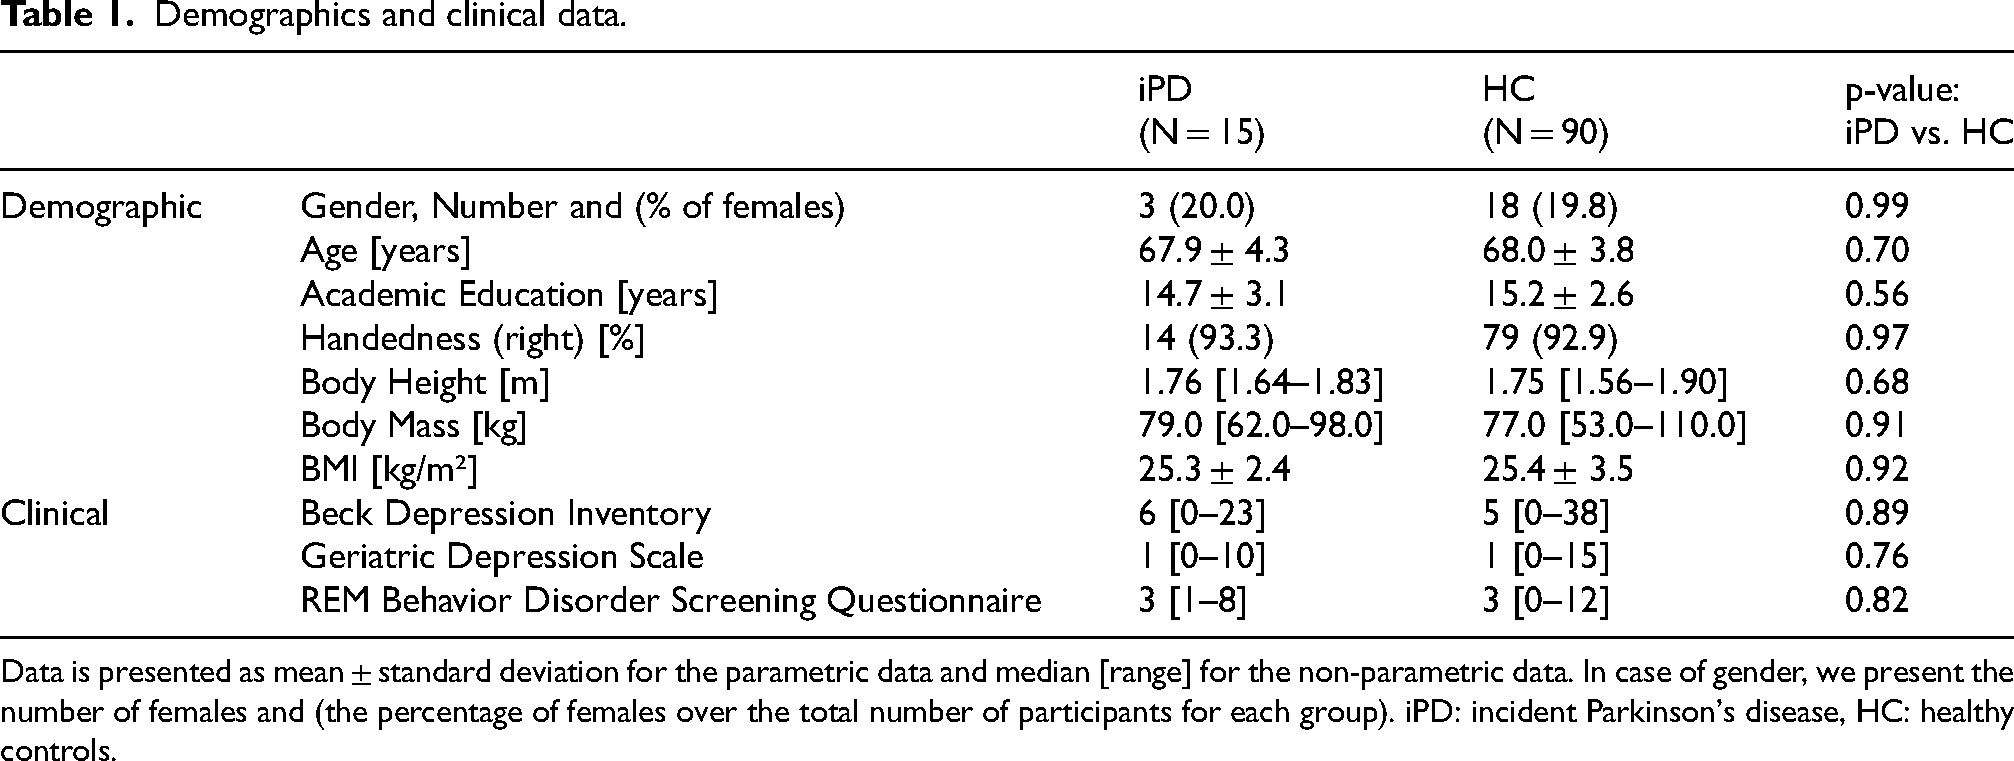
Data is presented as mean ± standard deviation for the parametric data and median [range] for the non-parametric data. In case of gender, we present the number of females and (the percentage of females over the total number of participants for each group). iPD: incident Parkinson's disease, HC: healthy controls.
The time between baseline assessment and diagnosis of PD in the iPD group ranged between 1.42 and 8 years (Table 2).
Time in years for each individual subject of the iPD cohort (incident PD) from the start of the follow-up until their diagnose.
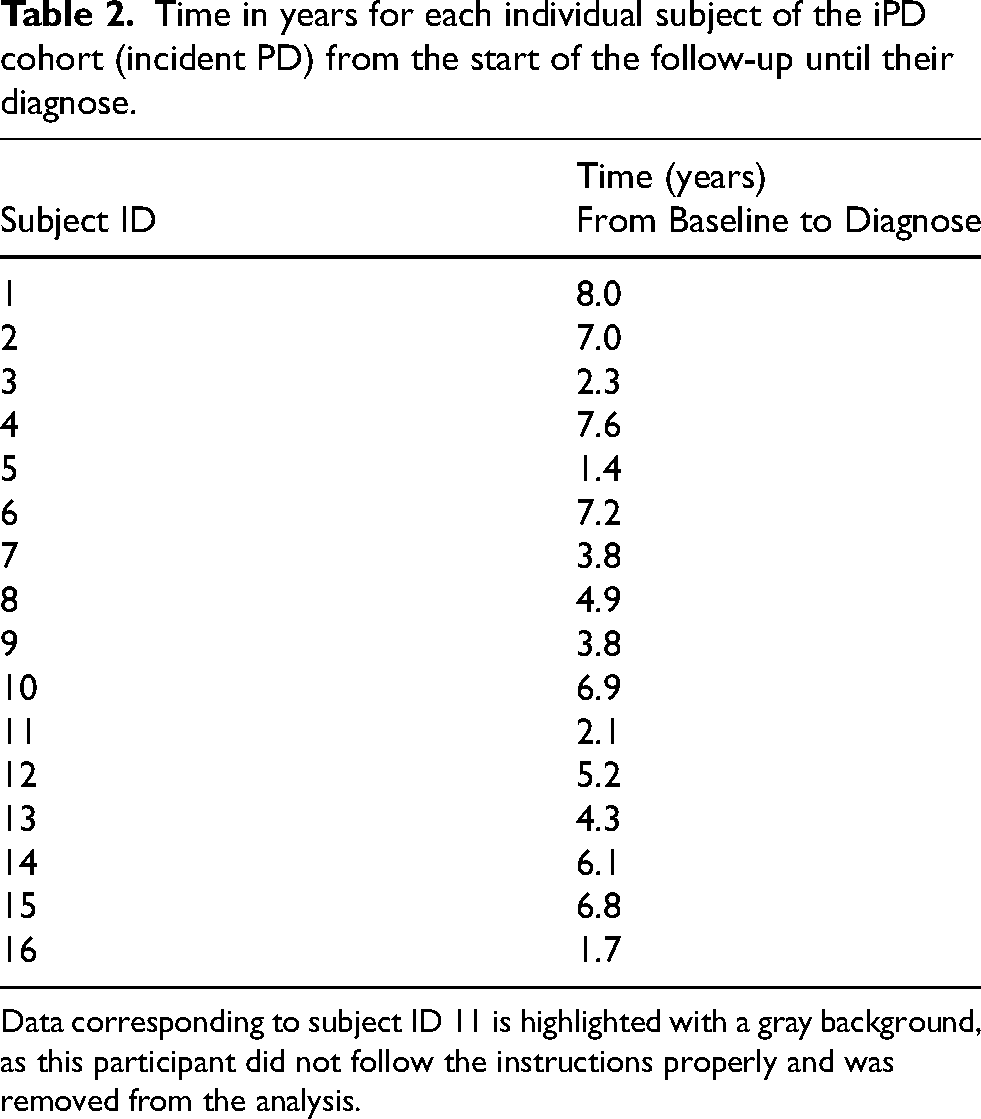
Data corresponding to subject ID 11 is highlighted with a gray background, as this participant did not follow the instructions properly and was removed from the analysis.
Protocol
At baseline, all participants underwent a clinical assessment, which included medical history, medication intake and neurological examination. In addition, three circular walking tests were performed as previously described:
47
The translation into English language of the instruction originally provided in German language is: “Please, walk three times clockwise/counter-clockwise around the marked circle with convenient gait speed and do not risk falling”. A detailed description of the procedure was presented in a previous publication.
50
Subsequently, two dual-tasks were performed, for which no hint on task prioritization was given, to omit an external influence on the prioritization process:
51
Equipment
The measurement system consisted of a BFS with a triaxial accelerometer and a triaxial gyroscope, storing data at a rate of 100 samples/s (DynaPort® Hybrid, McRoberts), a remote control and a portable computer on which the DynaPort software was installed. The accelerometer has a range of ± 19.62 m/s2 and a resolution of 0.00981 m/s2. The gyroscope has a range of ± 100 deg/s and a resolution of 0.0069 deg/s. The BFS was inserted in an elastic belt, placed around the waist so that the sensor was positioned at the level of the lowest lumbar vertebra (L5). These signals represent the overall motion pattern given the proximity of the sensor to the center of mass. 52 Dedicated software was activated with a remote control to initiate and stop data collection.
Gait analysis
A comprehensive set of forty-one gait features was estimated from triaxial acceleration signals and triaxial angular velocity signals collected on the lower back to assess gait during single and dual-tasking tests (see Supplemental Material 1). Changes on these gait features, assessed under single and dual-task in a group of patients with clinically evident PD at early-to-middle stage of the disease, have been associated to changes on UPDRS-III over a period of 5-years.53,54 Moreover, a sub selection of these features has been identified as potential markers of progression in early and mid-stages of the disease.53,55 This set included the following gait features: number of steps; total duration; asymmetry of step time; median and variability of step and stride time; standard-deviation (SD) of accelerations in all directions: vertical (VT), medio-lateral (ML) and anterior-posterior (AP),55,56 and angular velocities around all 3 axes; step and stride regularity, estimated from VT and AP accelerations; 56 harmonic ratios calculated for each signal, reflecting gait rhythmicity 55 and gait symmetry;57,58 index of harmonicity calculated for each signal, reflecting gait smoothness;59,60 normalized peak power (related to gait periodicity) and calculated for each signal as the amplitude of the power spectral density (PSD or power) at the dominant peak, normalized by the total integrated PSD; 61 and the width of the peak power at the dominant frequency, reflecting gait inconsistency or variability of dominant cycles in the signal, i.e., step cycles when calculated from VT and AP acceleration signals, and stride cycles when calculated from the ML acceleration. 61
The average of all gait features extracted from both trials (in clockwise and in counter-clockwise directions) for each protocol was obtained and used for further analysis. Details on the calculation of the gait parameters were reported previously. 62 Note that the acceleration and deceleration phase have not been excluded from the analysis, or processed separately, due to the short duration of the trial.
Statistical methods
The Shapiro-Wilk test and Shapiro-Francia test (for platykurtic and leptokurtic distributions, respectively) were implemented with the statistics toolbox of Matlab (The MathWorks Inc., R2016a, Natwick, MA, USA) to test normality of data distribution of demographic and clinical data. Accordingly, unpaired t-tests and Wilcoxon Rank tests were used to assess differences between groups for the demographic and clinical data. The level of significance was set to α = 0.05 (two-sided).
Logarithmic transformations were applied, when needed, to improve left-skewed distributions of gait features extracted from each protocol separately (Walk, W-Cross, W-Subtract), while cubic transformations were applied to improve right-skewed distributions of data. 62 In addition, all gait features were scaled to obtain zero means and unit variances (z-scores transformation). 63 Several gait features were excluded from the analysis due to high correlations (p > 0.80) with any of the remaining features. Duration of median stride, duration of median step and total duration of trial were excluded from all three protocols; whereas SD of AP acceleration, step and stride regularity from VT acceleration and normalized peak power from VT acceleration were excluded in the Walk protocol. SD of VT acceleration was excluded in both dual-tasking protocols, W-Mark and W-Subtract. Normalized peak power from AP acceleration, the number of steps and index of harmonicity from AP acceleration, were excluded from the W-Mark protocol. Thus, only non-correlated features were analyzed.
Multivariate Cox proportional-hazards regression analyses were performed with the following predictors: selected gait feature, confounder (duration of total trial or gait speed) and the interaction of gait feature with confounder. The inclusion in regression models of interactive effects along individual effects is encouraged to avoid significant bias and misinterpretation of results, despite the difficulty of its interpretation.64,65 Notice that since lower gait speeds may negatively affect gait quality in elderly,55,59,66–68 either “gait speed” or its inverse, “duration of complete trial”, was included in the model to correct for their confounding effects. We selected “gait speed” as a confounder for all the features in which higher values of these features are expected for lower gait speed; whereas “duration of complete trial” was used as a confounder for all features in which lower values are expected for slower gait, i.e., longer durations. In this way, we compensated the effect of gait speed on the direction (higher or lower values) of the features to predict PD diagnosis. As time-to-event variable we used the number of years between baseline and date of diagnosis, reported in Table 2. Data were time-to-event censored (right-censored), 65 at the end of follow-up for the HC subjects.
We report the results for gait features that reached significance, set to α = 0.05, either for the gait feature, or for the interaction of this feature with the confounder. For these predictors, the corresponding receiver operating curve (area under the curve, AUC; i.e., c-statistics) and the sensitivity and the specificity calculated for the cut-off that optimizes both, were calculated. Note that a larger AUC (> 0.7) in the Cox regression model indicates better predictability of time to event.69,70 These analyses were separately performed for all features, from each protocol (Walk, W-Box, W-Subtract). We did not correct the p-values for multiple comparisons, as this is an explorative study (as such, association of each feature with the risk for PD was individually and separately assessed) and we were concerned about possible type II errors. All Cox regression models were analyzed with the function coxphfit in Matlab 2018.a.
Results
One participant from the iPD group (participant number 11) did not follow the instructions properly and needed double the time of the average obtained for the iPD group. Thus, we removed the data of this participant and the 6 matched HC from the analysis. Demographic variables did not significantly differ between the remaining iPD and HC groups. Descriptive statistics of clinical parameters for all these groups are presented in Supplemental Material 1, with a selection of the significant results in Table 3.
Descriptive statistics of non-transformed data.
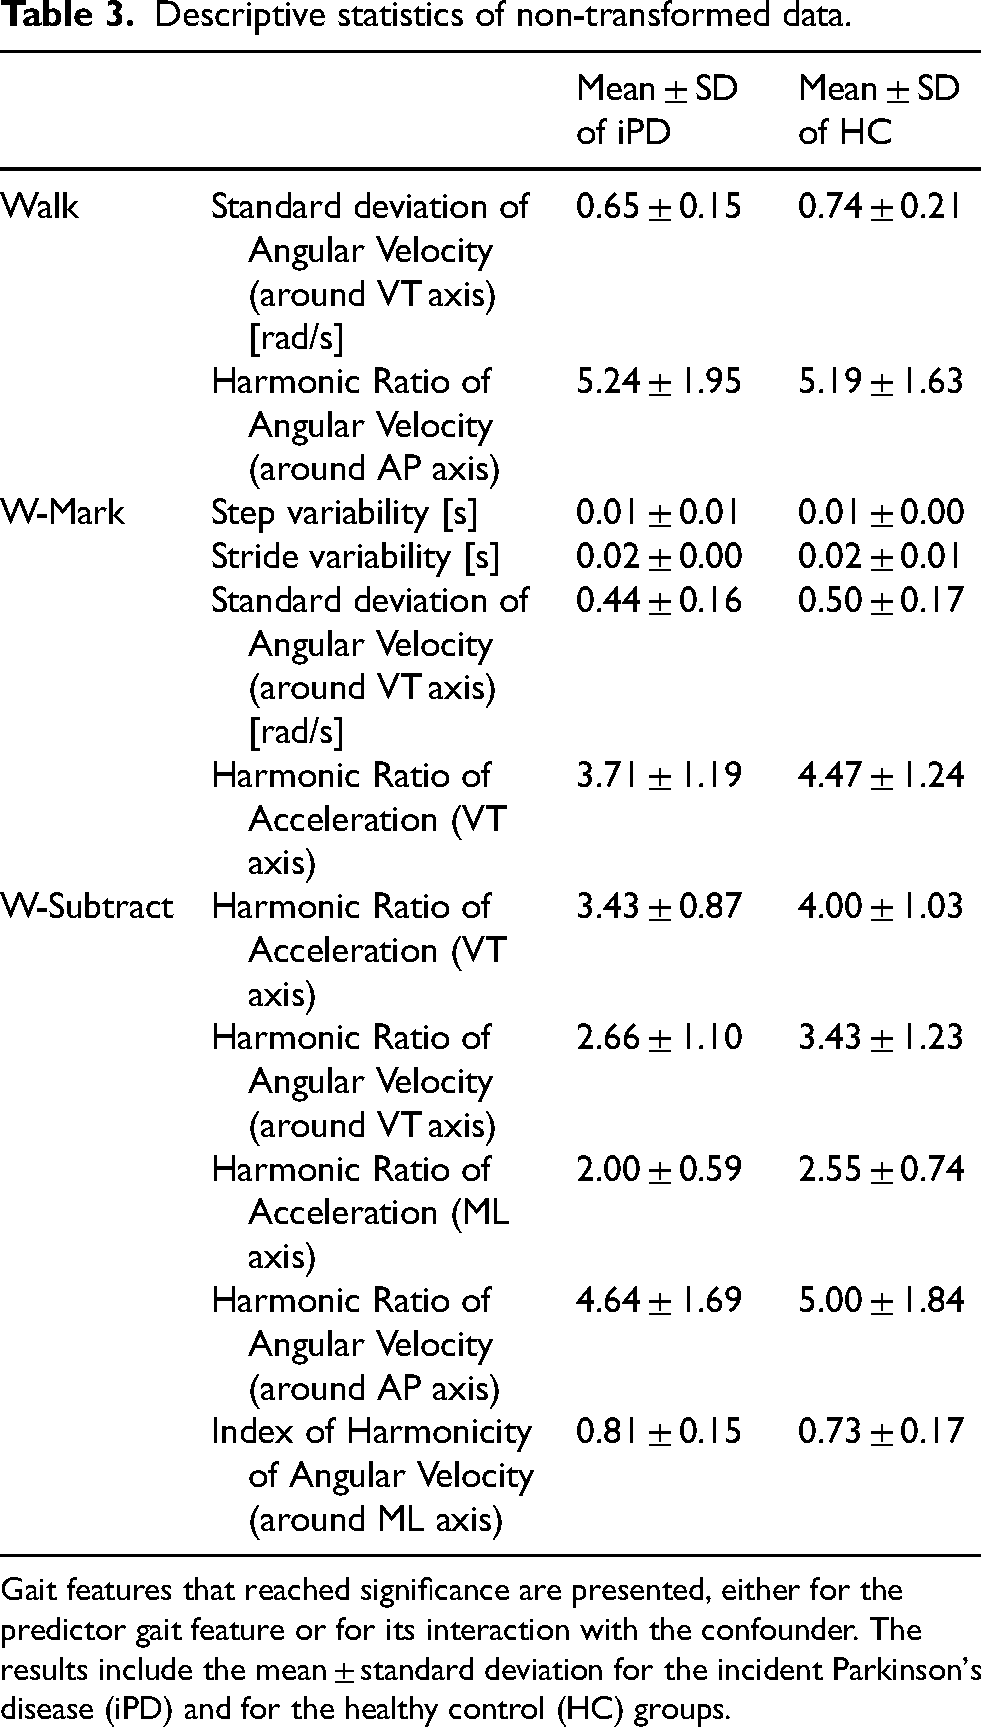
Gait features that reached significance are presented, either for the predictor gait feature or for its interaction with the confounder. The results include the mean ± standard deviation for the incident Parkinson's disease (iPD) and for the healthy control (HC) groups.
Descriptive statistics of the gait features for which a significant main effect of group or a significant interaction of group with trail duration was found are presented in Table 3. Table 4 summarizes the Cox regression model for all significant results. The AUC for single gait features ranged from 0.63 to 0.69, and the optimized sensitivity and specificity ranged from 0.53 to 1.00 and from 0.36 to 0.88, respectively. Figure 1 (A to C) presents the receiver operating curves (ROC), for features that differed between groups.
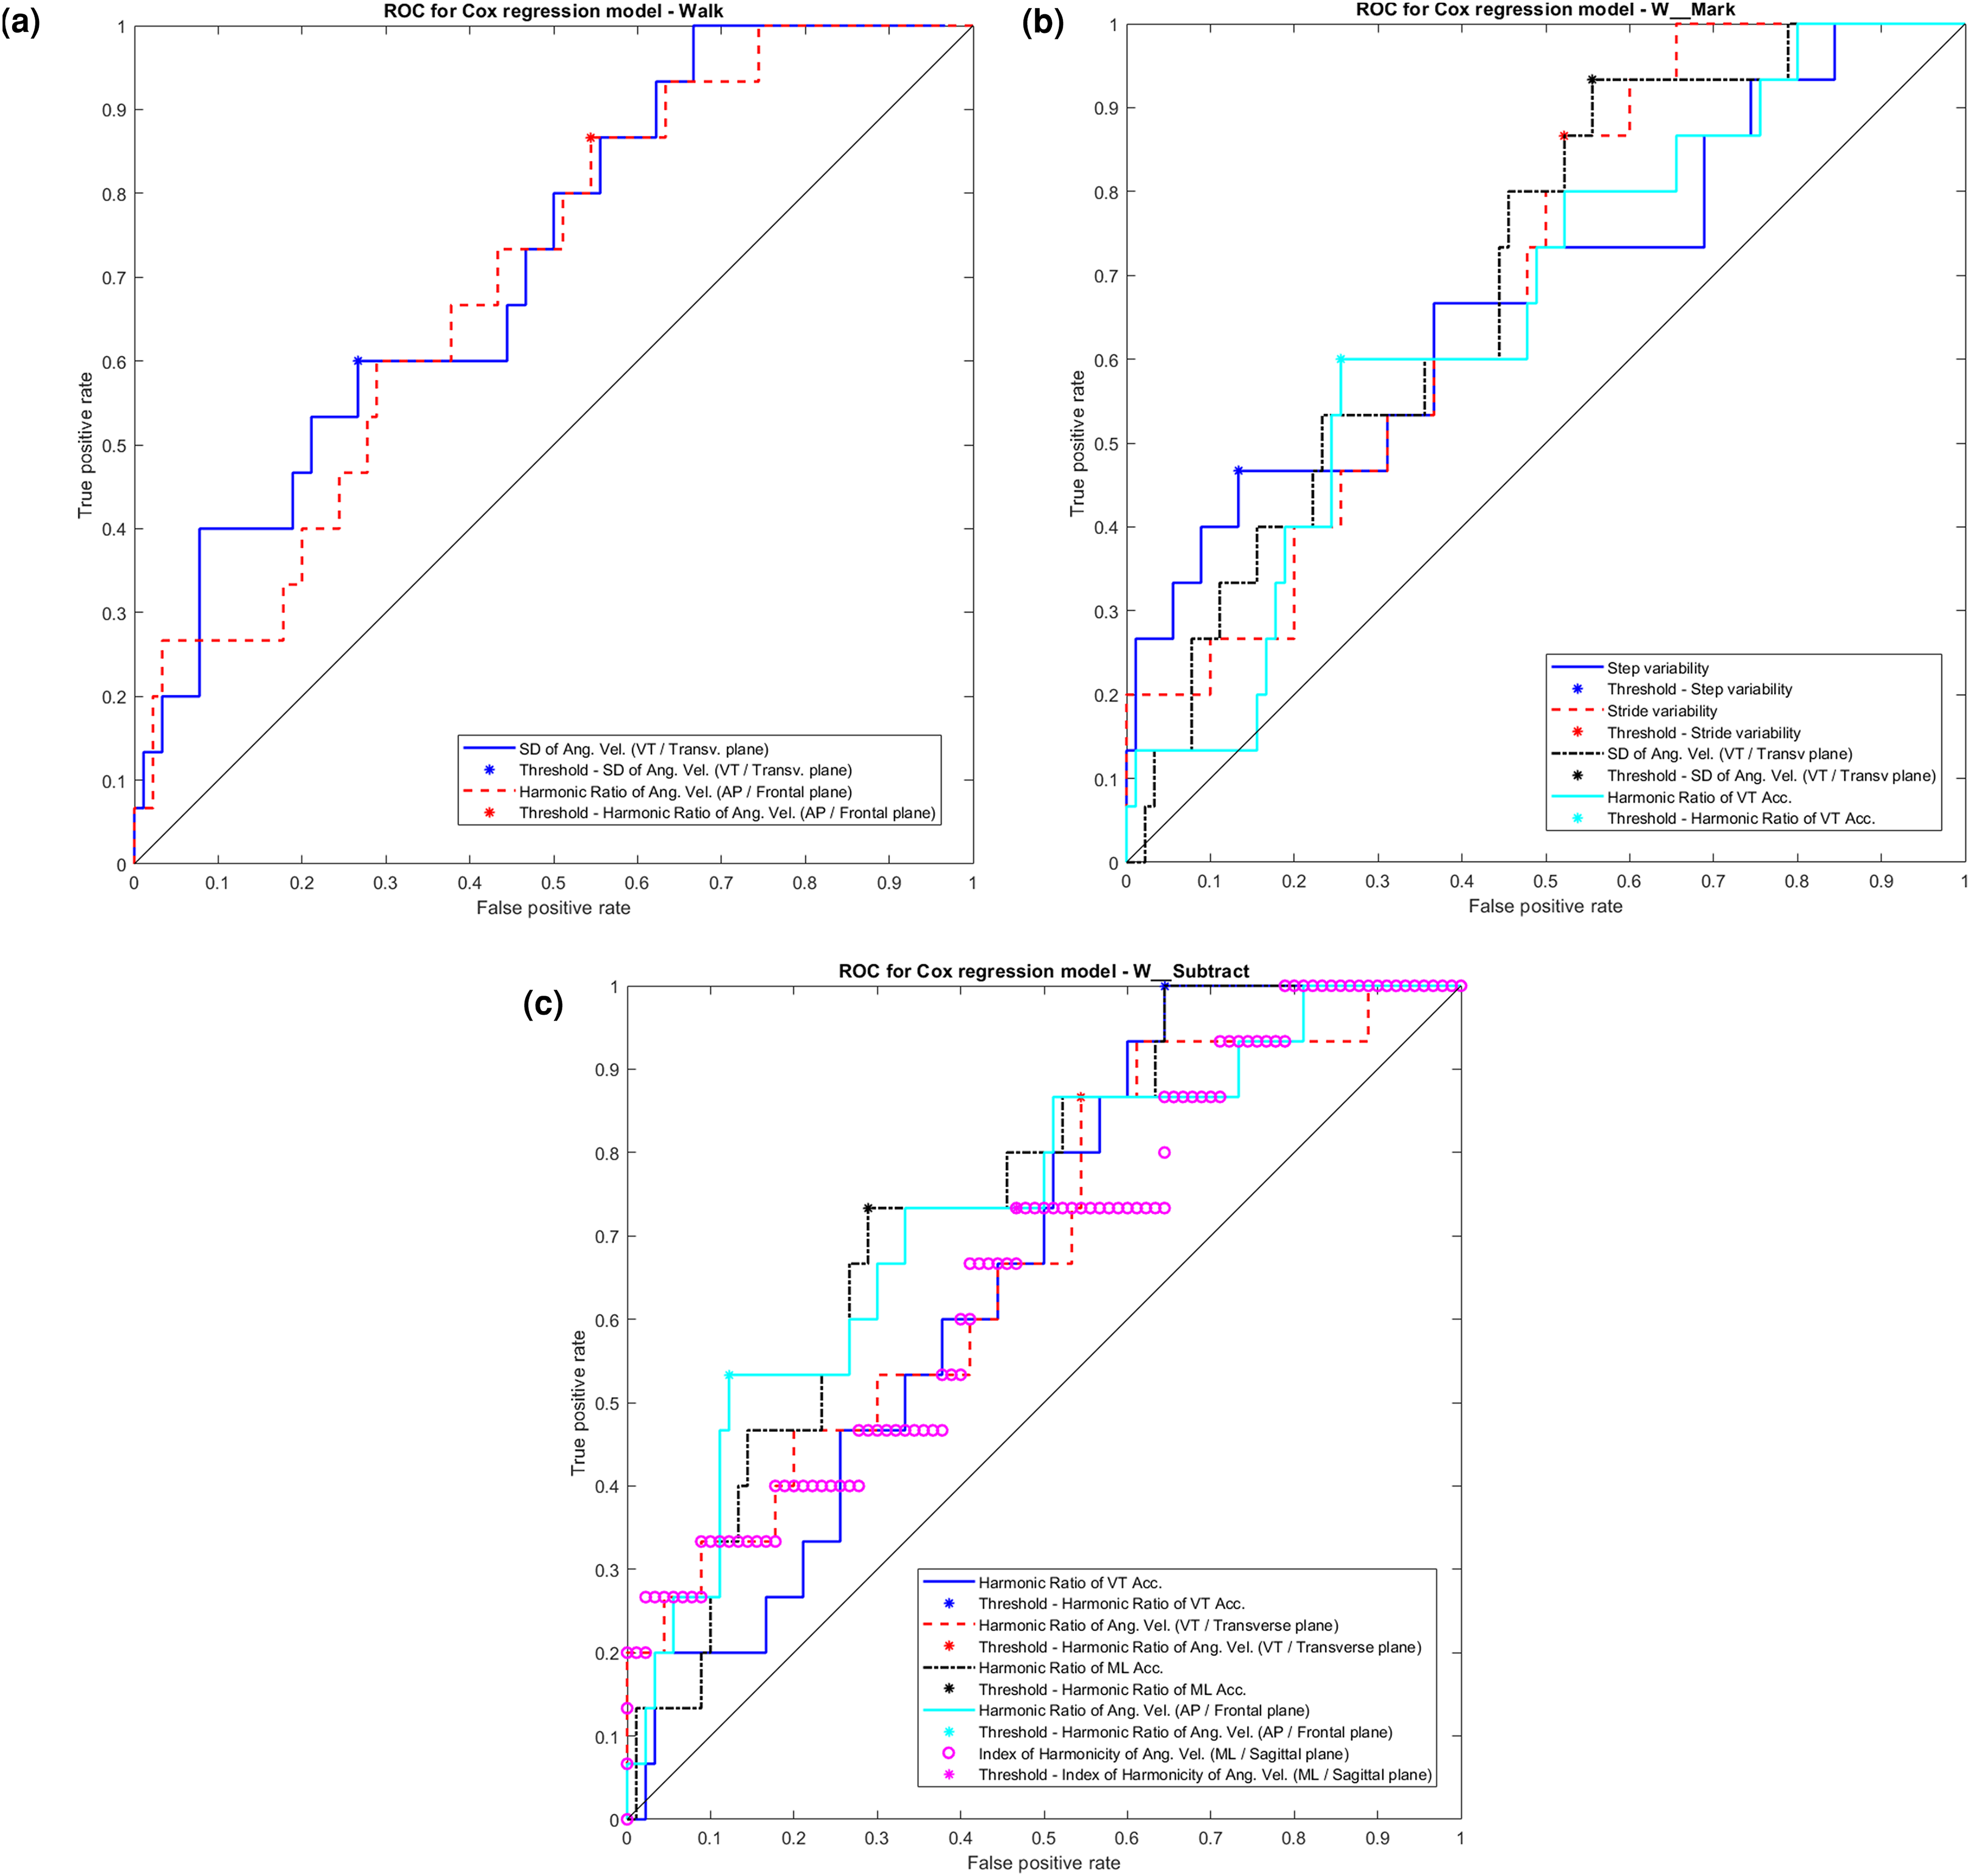
ROC (receiver operating curves) for all models. Models are presented for all gait features that reached significance (α = 0.05) in the Cox regression models, either for the predictor gait feature or for its interaction with the confounder. In the y-axis: True positive rate, in the x-axis: False positive rate. A) ROC for gait features obtained under Walk protocol; B) ROC for gait feature obtained under W-Mark protocol; C) ROC for gait features obtained under W-Subtract protocol.
Results of cox proportional hazards regression models for the diagnosis of incident Parkinson's disease.
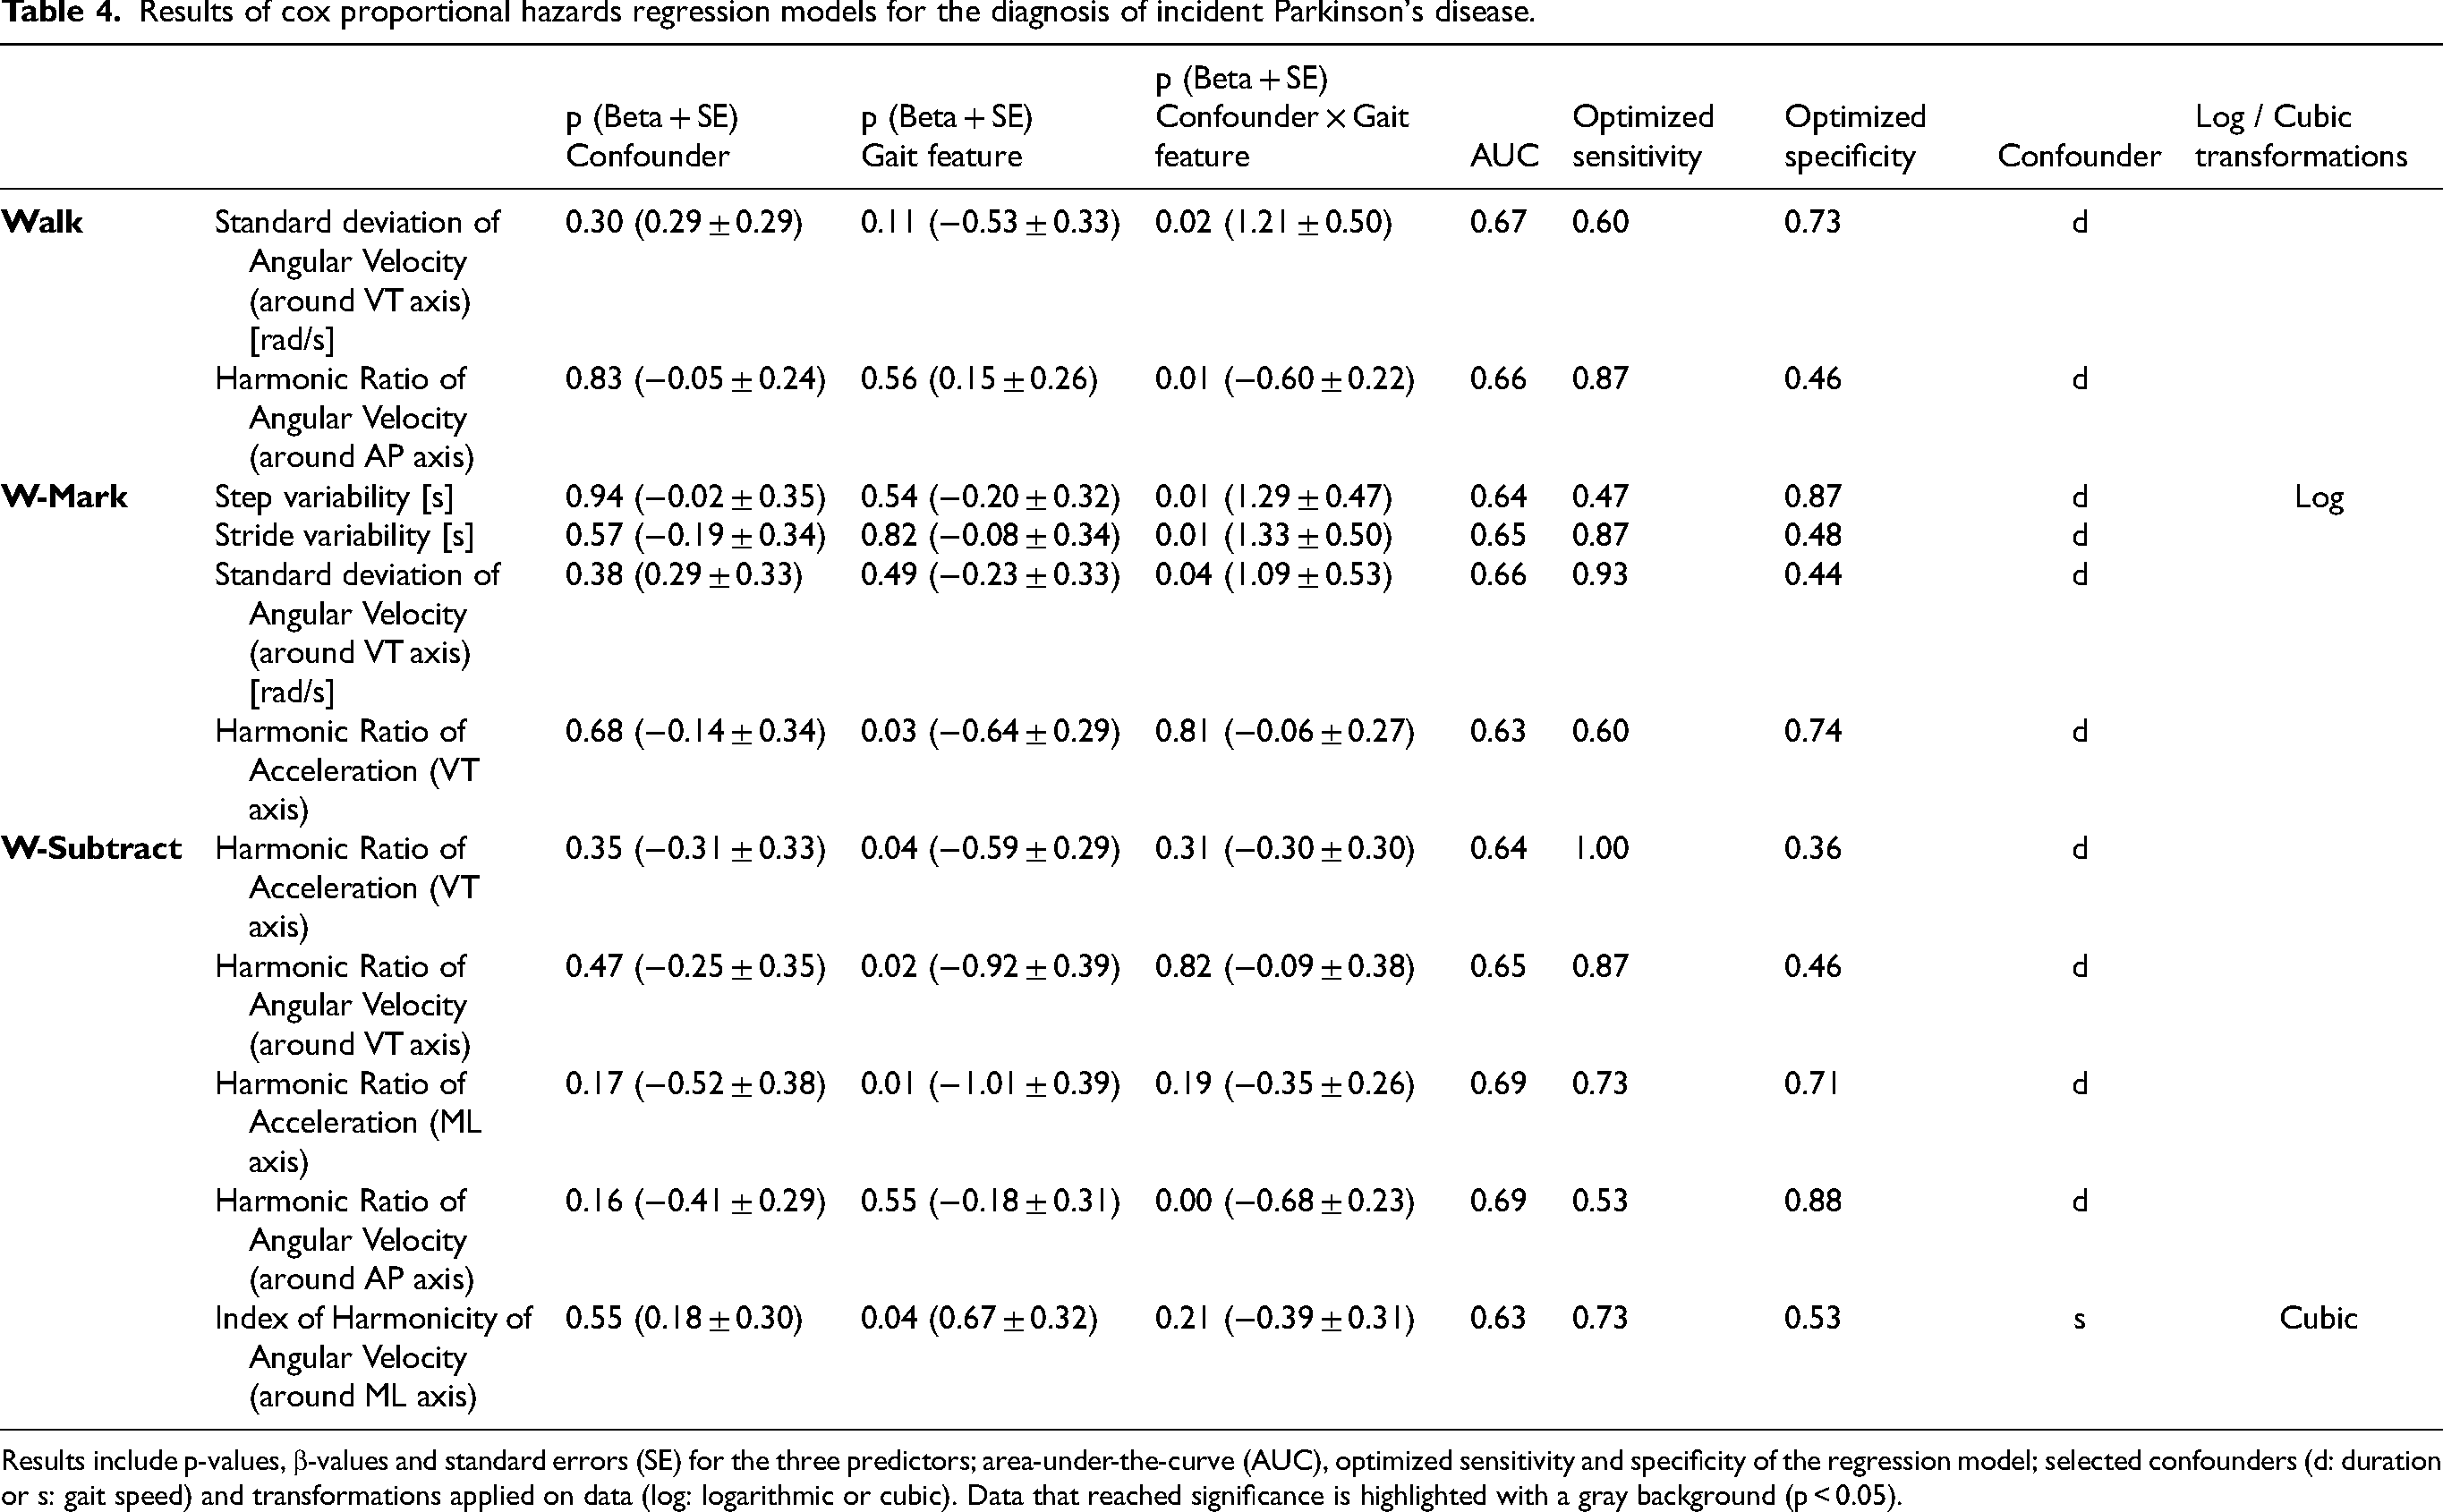
Results include p-values, β-values and standard errors (SE) for the three predictors; area-under-the-curve (AUC), optimized sensitivity and specificity of the regression model; selected confounders (d: duration or s: gait speed) and transformations applied on data (log: logarithmic or cubic). Data that reached significance is highlighted with a gray background (p < 0.05).
Overall, 11 features showed significant effects, either for the main effect or for the interaction with the confounder. Most of these significant findings (6 out of 11) were related to harmonic ratios (reflecting gait asymmetry and lack of rhythmicity in the gait pattern, see also discussion section) and all, except one, were in the expected direction.
In the single task Walk protocol, the iPD group performed the trial with an average duration of 12.6 ± 1.3 s, whereas for the HC the average duration was 12.4 ± 1.4 s. No significant main effects of gait features or confounders were found in the models. However, for two features, significant interactions with the confounder duration were found: SD of angular velocity around the VT axis and harmonic ratio of angular velocity around the AP axis. A stronger increase on SD of angular velocity with duration was associated with a higher hazard to get diagnosed with PD, whereas a decrease on the harmonic ratio of angular velocity with duration was associated to a higher hazard. 71
In the W-Cross protocol, the iPD group performed the trial with an average duration of 15.4 ± 1.2 s, whereas for the HC the average duration was 15.4 ± 1.8 s. In this protocol, a significant main effect was found for the feature harmonic ratio of VT acceleration: lower harmonic ratios were associated with a higher hazard to get diagnosed with PD. In addition, significant interactions with the confounder duration were found for step variability, stride variability and SD of angular velocity around the VT axis. Stronger increases on these features with duration were associated to a higher risk for the diagnosis of PD.
In the W-Subtract protocol, the iPD group performed the trial with an average duration of 14.7 ± 1.9 s, whereas for the HC the average duration was 14.7 ± 1.8 s. In this protocol, four significant main effects were found for the features: harmonic ratio of VT acceleration, harmonic ratio of angular velocity around the VT axis, harmonic ratio of ML acceleration and index of harmonicity from angular velocity around the ML axis. Lower harmonic ratios and higher index of harmonicity were individually associated to higher risk for the diagnosis of PD. Moreover, a significant interaction with the confounder duration was found for harmonic ratio of angular velocity around the AP axis, for which also a stronger decrease on these was associated to a higher risk for PD.
Discussion
Associations of gait features to time-to-diagnosis of clinically evident PD
We have identified associations between the time from baseline measurement to PD diagnosis, for eleven gait features in single and double task circular gait assessed with a single BFS located on the lower back. These associations potentially reflect prodromal motor impairments of PD manifested continuous turning in circular walking, a test that can be easily implemented in clinical practice, assessed quantitatively with a low-cost and wearable instrument. Most significant associations were related to harmonic ratios; in all protocols, low harmonic ratios were associated with larger hazard of being diagnosed with PD. This is consistent with a faster decline of harmonic ratios over 5 years in early stages of clinically evident PD in circular gait assessments, and significantly lower values in patients at middle stages of PD, compared to matched healthy controls. 72 Also, these harmonic ratios obtained from circular gait have been shown to be associated with UPDRS III scores. 73 Despite the abstract nature of this feature, which leads to difficult clinical interpretation, it is well acknowledge in the literature58,72 that harmonic ratios reflect asymmetry and lack of rhythmicity. 30 Thus, the results of this exploratory study suggest an association of an arrhythmic and asymmetrical gait pattern with the risk of developing PD. Harmonic ratios have been described in the literature as sensitive and versatile measures of gait stability, 73 differentiating PD patterns from controls,68,74 PD freezers from non-freezers, 75 PD fallers from non-fallers,76,77 and characterizing patients with different PD dominant symptoms (postural-impaired-gait vs. tremor). 78 Moreover, this feature could be sensitive to intervention effects, for instance to different methods of cueing.72,79 Together with previous observations6,79 and similarly to results from the assessment of straight gait in the same cohort, 26 this might indicate that pace-associated impairments in circular walking could be manifested even in prodromal PD, and can be detected from harmonic ratios. Other features associated to the time-to-diagnosis were step and stride variability from the W-Mark protocol. High gait variability assessed from this challenging “cognitive-motor-motor” task was associated with a larger hazard to get diagnosed with PD. The interaction with speed is likely explained by the fact that gait variability tends to decrease with speed even in healthy gait,80–82 consequently, high variability is an indication of impaired gait when observed at high gait speed. This finding is consistent with previous studies in which stride-time variability has been reported to predict PD conversion, 26 and as a highly sensitive marker of dynamic imbalance, inconsistent and unstable gait, 83 especially under challenging conditions,84,85 which might have sacrificed the control of step and stride fluctuations. 37 Our results, although based on a different dual-tasking condition, support the findings of a previous study, 86 in which a population at risk for developing PD (carriers of a genetic mutation on leucine-rich repeat kinase 2) also presented higher stride variability than matched HCs. Similarly, gait velocity, variability and rhythm measured in free-living environments were reduced in a cohort of participants with REM sleep behavior disorder, 87 who are at a higher risk of developing PD than healthy controls. 88
In subjects with lower gait speed, the hazard for the diagnosis of PD increased with SD of angular velocities (in Walk and W-Mark protocols). Higher SD of signals reflects a higher movement intensity, 55 and thus, would be expected to occur at higher speed, rather than at lower gait speeds (i.e., longer gait trials). This could be explained by an over-compensation in the correction for the confounding effect of duration, which would still suggest the presence of altered SDs in combination with gait speed, indicating the association between impaired control and the risk for PD.
It must be noted that while trial duration, inversely reflecting gait speed, was not associated to the risk of being diagnosed with PD on its own, harmonic ratios did show subtle prodromal motor alterations related to the lack of rhythmicity, periodicity and symmetry. Similarly, a previous study based on straight gait assessed on the same cohort 26 reported that gait variability and asymmetry, rather than gait speed, were the best predictors for the conversion to clinical PD. Altogether this motivates the use of instrumented gait assessment protocols, which can provide a battery of features (additional to gait speed) sensitive and specific for particular signs of PD. 89 Further analyses may consider to separately process the acceleration and deceleration phases of the trial, to study initiation or locomotive propulsion and stopping mechanisms in gait, 90 which are often altered in PD, even at early stages and subtypes of the disease91,92 and may underline prodromal motor symptoms of PD. In addition, future work may focus on studying the added value of circular walking over straight walking in a dedicated comparative study of both protocols. This may also support understanding the biomechanical mechanisms involved in turning, which is already impaired in prodromal stages of PD. Impairments in turning are of relevant clinical value, given that real-world environments require continuous and frequent biomechanical gait adaptations and walking direction alterations while turning 30 and their impairment could lead to restricted mobility and independence, falls, freezing of gait and reduced quality of life in PD. 93
Dual-tasking assessment
Overall, as for our previous study on progression of PD, 53 the findings from dual-tasking protocols were largely in line with the findings from the single Walk test over a circular trajectory. In our previous study, the assessment of dual-tasking did not provide consistent additional information (relative to single Walk task) regarding progression of PD. Moreover, none of the variables obtained from dual-task walking (over straight trajectory) predicted PD conversion in a study based on the TREND data. 94 In contrast, in the current study, the assessment of dual-tasking protocols provided a larger number of associations with time-to-diagnosis of PD than single circular walking task. While variability-associated features were only found significant for W-Mark; under W-Subtract, most of the significant associations were found for harmonic ratios. Associations with risk for PD of variability features in W-Mark may be a consequence of the executive and visuospatial challenge imposed by the marking boxes task, which deviates the gaze from the walking path 39 and increases the attention demand, particularly relevant in PD given a decline in executive function, which may exacerbate the effects of dual-tasking on gait. 26 However, dual-tasking interferences in both proposed protocols (i.e., W-Mark and W-Subtract) should be further explored to assess trade-offs between concurrent task performances (e.g., mutual task interference or task prioritization). 38
Sensitivity and specificity to incident Parkinson's disease
Despite significant associations with incident PD, the sensitivity and specificity of the proposed features were too low (<0.70) to allow identification of prodromal motor impairments on an individual basis. This is reflected by low AUC values for all features and protocols, which are in the same range as previous studies using gait features as discriminative signs of patients with REM sleep behavior disorder and matched healthy controls measured in free-living environments (AUC ≈ 0.65) 87 and in supervised laboratory context (AUC ≈ 0.70). Among the selected features, the harmonic ratio of medio-lateral acceleration (from W-Subtract) presented the best trade-off between sensitivity (0.733) and specificity (0.711) and the highest AUC (0.694). The low number of incident cases did not allow testing whether multivariate models combining multiple gait features could improve sensitivity and specificity. Most of the iPD cases (10 out of 15) were diagnosed with PD more than 4 years after the baseline assessment, whereas the other 5 were diagnosed less than 4 years after baseline assessment (see Table 2). Thus, the time of assessments corresponds to a pre-diagnostic phase during which motor difficulties to walk in circles may have been too subtle 95 or not yet developed. 10 Therefore, in some cases, the baseline of assessments might correspond to a “too early” pre-diagnostic phase, even earlier than the onset of prodromal motor symptoms of PD, leading to low individual predictive value for those. Note that in a previous study, 26 based on the same cohort and longitudinal assessments of straight gait performed 4 times at 2-year intervals, step velocity and step length of the iPD cohort deviated from the HC at about 4 years prior diagnosis (3.3 years for step velocity, 4.1 years for step length). However, the AUC for each individual proposed feature was not reported, which precludes direct comparison with the currently presented results. Future analyses could explore the relationship between straight and circular gait using data from this cohort (as part of the TREND study), providing deeper insights into the various biomechanical mechanisms in prodromal stages of PD.
Low sensitivity may also result from effective compensatory mechanisms in iPD that could have preserved physiological motor functioning in early neurodegeneration stages, 96 masking prodromal motor deficits of PD. 97 In addition, the prodromal motor impairments of PD could be similar to motor patterns of neurologically intact elderly, 7 challenging their recognition and reducing specificity of the parameters. For instance, rigidity or balance impairments could also occur in other diseases different from PD. 4
After the completion of this study, 5 participants originally identified as health controls have been diagnosed with PD. Supplemental Material 2 presents the months from assessment to the diagnosis of these new 5 participants (ranging from 8 to 14 years). The results for the Cox regression models obtained when excluding these 5 participants from the HC group are presented in Supplemental Material 3, while the Cox regression models obtained when considering these new participants as part of the iPD group (i.e., adapting the model to their time-to-diagnosis) are presented in Supplemental Material 4. Results presented in Supplemental Material 3 are very similar to the results reported in Table 4, i.e., the AUC range between 0.63 and 0.69 and the same features, or their interaction with the confounding factor, reached significance in the same cases. Results presented in Supplemental Material 4 present the same statistical significance patterns as in Table 4. However, the AUC were lower in Supplemental Material 4, ranging from 0.57 to 0.64. Overall, this indicates that at the time of assessment of these 5 participants, no motor changes on circular gait may have been manifested, potentially justifying that the low AUC observed in this study may be due to the long time-to-diagnosis of some of the subjects in iPD.
Although the AUC values observed here for all proposed features and protocols were low (below 0.7) in insolation, their combination with other prodromal markers of PD such as gait markers derived from straight gait, or even signs of altered REM sleep behavior, may add in the study and definition of the prodromal phase of PD, complementing a panel of prodromal markers for the definition of persons at substantially increased risk for PD. This may be addressed with a larger sample size and a longitudinal study, 83 to better determine the characterization of circular gait during a specified time window preceding the conversion to PD. Moreover, further studies based on larger and heterogeneous (regarding “the time to diagnosis”) samples could assess the weight of the predictors for the time to conversion to better understand the onset of gait changes.
Conclusions
To our knowledge, this is the first study to quantitatively assess deficits associated to circular walking in relation to incident PD, 98 complementing studies on non-motor prodromal symptoms of PD as part of the TREND study,99–104 as well as quantitative assessment of straight gait. 26 In spite of limited predictive value at the individual level of single parameters extracted from tasks, the significant differences between iPD and control, the objectivity and simplicity of the proposed assessments and the properties of the parameters discussed here motivate, in our view, further investigation on the potential of this method (task and instrument) to contribute to the detection of persons in prodromal PD stages. 104
Supplemental Material
sj-xlsx-2-pkn-10.1177_1877718X241306141 - Supplemental material for Predictive potential of circular walking in prodromal Parkinson's disease
Supplemental material, sj-xlsx-2-pkn-10.1177_1877718X241306141 for Predictive potential of circular walking in prodromal Parkinson's disease by M Encarna Micó-Amigo, Idsart Kingma, Sebastian Heinzel, Susanne Solbrig, Markus A Hobert, Morad Elshehabi, Kathrin Brockmann, Florian G Metzger, Rob C van Lummel, Daniela Berg, Walter Maetzler and Jaap H van Dieën in Journal of Parkinson's Disease
Supplemental Material
sj-xlsx-3-pkn-10.1177_1877718X241306141 - Supplemental material for Predictive potential of circular walking in prodromal Parkinson's disease
Supplemental material, sj-xlsx-3-pkn-10.1177_1877718X241306141 for Predictive potential of circular walking in prodromal Parkinson's disease by M Encarna Micó-Amigo, Idsart Kingma, Sebastian Heinzel, Susanne Solbrig, Markus A Hobert, Morad Elshehabi, Kathrin Brockmann, Florian G Metzger, Rob C van Lummel, Daniela Berg, Walter Maetzler and Jaap H van Dieën in Journal of Parkinson's Disease
Supplemental Material
sj-xlsx-4-pkn-10.1177_1877718X241306141 - Supplemental material for Predictive potential of circular walking in prodromal Parkinson's disease
Supplemental material, sj-xlsx-4-pkn-10.1177_1877718X241306141 for Predictive potential of circular walking in prodromal Parkinson's disease by M Encarna Micó-Amigo, Idsart Kingma, Sebastian Heinzel, Susanne Solbrig, Markus A Hobert, Morad Elshehabi, Kathrin Brockmann, Florian G Metzger, Rob C van Lummel, Daniela Berg, Walter Maetzler and Jaap H van Dieën in Journal of Parkinson's Disease
Supplemental Material
sj-xlsx-5-pkn-10.1177_1877718X241306141 - Supplemental material for Predictive potential of circular walking in prodromal Parkinson's disease
Supplemental material, sj-xlsx-5-pkn-10.1177_1877718X241306141 for Predictive potential of circular walking in prodromal Parkinson's disease by M Encarna Micó-Amigo, Idsart Kingma, Sebastian Heinzel, Susanne Solbrig, Markus A Hobert, Morad Elshehabi, Kathrin Brockmann, Florian G Metzger, Rob C van Lummel, Daniela Berg, Walter Maetzler and Jaap H van Dieën in Journal of Parkinson's Disease
Footnotes
Acknowledgments
We thank all the participants of this study for their contribution. In addition, we thank Dr. Brook Galna and Dr. Miguel Ángel González-Belmonte for their advice on the statistical analysis and Dr. Ulrike Sünkel for her help on the provision of the clinical information. We want to particularly appreciate the support, motivation and enthusiasm from Dr Rob C. van Lummel in life.
ORCID iDs
Funding
The author(s) disclosed receipt of the following financial support for the research, authorship, and/or publication of this article: On behalf of all authors the corresponding author states that the TREND study was granted by the Center of Integrative Neurosciences Hertie-Institute for Clinical Brain Research, TEVA Pharma GmbH, UCB Pharma and by the German Center for Neurodegenerative Diseases. Moreover, this work was supported by the Moving Beyond Industrial Academic Training Network, funded through the European Community's Seventh Framework Program, Marie Curie Actions FP7/2012 (grant agreement No. 316639). The funders were not involved in study design, data collection and analysis, decision to publish and preparation of the manuscript.
Declaration of conflicting interests
The author(s) declared the following potential conflicts of interest with respect to the research, authorship, and/or publication of this article: McRoberts B.V. Company is the manufacturer of the DynaPort Hybrid sensor that was used in this study. Rob C. van Lummel was the founder and owner of McRoberts B.V. and was involved in the design of the experimental approach and in revising the manuscript. He was not involved in the development of the method, nor in the interpretation of data.
Data availability
The data supporting the findings of this study are available on request from the corresponding author. The data is not publicly available due to privacy or ethical restrictions.
Supplemental material
Supplemental material for this article is available online.
References
Supplementary Material
Please find the following supplemental material available below.
For Open Access articles published under a Creative Commons License, all supplemental material carries the same license as the article it is associated with.
For non-Open Access articles published, all supplemental material carries a non-exclusive license, and permission requests for re-use of supplemental material or any part of supplemental material shall be sent directly to the copyright owner as specified in the copyright notice associated with the article.