
Abstract
Smart farming systems, while enhancing agricultural productivity, are increasingly vulnerable to cyber threats due to their reliance on interconnected devices and networks. However, existing Intrusion Detection Systems (IDS) often suffer from high computational costs and suboptimal detection accuracy due to irrelevant features. To address this challenge, this study proposes a novel hybrid filter-based feature selection method designed to optimize feature selection for artificial neural network (ANN)-based IDS in smart farming environments. Unlike conventional methods that rely solely on chi-square, mutual information, or mean absolute deviation, the proposed method combines these techniques to leverage their complementary strengths. Furthermore, a comprehensive smart farming system was established to collect extensive data, creating a dedicated dataset named Smart-Farm-IDS for binary classification, distinguishing between normal operations and anomalies. Both shallow and deep ANN models were employed to detect these anomalies, with their performances compared in detail. Experimental results demonstrate that the proposed hybrid feature selection method enhances detection accuracy while reducing computational overhead compared to existing methods. This study offers a robust approach for improving the security and resilience of smart farming systems, providing a foundation for more secure agricultural operations.
Keywords
Introduction
Smart farming systems have revolutionized modern agriculture in terms of productivity, sustainability, and efficiency by integrating advanced technologies such as the Internet of Things (IoT), sensors, and automated control systems (Dagar et al. 2018; Doshi et al., 2019). However, the increasing complexity, interconnectedness, and internet-connected operation for remote control of these digital ecosystems make smart farming systems vulnerable to various cyber threats (Farooq et al., 2019; Wei et al., 2024). Cyberattacks targeting these systems can cause significant disruptions, data breaches, and even physical damage to critical agricultural infrastructure. Therefore, protecting the security and integrity of smart farming systems has become a crucial priority for both researchers and practitioners.
Intrusion detection has been extensively studied in the context of computer networks, with numerous approaches proposed to enhance detection accuracy and efficiency, mitigating potential cyber threats in smart systems. For instance, support vector machine (SVM) models optimized using particle swarm optimization (PSO) have demonstrated improved attack detection, especially when combined with feature selection methods like chi-square (CS) (Upendran and Gopinath, 2020). Other studies have highlighted the challenges of detecting network attacks due to the evolving nature of threats and the need for large datasets. To address these, AdaBoost-based decision tree models have been employed, leveraging correlation-based feature selection to enhance detection performance (Ahmad et al., 2022). Deep neural network (DNN)-based models have also been explored, using XGBoost for feature selection to boost classification accuracy, outperforming traditional methods such as Logistic Regression and SVM (Devan and Khare, 2020). Random forest-based systems have further improved classification by maintaining multiclass attack categories and applying feature selection through correlation coefficients (Iwendi et al., 2020). Finally, advanced methods like long short-term memory (LSTM)-based models, employing principal component analysis (PCA) for feature engineering, have shown superior results for both binary and multiclass classifications (Laghrissi et al., 2021). These studies collectively highlight the ongoing advancements in intrusion detection for computer networks.
In the realm of IoT networks, intrusion detection has gained significant attention due to the widespread deployment of IoT devices across various sectors. To enhance detection performance, various machine learning and optimization techniques have been explored. For instance, one study demonstrated the use of multiple machine-learning algorithms, including artificial neural network (ANN), Random Forest, and SVM, for attack detection, with SVM achieving the highest accuracy (Sajja et al., 2021). Moreover, tree-based models such as XGBoost and Classification and Regression Trees have shown an optimal balance of accuracy and response time for detecting Denial-of-Service (DoS) attacks in IoT networks (Verma and Ranga, 2020). Additionally, intrusion detection for industrial IoT has also been addressed using XGBoost, achieving high performance on imbalanced datasets (Le et al., 2022). Furthermore, Firefly algorithm has been employed to optimize the parameters of the XGBoost classifier, significantly improving classification accuracy compared to standard optimization methods (Zivkovic et al., 2022). Finally, feature extraction techniques, including Autoencoders, Deep Autoencoders, and Stacked Autoencoders, have further enhanced Intrusion Detection Systems (IDSs), with Deep Autoencoders providing superior results in a DNN-based model (Kunang et al., 2021). These studies collectively highlight the advancements in intrusion detection for IoT networks.
As the focus shifts from general computer networks and IoT environments to the more specialized domain of smart farming, intrusion detection faces unique challenges. In smart farming systems, where IoT devices are widely used for monitoring and automation, the security of both the network and physical layers becomes critical. Several studies have explored intrusion detection specifically tailored to the unique characteristics of smart farming networks. For instance, an IDS designed for agricultural IoT networks demonstrated effective binary attack classification using SVM, Random Forest, and Logistic Regression, with SVM achieving the highest accuracy (Raghuvanshi et al., 2022). Another study compared deep learning techniques, including convolutional neural network (CNN), DNN, and recurrent neural networks (RNNs), with CNN achieving superior performance (Attack et al. 2021). Another framework combined CNN with transfer learning and utilized the Black Kite Algorithm (BKA) for hyperparameter optimization, with extremely randomized trees (ET) used for feature extraction (Zhou et al., 2025). Additionally, CNN-based model optimized with the wild horse optimization (WHO) algorithm effectively detected Distributed DoS attacks in smart farming networks, with bi-gated recurrent unit (Bi-GRU) employed for dimensionality reduction (Kethineni and Pradeepini, 2024). These studies collectively demonstrate the adaptation of diverse machine learning techniques to enhance the security of smart farming systems.
As detailed in Section 2, many existing intrusion detection studies rely heavily on a limited set of publicly available datasets and primarily focus on network-layer attacks. Although numerous solutions have been developed to mitigate cyberattacks in smart farming networks, challenges remain, particularly in handling high-dimensional feature spaces and computational overhead. In smart farming systems, it is essential to detect anomalies and cyberattacks both quickly and accurately (Javeed et al., 2024). Feature selection plays a vital role in accelerating detection tasks by reducing the number of input features, thereby simplifying the model architecture and improving performance (Kwak and Choi, 2002; Shivhare and (Nigam) Saxena, 2021). Consequently, feature selection is a critical step in the development of effective IDSs. In this study, a hybrid feature selection method is proposed for an ANN-based IDS to identify cyberattacks and anomalies in smart farming environments. Additionally, a comprehensive smart farming testbed was established, and data were collected from realistic scenarios to create a domain-specific dataset named Smart-Farm-IDS: Smart Farming Intrusion Detection System Dataset. This dataset supports binary classification, distinguishing between normal behavior and potential anomalies or attacks. Unlike publicly available datasets, Smart-Farm-IDS dataset focuses on the physical layer security of agricultural systems rather than being network-based, where sensor tampering, signal interference, unauthorized sensor manipulation, or spoofing can severely impact crop production and system operations. Both shallow and deep ANN models were employed to perform detection, and their performance was compared to determine the most effective model. The proposed hybrid feature selection technique integrates the strengths of multiple existing methods, including CS, mutual information (MI), and MAD, to enhance detection speed and efficiency. The findings aim to strengthen the security and resilience of smart farming systems. The main contributions of this research are as follows:
Proposed a hybrid feature selection method that leverages the strengths of existing methods such as CS, MI, and MAD for an ANN-based IDS to enhance the anomaly detection time performance of the model in smart farming systems. Designed and implemented a comprehensive smart farming system and collected extensive data under realistic operational scenarios to create a domain-specific dataset. Created a binary classification dataset named Smart-Farm-IDS with 15 features and 172,800 data samples, distinguishing between normal operations and potential cyberattacks or anomalies, with a focus on the physical layer security of smart farming systems. Implemented and compared both shallow and deep ANN models to identify cyberattacks and anomalies, systematically analyzing the effects of hybrid feature selection methods on both models.
The rest of this paper is organized as follows: Section 2 outlines the related works. Section 3 covers the setup of the smart farming system, data collection, and dataset creation processes. Section 4 represents the data preprocessing procedures. Section 5 summarizes the methodology of the shallow and deep ANN models developed for anomaly detection and outlines the proposed hybrid feature selection method along with existing feature selection methods. Section 6 provides the experimental results and analysis of the classification performance of shallow and deep ANN models using the proposed feature selection approaches. Finally, Section 7 includes a summary of the findings and directions for future research in the conclusion.
Related work
Numerous IDSs which are summarized in Table 1 have recently been developed to enhance the security of smart farming systems. These IDSs are designed to detect binary attacks, multiclass attacks, or both. For example, Raghuvanshi et al. (2022) proposed an IDS for classifying binary attacks on IoT networks in agricultural environments, evaluated using the NSL-KDD dataset. The system applied preprocessing steps such as converting categorical features to numerical values and feature extraction via PCA, followed by classification using SVM, Random Forest, and Logistic Regression. Among these, the SVM model achieved the highest accuracy of over 98%, while the others performed below 78%. Similarly, El-Ghamry et al. (2023) developed an IDS using deep learning techniques, also based on the NSL-KDD dataset. Feature selection was conducted using recursive feature elimination (RFE), and selected features were transformed into square-shaped color images to suit CNN architectures. Among the tested CNN models such as VGG16, Inception, and Xception, the VGG16 demonstrated superior performance. Mohy-eddine et al. (2024) introduced an IDS using a radial basis function neural network (RBFNN) to detect network intrusions in smart farming systems. Feature selection was optimized using machine learning techniques such as LightGBM, Random Forest, AdaBoost, XGBoost, and Extra Trees, while outlier detection employed a one-class SVM. The system was validated on the NF-ToN-IoT and NF-Bot-IoT datasets, achieving 99.25% accuracy with an 82.97% Matthews correlation coefficient (MCC), and 96.92% accuracy with a 90.05% MCC, respectively. Furthermore, Prakash et al. (2025) proposed an improved multiview graph convolutional network (IMGCN) for intrusion detection in IoT-based smart farming. Their method used data from the NF-Bot-IoT dataset, addressed class imbalance with the synthetic minority over-sampling technique, and applied RFE in the feature selection step to remove noisy or irrelevant data. The IMGCN model achieved superior results compared to a traditional multilayer perceptron, with 93.25% accuracy, 92.23% precision, and a 91.78% F1-score.
Summary of the related works for intrusion detection systems targeting smart farming systems.
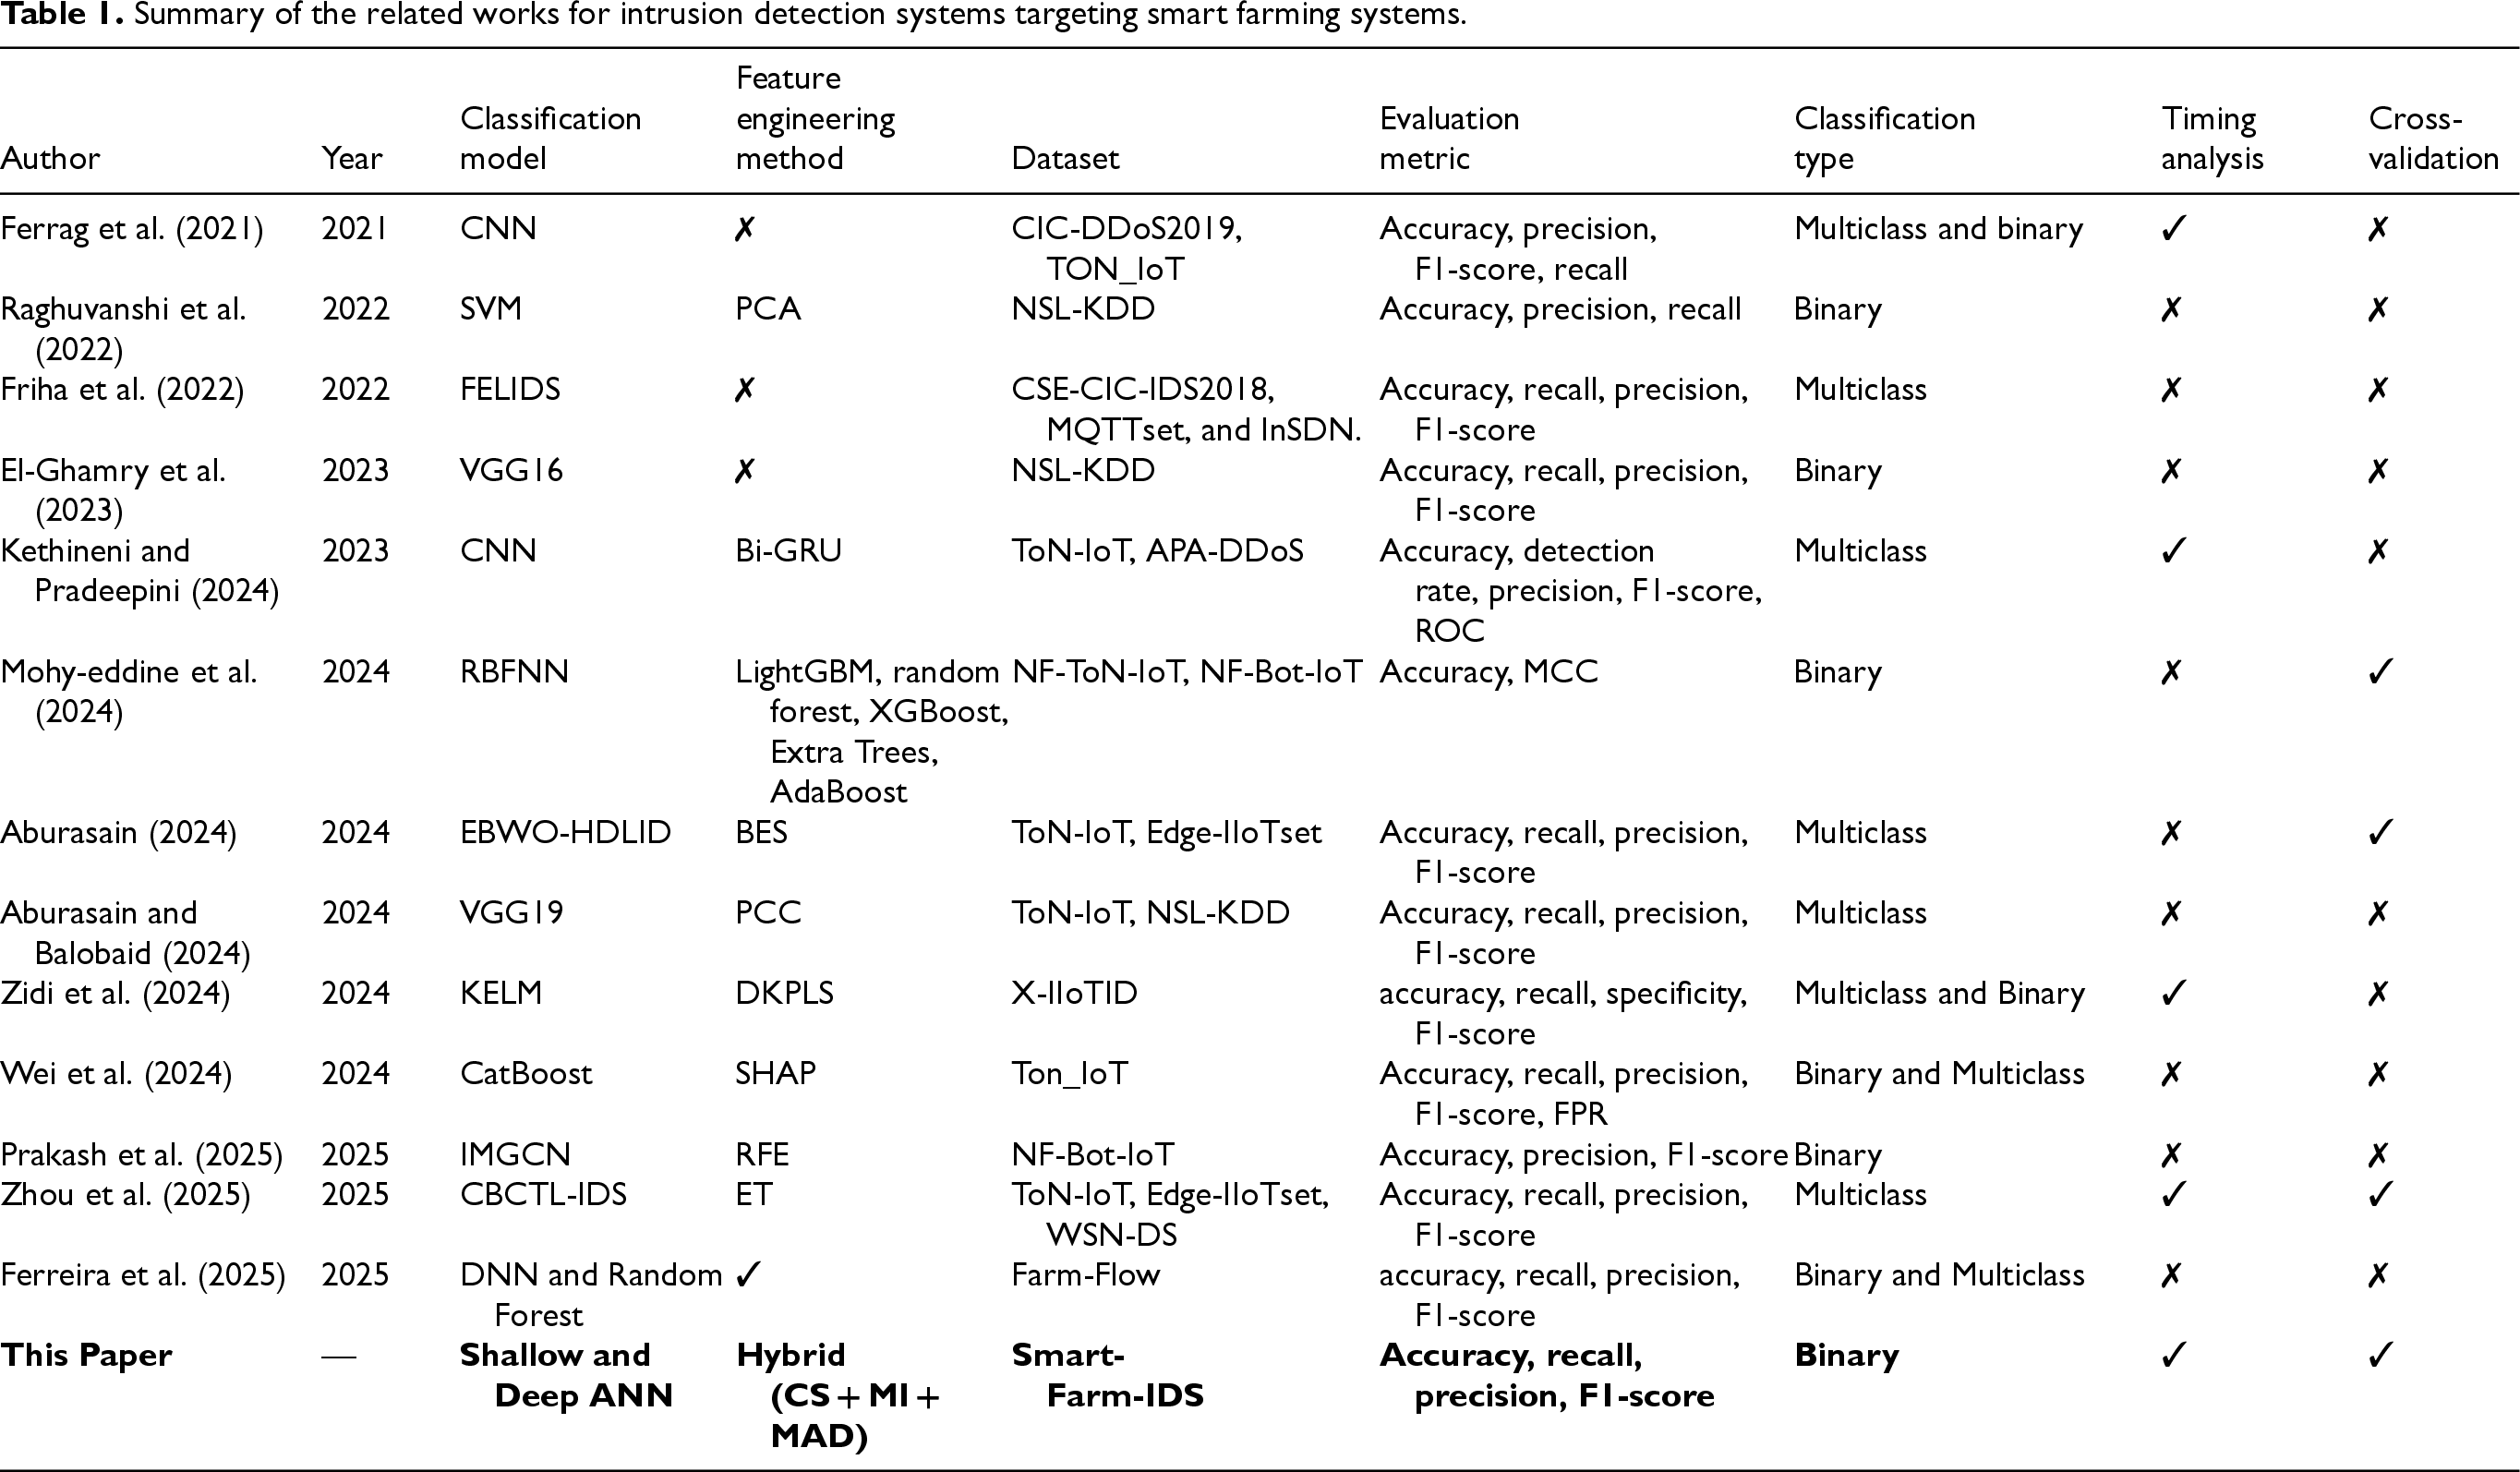
Summary of the related works for intrusion detection systems targeting smart farming systems.
In addition to binary attack detection, several IDSs have been developed specifically for multiclass attack detection in smart farming environments. For instance, Friha et al. (2022) introduced FELIDS, a federated learning-based IDS aimed at enhancing the security of agricultural IoT infrastructures while preserving data privacy. FELIDS trains deep learning models, including DNN, CNN, and RNN, locally on devices, sharing only model updates with a central server for aggregation. Evaluated on the CSE-CIC-IDS2018, MQTTset, and InSDN datasets, FELIDS outperformed traditional centralized approaches in terms of both detection accuracy and privacy preservation. Similarly, Kethineni and Pradeepini (2024) proposed an IDS for detecting Distributed DoS attacks in smart farming networks. The system preprocesses data using normalization and label encoding, followed by dimensionality reduction using a Bi-GRU. A CNN model then classifies the attacks, and its accuracy is further enhanced by the WHO algorithm which is a metaheuristic inspired by the social behavior of wild horses. This model achieved 99.35% accuracy on the APA-DDoS-Attack dataset and 99.71% on the ToN-IoT dataset. Additionally, Aburasain (2024) proposed the EBWO-HDLID method, which integrates enhanced black widow optimization (EBWO) with a hybrid deep learning classification model for intrusion detection in IoT-enabled smart farming. The system uses the bald eagle search (BES) algorithm for feature selection and EBWO for tuning the hybrid model's parameters. Experimental results on the ToN-IoT and Edge-IIoTset datasets demonstrated strong performance in detecting various types of intrusions, highlighting the method's effectiveness in securing smart agricultural systems.
Other recent studies have also focused on multiclass intrusion detection in smart farming systems. For instance, Aburasain and Balobaid (2024) proposed a hybrid deep learning-enabled IDS with PSO tailored for IoT-based agriculture. This system incorporates preprocessing and feature selection, followed by classification using a hybrid deep learning model based on VGG19 and transfer learning. PSO is employed to fine-tune the model's hyperparameters. The approach was validated using the ToN-IoT and NSL-KDD datasets, demonstrating high accuracy in detecting diverse cyber threats. Similarly, Zhou et al. (2025) introduced CBCTL-IDS, a novel IDS that integrates CNN with transfer learning and BKA for hyperparameter optimization. The system also includes a confidence averaging mechanism to improve prediction robustness and uses ET for feature extraction. Evaluations conducted on the ToN-IoT, Edge-IIoTset, and WSN-DS datasets revealed that CBCTL-IDS consistently achieved detection accuracies above 99%, outperforming conventional methods.
Several studies have addressed IDSs capable of handling both binary and multiclass classification in smart agriculture. In one of these studies, Ferrag et al. (2021) conducted a comparative analysis of deep learning techniques, including CNN, DNN, and RNN, using the CIC-DDoS2019 and ToN-IoT datasets. Their results showed that the CNN-based IDS outperformed other models in both classification types. Similarly, Zidi et al. (2024) proposed a kernel extreme learning machine (KELM)-based IDS architecture to safeguard IoT networks in smart farming. Their two-phase model first used the downsized kernel partial least squares (DKPLS) algorithm for feature extraction and dimensionality reduction, followed by classification with KELM. The approach achieved high performance on the X-IIoTID dataset. In another study, Wei et al. (2024) introduced a CatBoost-based IDS, targeting the physical layer of smart agriculture. Evaluated on the ToN-IoT dataset, the model achieved outstanding binary classification results with 99.94% accuracy, 99.88% precision, and 99.88% recall, and it also outperformed other models in multiclass detection. Additionally, Ferreira et al. (2025) developed a custom IDS for agricultural IoT environments, supported by a newly created dataset named Farm-Flow. This dataset included over one million instances and eight types of attacks. Evaluation results showed that the DNN model performed best in binary classification, while the random forest model excelled in multiclass classification.
Despite the significant progress in IDSs for smart agriculture, several key challenges remain unaddressed. A major limitation across many existing studies is the heavy reliance on a small number of publicly available datasets, such as NSL-KDD, ToN-IoT, and NF-Bot-IoT. These datasets, while useful, often lack the specificity, diversity, and realism needed to fully reflect the complexities of real-world agricultural environments, leading to potential issues with model generalization and practical deployment. Furthermore, most works focus on detecting network-layer attacks, while fewer explore the physical layer security of agricultural systems, where sensor tampering or spoofing can severely impact crop production and system operations. Additionally, some IDS models depend heavily on computationally intensive deep learning techniques, which may not be suitable for deployment on resource-constrained edge devices commonly used in smart farming. To address these gaps, this work introduces a new, domain-specific smart farming dataset that better captures the intricacies of physical-layer attacks in agricultural settings and proposes a lightweight detection system suitable for deployment on resource-constrained edge devices.
A comprehensive dataset is essential for the development of an effective ANN binary classification model which is capable of anomaly and cyberattack detection in real-time (Prasad et al. 2019; Saabith, 2014). This dataset includes a variety of sensor data from the smart farming system and offers valuable insights into both normal operations and possible anomalies such as cyberattacks, sensor malfunctions, or environmental disturbances. Detailed recording of sensor readings, rigorous preprocessing, and labeling processes ensure that the dataset is suitable for training ANN models aimed at enhancing the safety and reliability of smart farming systems (Sayyad et al., 2021).
In this study, a smart farming system was first established within a controlled laboratory environment to create a dedicated dataset named Smart-Farm-IDS: Smart Farming Intrusion Detection System Dataset. Although the system was set up in a laboratory, it was carefully designed to operate under realistic environmental conditions, ensuring that the collected data accurately reflects real-world scenarios. This setup allowed for precise control over system parameters, enabling systematic data collection over a defined period while maintaining data authenticity. Despite not being a commercially deployed or long-term installation, the system effectively simulated various real-world conditions, including sensor tampering, signal interference, unauthorized sensor manipulation, and spoofing. These simulated scenarios provide a comprehensive representation of potential security threats in smart farming, making the Smart-Farm-IDS dataset highly relevant for intrusion detection research.
The established smart farming system consists of three main parts: the irrigation system, the condition monitoring system, and the central system. The overall structure of the established smart farming system is shown in Figure 1.
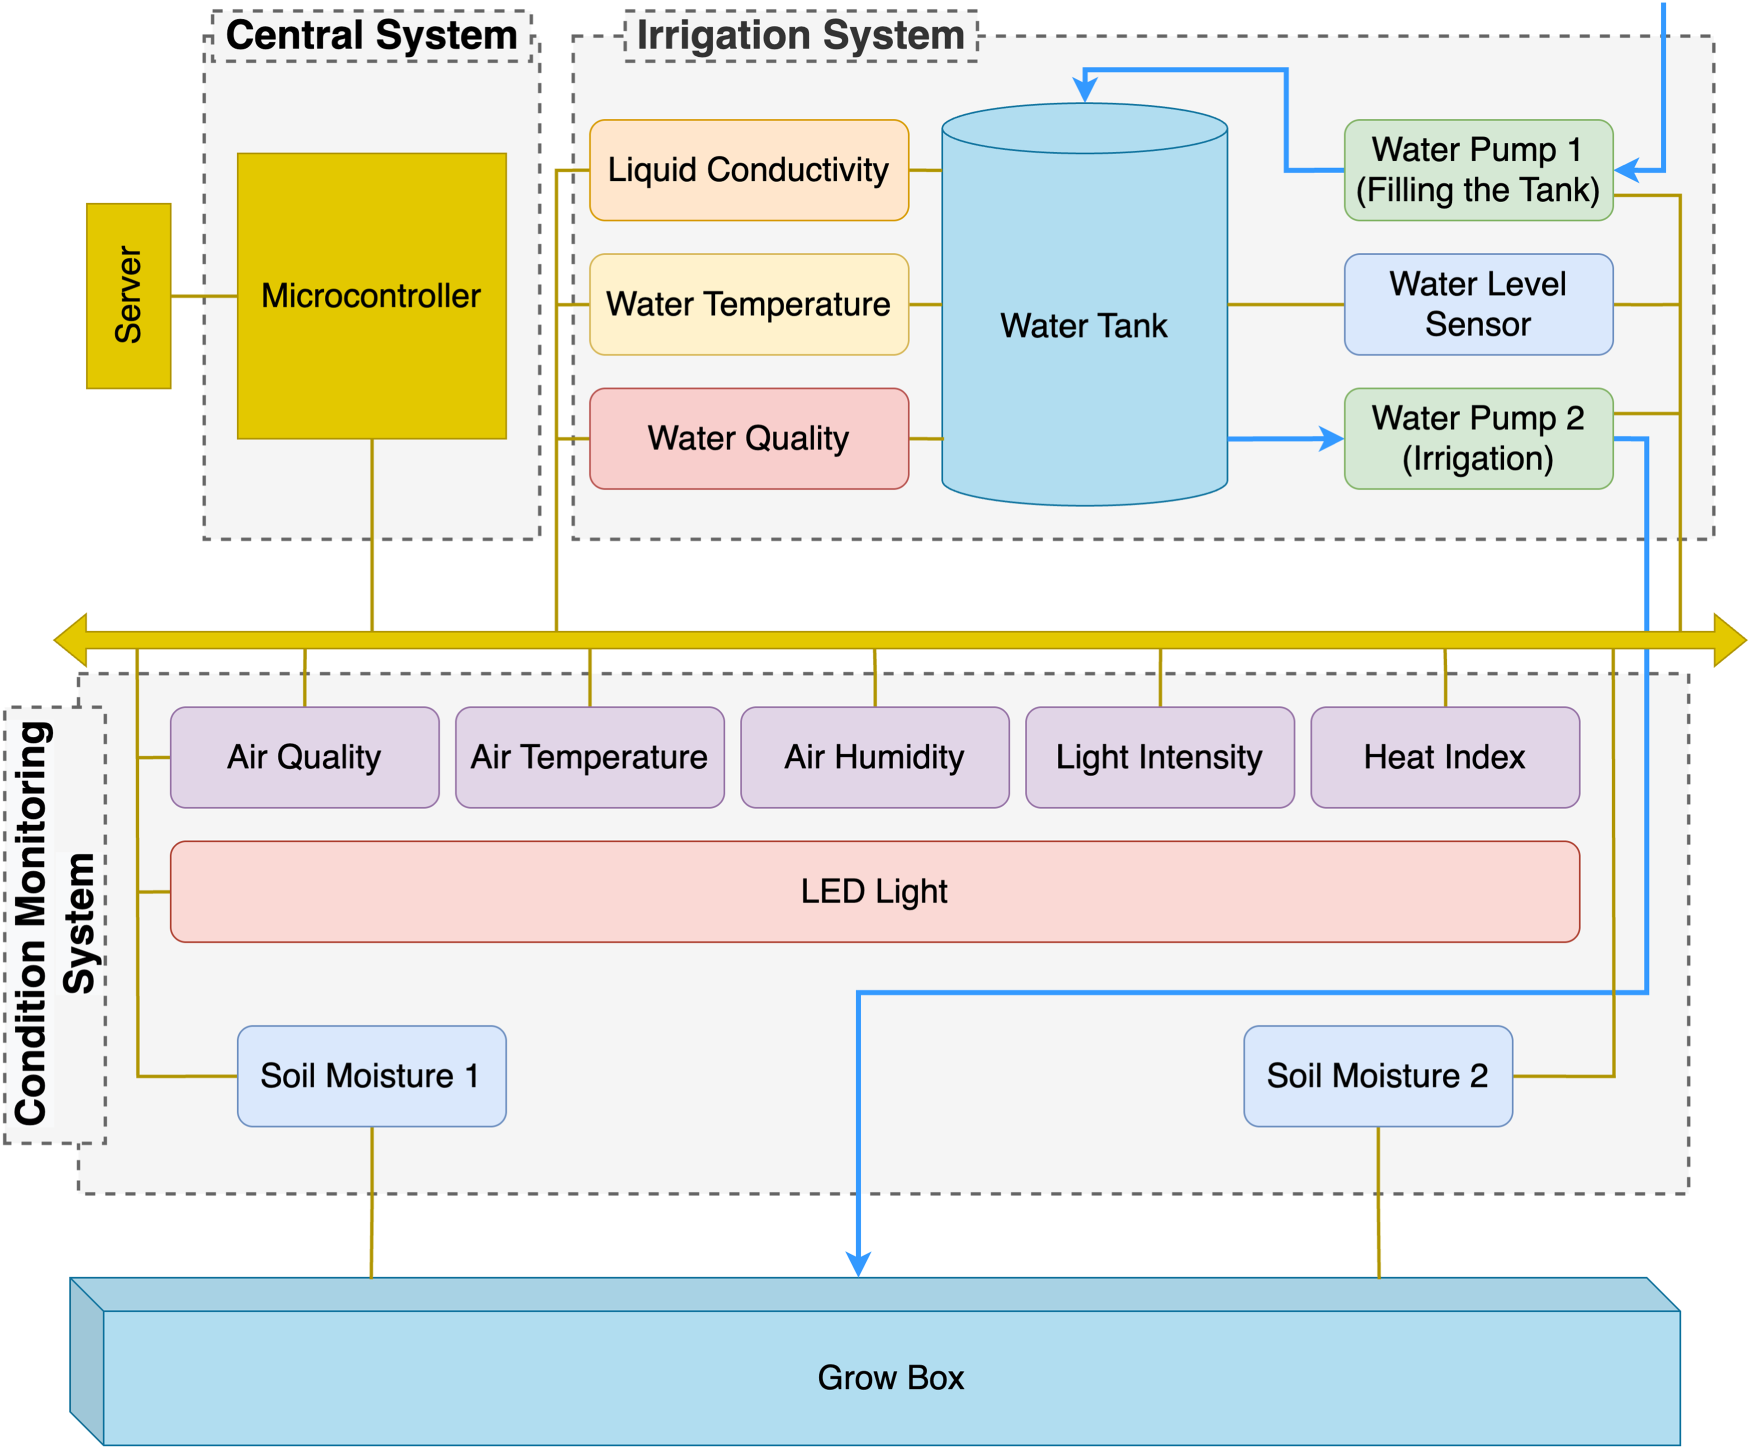
Overall structure of the established smart farming system.
The components used in the system, the sensors and the specific parameters measured by these sensors are explained in detail below.
The irrigation system satisfies the water needs of the plants. This system includes the following components and sensors:
Condition monitoring system
The condition monitoring system provides monitoring of the environmental conditions necessary for the optimal growth of plants. This system includes the following components and sensors:
Central system
The central system consists of a microcontroller. All sensors are connected to this microcontroller unit. Once the sensor data is collected here, it is sent to a server for remote control and monitoring.
The Smart-Farm-IDS dataset were collected and recorded from the sensors of the established smart farming system at one-second intervals for 48 h (from 14.6.2024 02:00:00 to 16.6.2024 01:59:59). These sensor readings constitute each feature of the dataset. In addition, each sensor reading is timestamped, as maintaining the chronological order of events is important for identifying anomalies and potential cyberattacks. Finally, the collected data was processed by labeling each data point as normal or abnormal based on predefined criteria. Abnormal data points include sensor failures or potential cyberattacks, while normal data points include regular operational data that contains no signs of anomalies or attacks.
Table 2 shows a few examples from the obtained Smart-Farm-IDS dataset. This dataset consists of a total of 15 features, including a timestamp, and 172,800 samples. Of these samples, 16,548 contain abnormal conditions, while the rest represent normal conditions. This corresponds to approximately 9.57% of the total data.
Representative examples from the Smart-Farm-IDS dataset.
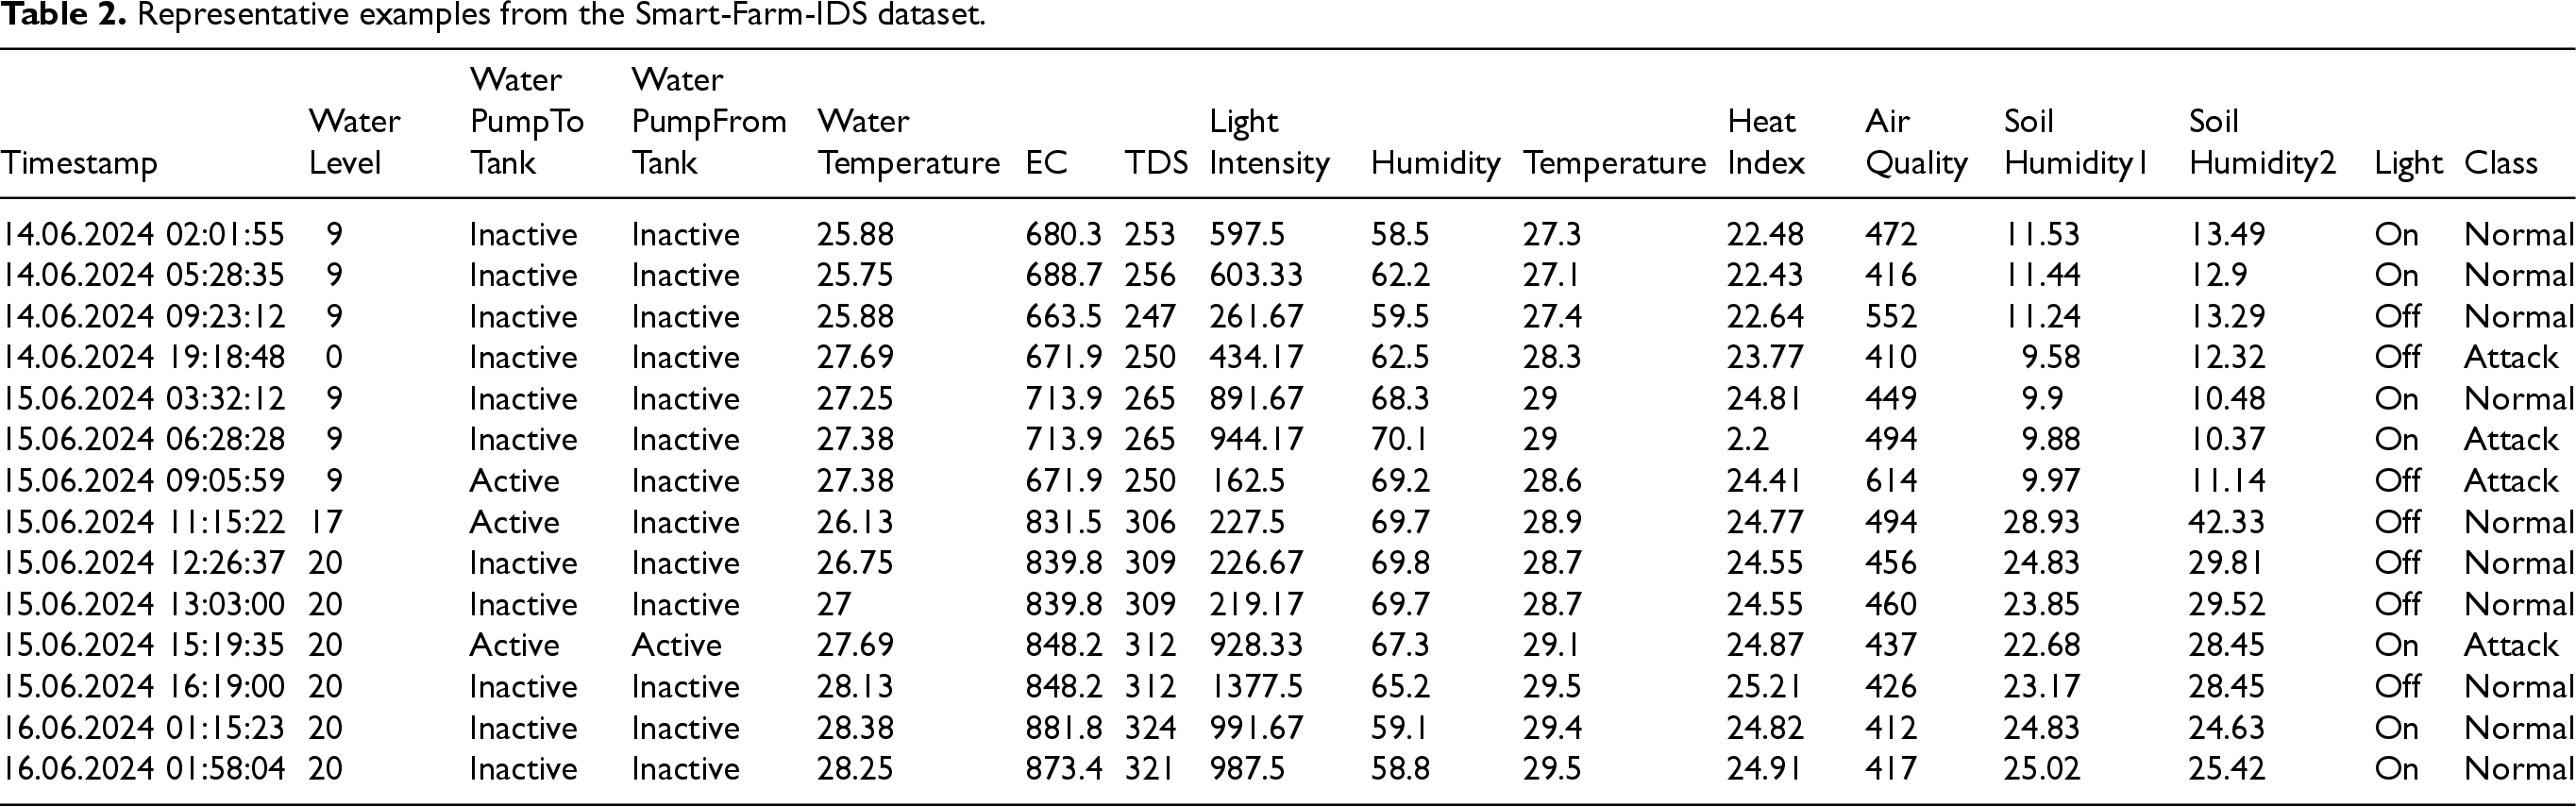
Representative examples from the Smart-Farm-IDS dataset.
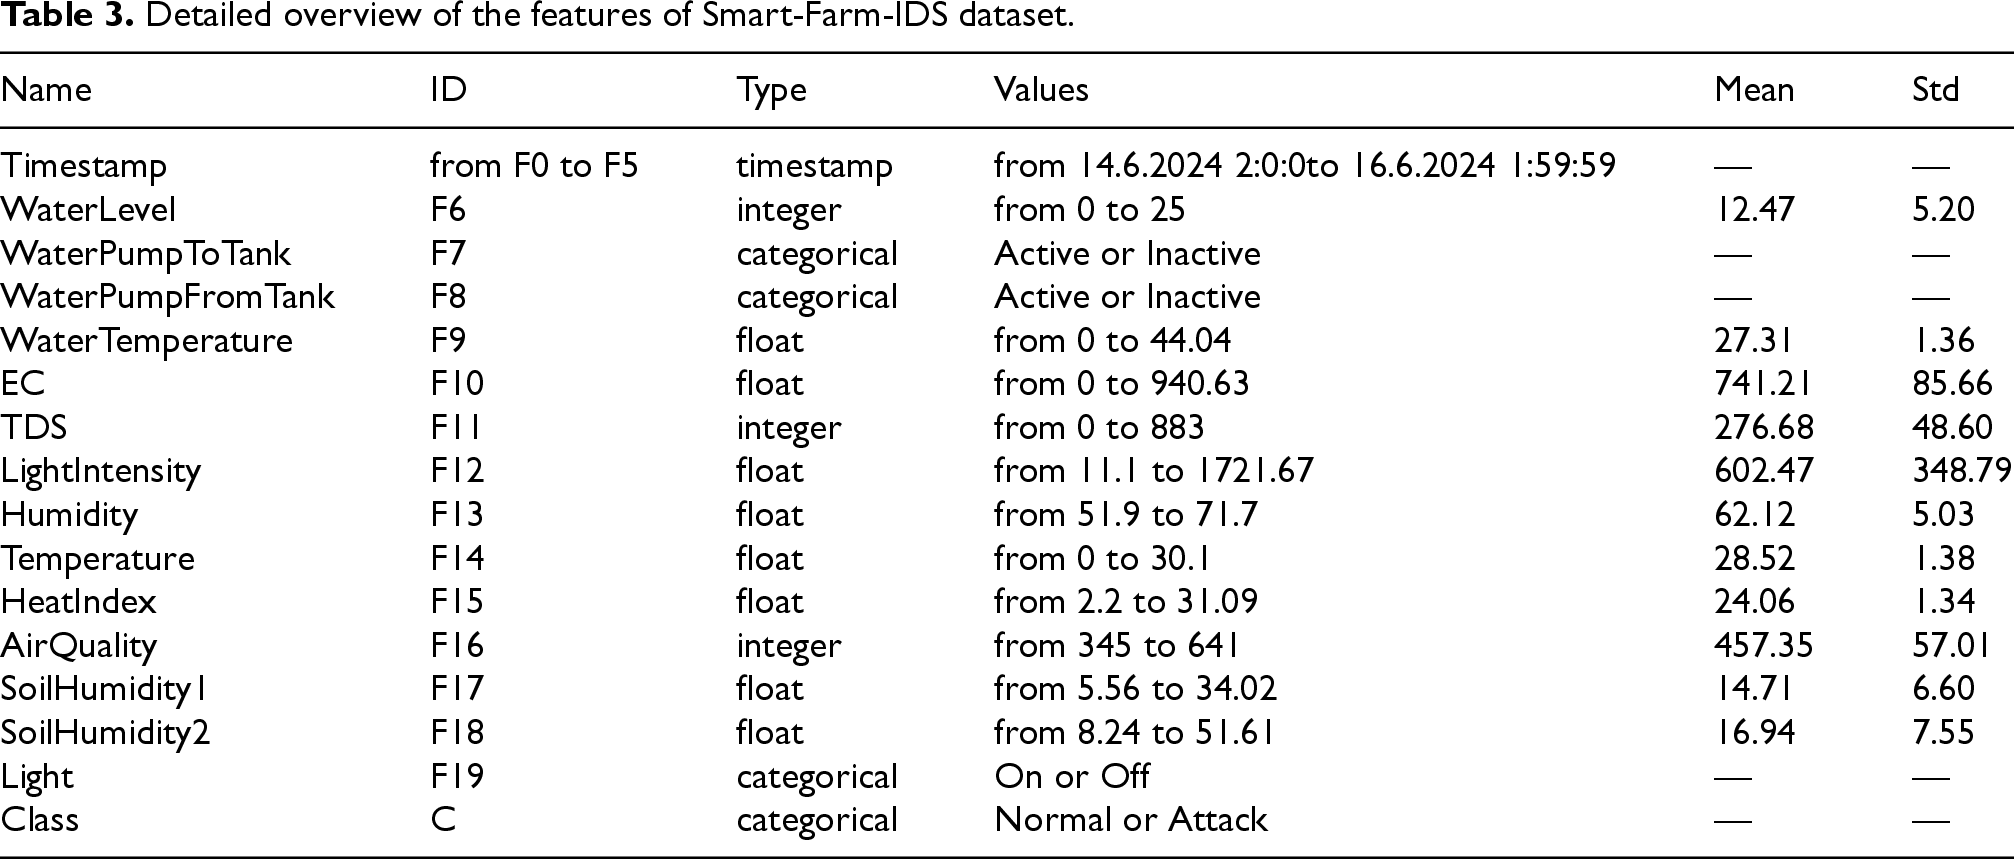
Table 3 provides a detailed overview of the features in the dataset. It describes each feature in the dataset with its type, range of values, and statistical measures such as standard deviation and mean. The features are labeled F0 through F19. The timestamp is divided into six different features as day (F0), month (F1), year (F2), hour (F3), minute (F4), and second (F5), which is outlined in Section 4.
Detailed overview of the features of Smart-Farm-IDS dataset.
Data preprocessing is the process of transforming and cleaning the raw data to make it suitable for analysis or modeling. This process includes steps such as filling in or removing missing data, handling outliers, performing data type conversions, encoding categorical data, and feature scaling (Fan et al., 2021; Gawhade et al. 2022). However, the Smart-Farm-IDS dataset used in this study presented specific domain characteristics that necessitated specialized preprocessing techniques.
In the first step, the timestamp feature was decomposed into six distinct features: day, month, year, hour, minute, and second. This decomposition was essential for accurately capturing temporal patterns specific to smart farming operations, where system behavior can vary significantly across different times of the day or seasons. By treating these time components as separate features, the model could better identify potential temporal patterns related to normal or anomalous activities.
For the classification process with ANN, categorical values need to be converted into a numerical format (Potdar et al., 2017). It can be accomplished by using a Label Encoder (LB) method, which assigns a unique integer to each category of a categorical feature. For example, if a categorical feature has values such as “inactive”, and “active”, the LB converts these values to 0, and 1, respectively. This is important step because categorical data cannot be directly handled by ANNs; they can only handle numerical inputs. Categorical values are converted into numerical labels, which makes the data ready for further processing and ANN model training. In this study, the categorical data such as the states of water pumps (inactive/active), the LED light (on/off), and the target (normal/attack) in the obtained dataset were converted into numerical values using LB. This transformation was not only necessary because ANNs can only process numerical data, but it was also crucial for maintaining the logical relationships between categories, ensuring that the ANN model could effectively distinguish between these states during training.
Furthermore, the dataset's diverse range of feature distributions posed an additional challenge. Once the label coding of categorical features is done, normalizing the data is a preprocess used to improve the performance of the ANN (Nawi et al., 2013). Normalization is typically performed using a standard scaler (SS), which sets the mean of features to zero and the standard deviation to one. This process, known as standardization, brings all features to the same scale, avoiding any single feature from dominating the learning process due to its magnitude. For each feature, SS converts each data point in the feature by subtracting it from the mean and dividing it by the standard deviation. Normalizing the data not only accelerates the convergence rate during training but also improves the accuracy and robustness of the ANN (Singh and Singh, Dec. 2020). Therefore, each feature (F0 to F19) of the Smart-Farm-IDS dataset was normalized using the SS method. The resulting distributions of the normalized features are presented in Figure 2. As clearly shown, this process centers the features around a mean of zero and a standard deviation of one, ensuring that no single feature disproportionately influences the learning process of ANN model. The dataset exhibits various distribution patterns across its features. Features F1, F2, F3, F4, and F5 display nearly uniform distributions, indicating that their values are evenly spread within a specific range. In contrast, features F6, F7, and F8 show distinct peaks, suggesting categorical or discrete values. Features F12, F13, F16, and F17 are characterized by multimodal distributions, with multiple peaks suggesting that the data may originate from several distinct underlying distributions. Finally, feature F19 is highly concentrated around two points, indicating a binary nature. These varying distributions highlight the diverse nature of the features within the Smart-Farm-IDS dataset, reflecting different types of data, which is common in IDSs for smart farming.
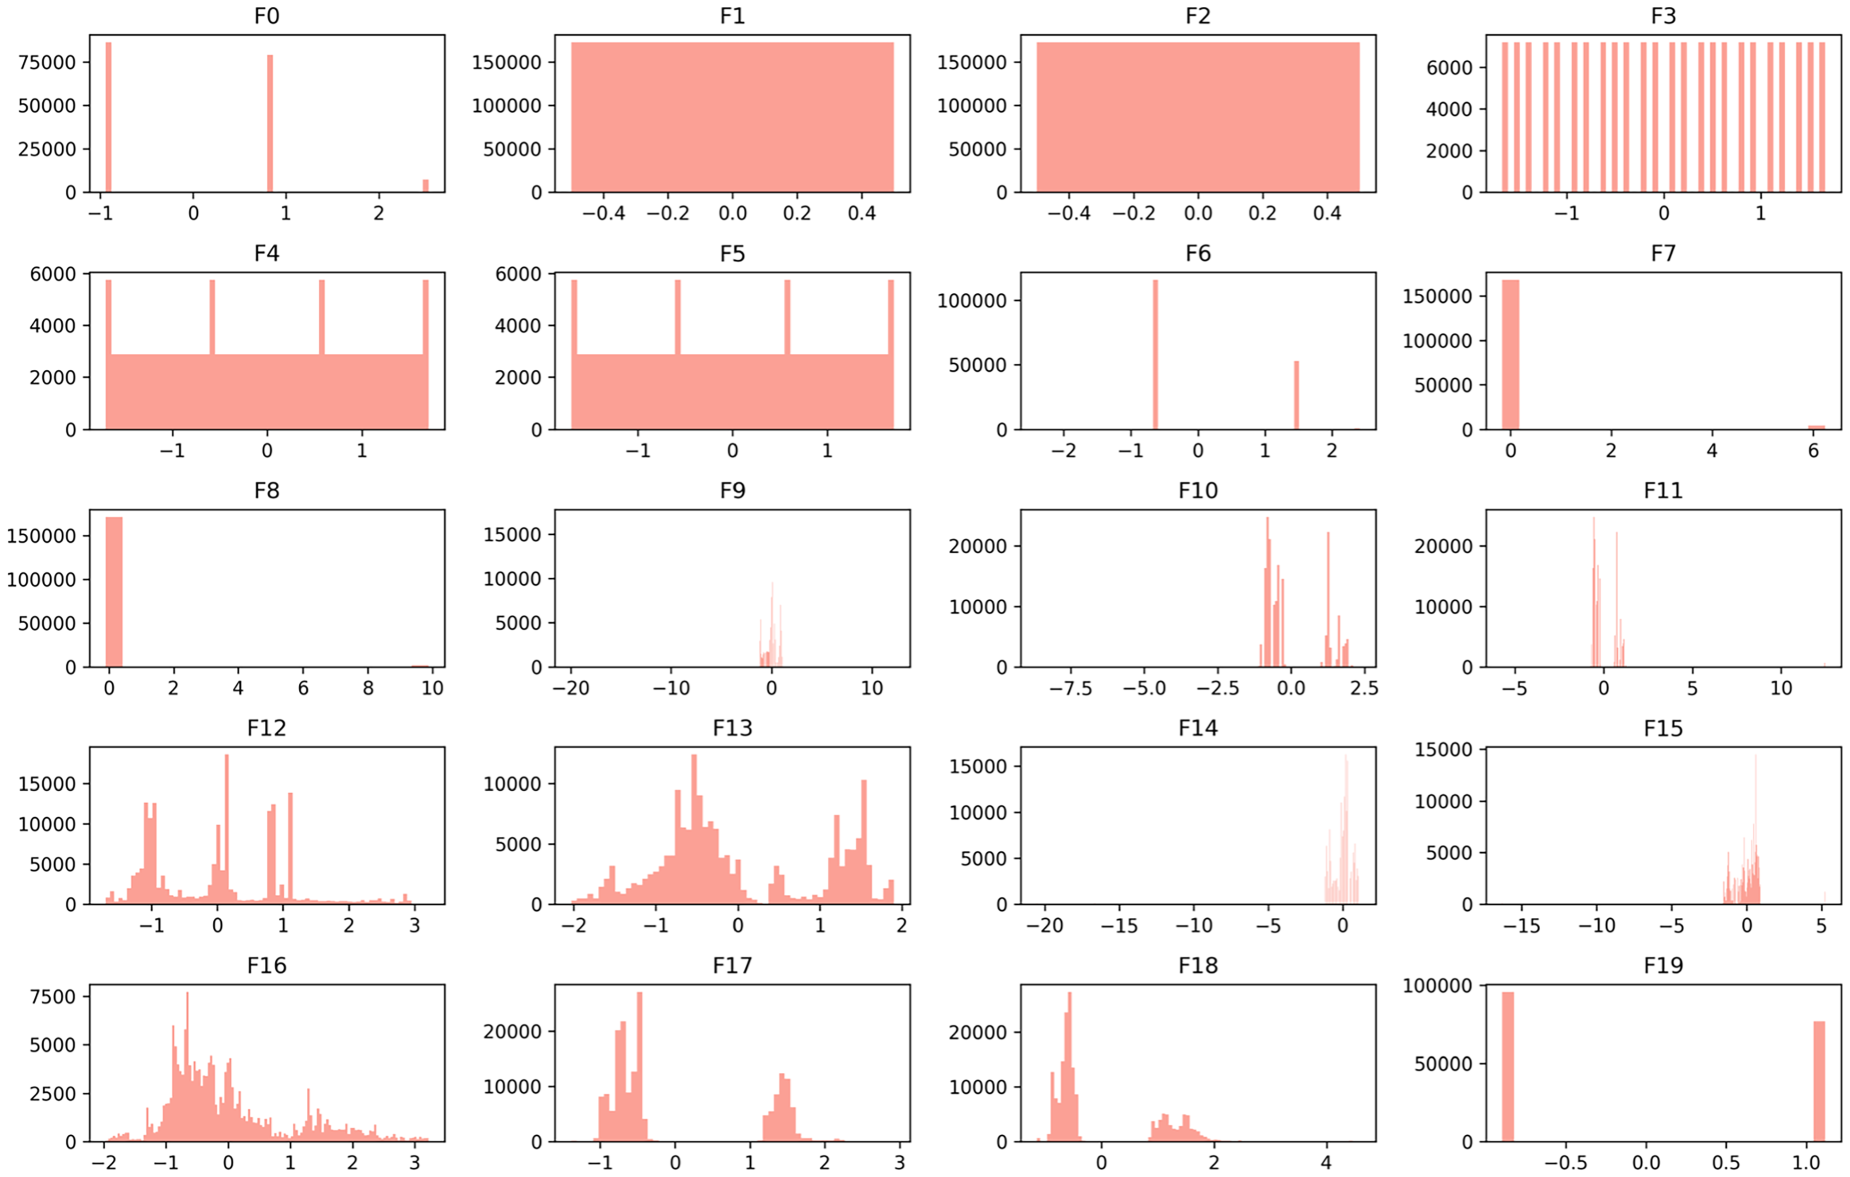
Distributions of normalized features of Smart-Farm-IDS dataset.
This section presents the methodological framework of the study, aiming to develop a new hybrid feature selection method to reduce the number of features and enhance the detection performance of the ANN. It begins by detailing the feature selection methods initially employed, including CS, MAD, and MI, which are used to evaluate the importance of features based on different statistical criteria. Following this, the proposed hybrid feature selection method is introduced, which combines these individual methods to enhance feature selection effectiveness. Finally, the section describes the detection model based on ANN, which leverages the selected features for accurate and efficient classification.
Existing feature selection methods
In the realm of cybersecurity, particularly for anomaly detection using binary classification, selecting the most relevant features is critical for improving model performance and efficiency (Chen et al., 2020). This study utilizes three established filter-based feature selection methods: CS, MI, and MAD.
Chi-square
The CS is a statistical method used to resolve if there is a noteworthy association between categorical variables (Alrubaie et al., 2023). In feature selection process, it compares the perceived frequency of feature values in each class to the assumed frequency if there were no association between the feature and the target class. The CS statistic (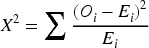
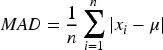
The MAD is a measure of variability in a dataset that provides the average of the absolute deviations from the mean of the dataset. It is used to understand the dispersion of data and can be utilized in feature selection to identify features with more variability (Babu and Malathi, 2023; Khair et al., 2017).
MI computes the amount of information obtained about one random variable through another random variable (Vergara and Estévez, 2014). It quantifies the dependency between variables. In feature selection, it quantifies how much information a feature contributes about the target variable. The MI (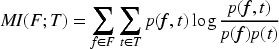
In the context of anomaly detection, the choice of feature selection methods is crucial, as it directly affects model performance (Gottwalt et al., 2019). For instance, the study in Aziz et al. (2013) introduces an anomaly detection approach using a genetic algorithm (GA) alongside various feature selection techniques, where the comparison revealed that the method using feature selection achieved the highest accuracy and sensitivity, despite producing the largest feature subset. Similarly, the study in El Sayed et al. (2022) focuses on detecting distributed denial-of-service (DDoS) attacks in software-defined networking (SDN) environments using deep learning. It applies feature selection methods to identify the most relevant features, significantly improving detection accuracy and reducing false alarms. These examples highlight the importance of selecting appropriate feature selection methods to enhance anomaly detection performance.
The combining existing methods is innovative and can potentially capture different aspects of feature importance (Ang et al., 2016). In this study, new hybrid feature selection methods have been developed using the existing feature selection methods such as CS, MI, and MAD. Each of these methods individually emphasizes different structural characteristics of the features, CS captures the relationship between categorical variables, MAD measures feature dispersion, and MI assesses the dependency between features. Using any single method may lead to an incomplete assessment of feature importance, potentially overlooking critical features. In this hybrid approach, the combination of these existing methods is performed using five different aggregation techniques: maximum, median, arithmetic mean, geometric mean, and harmonic mean. Each of these aggregation methods provides a unique way of combining the feature importance scores calculated by the three individual methods. Maximum aggregation retains the highest score among the three methods for each feature, ensuring that the strongest signal is captured. Median aggregation provides a balanced view by reducing the influence of extreme values. Arithmetic mean treats all methods equally, averaging their scores for a comprehensive assessment. Geometric mean emphasizes features consistently performing well across methods, while harmonic mean is sensitive to low scores, effectively highlighting features with consistently high importance. These aggregation techniques ensure a flexible and robust evaluation of feature relevance for anomaly detection.
By leveraging five aggregation techniques, the hybrid approach generates five different sets of feature importance scores, providing a comprehensive assessment of feature relevance. These combined scores are then used to rank the features, ensuring that the most informative features for the anomaly detection task are selected. This multiaggregation strategy not only improves the robustness of the feature selection process but also allows for greater flexibility in selecting the most suitable features for the classification model.
The existing feature selection methods have differently scaled scores (Hira and Gillies, 2015). To combine these methods, their scores have to be normalized. If not, one of them can dominate the final combined score. Min–max scaling method has been used to normalize the scores of CS, MI, and MAD methods before combining them. It transforms the original scores to a fixed range of [0, 1]. The feature with the highest original score will have a normalized score of 1, and the lowest will have 0. This normalization process preserves the relative relationships between the original data points. Also, it ensures that scores from different methods are on a comparable scale before aggregation (Talukder et al., 2017).
The normalized scores 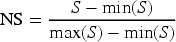
After applying min–max scaling to the three feature selection methods separately, the normalized scores
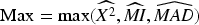
The maximum score (Max) method selects the highest score among CS, MI, and MAD for each feature. It emphasizes the strongest signal from any of the individual methods. It is particularly useful when you want to capture features that are highly ranked by at least one method. Max values of the features can be calculated as follows:
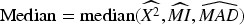
The median score (Median) method selects the median score among CS, MI, and MAD for each feature. It is a robust measure that is less affected by outliers and provides a central tendency of the scores. Median values are obtained as follows (Mishra et al., 2019):
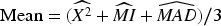
The arithmetic mean score (Mean) method calculates the average score of CS, MI, and MAD for each feature. It provides an overall average importance of each feature by equally weighing the three scores. The mean values are calculated as follows (Mishra et al., 2019):
The geometric mean score (Gmean) method calculates the geometric average of CS, MI, and MAD for each feature. It is useful for combining scores that vary on different scales and emphasizes features where all scores are relatively high. The geometric mean is less sensitive to extreme values compared to the arithmetic mean. It tends to favor features that perform consistently well across all three methods, as a low score in one method will significantly reduce the overall score. Gmean scores are measured as follows (Tharwat, 2018):
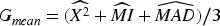
The harmonic mean (Hmean) method calculates the reciprocal of the arithmetic mean of the reciprocals of CS, MI, and MAD for each feature. It is particularly useful when the scores are small and penalizes features with any low individual scores, giving more weight to the smallest values. Gmean values are obtained as follows (Chakrabarty 2025):
Biological neural networks learn by detecting patterns and relationships in data (Patel and Goyal, 2007). The human brain is an exceptional pattern recognition tool, consisting of billions of interconnected neurons. In this way, it can learn and identify an almost infinite variety of input patterns.
ANNs are digitized models that mimic the information processing of the human brain (Shanmuganathan, 2016). It is used for tasks such as regression, classification, and pattern recognition. An ANN consists of layers of interconnected neurons or nodes that execute simple calculations.
A neuron in an ANN is a basic computational unit that mimics the behavior of a biological neuron. Each neuron receives one or more input signals, processes them, and produces an output signal. The inputs to a neuron are multiplied by weights, which are parameters learned during the network's training process. These weighted inputs are then summed, and a bias is added to this summed result. The obtained value is put into process with an activation function that calculates the output of the neuron. Subsequently, the output of the neuron is transmitted to neurons in the next layer. This process contributes to the ability to learn and model complex patterns in data (da Silva et al., 2017).
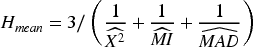
As seen in Figure 3, the neurons in an ANN are organized into three main layers as the input layer, the hidden layer, and the output layer. The input layer presents the inputs of the dataset. Each neuron in this layer corresponds to a feature. There is one input layer in an ANN. The hidden layer is the intermediate layer between the output and input layers. An ANN can have one or more hidden layers. It processes the input data through weighted connections and applies activation functions to disrupt linearity. This lets the network to learn complicated patterns in the data. The output layer produces the final output of the network. Similar to the input layer, there is one output layer in an ANN. In this layer, there are usually as many neurons as there are classes. These neurons represent each class. So, there is one neuron for binary classification tasks. The output is usually passed through a final activation function like sigmoid to convert it into a probability score.
General structure of an ANN model.
This section is organized into three focused subsections to provide a comprehensive analysis of the study's findings. The first subsection, Feature Importance Analysis, explores the significance of each feature used in the model, highlighting which features most strongly contribute to accurate anomaly detection in the smart farming context. The second subsection, Performance Analysis of Shallow and Deep ANN Models, presents a detailed comparison between the detection capabilities of shallow and deep ANN models, including hyperparameter optimization results. Finally, the Timing Analysis subsection examines the computational efficiency of the proposed method, including the time required for feature selection process, providing insights into the practicality of the approach for real-world deployment.
Feature importance analysis
In this study, five hybrid feature selection methods were implemented to choose the most important features for anomaly detection in a smart indoor farming system. As mentioned in Section 5.2, existing feature selection methods such as CS, MAD, and MI were combined with five different approaches such as Max, Median, Mean, Gmean, and Hmean for hybrid methods. Moreover, five most important features out of 20 were selected with both hybrid and existing feature selection methods for fair performance comparison.
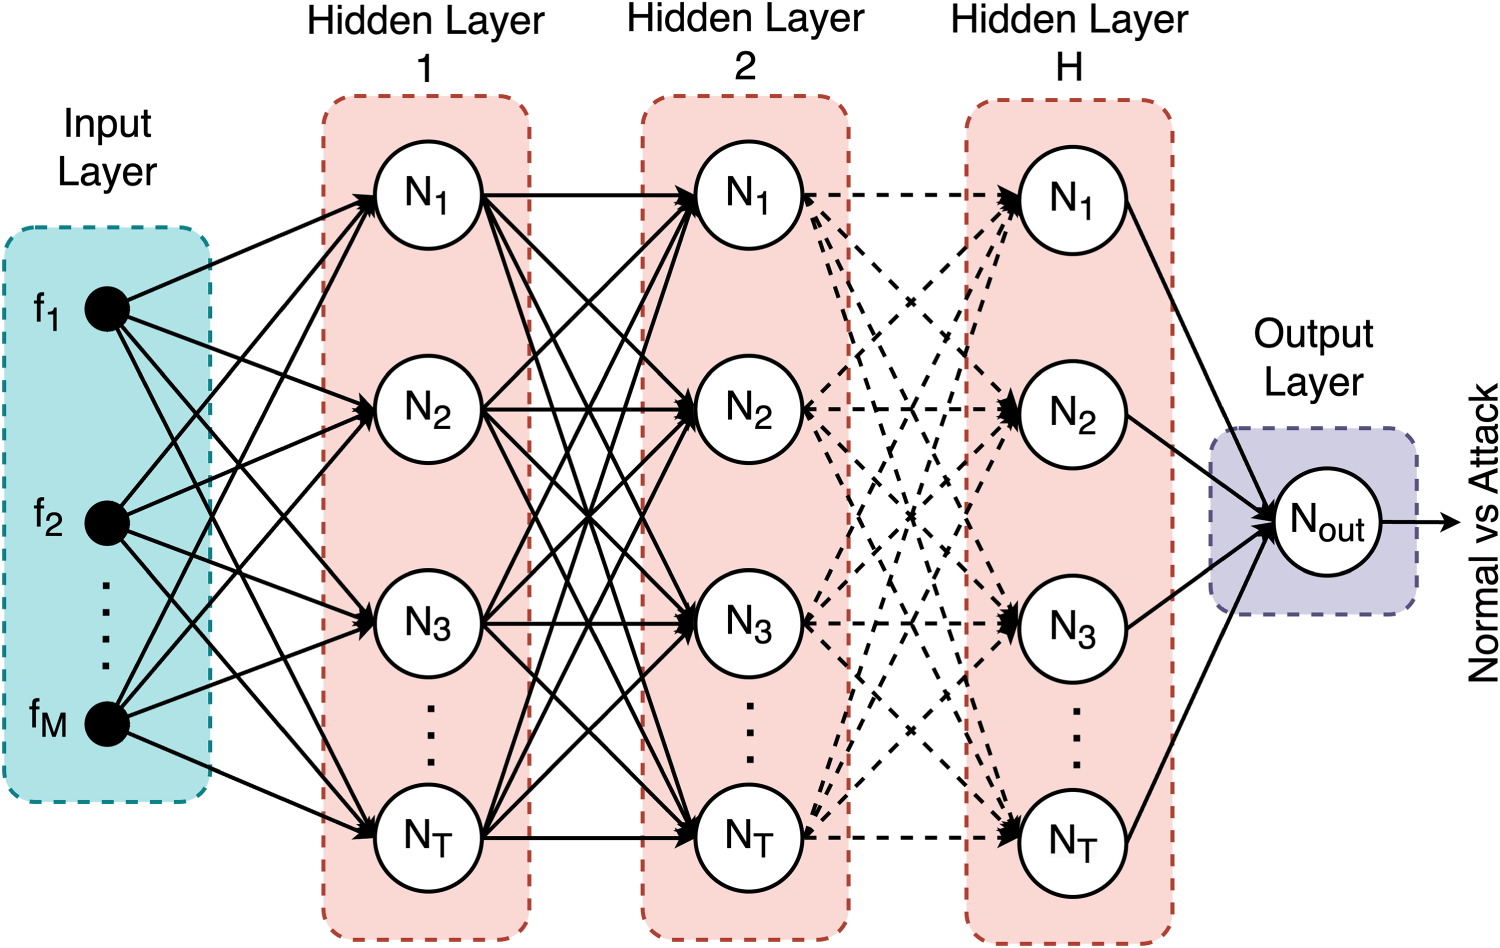
The feature importance scores of CS, MAD, and MI are illustrated in Figure 4. Each bar represents importance score of a feature, with higher scores indicating greater importance. Each method emphasizes different aspects of feature relevance, leading to a diverse ranking of features. Top five important features in the CS method are F11, F4, F7, F12, and F8. CS is a statistical test that measures the dependency between each feature and the target class (normal or attack). Therefore, features with the highest CS scores are those most strongly associated with the target class. Except these features, others have no significant importance, suggesting that their values do not significantly change between normal and attack conditions. Similarly, F12, F10, F16, and F11 are the highest-ranking features under MAD method. It captures the variability of each feature, measuring the average absolute deviation of values from the mean. Features with high MAD scores exhibit significant variation, which may be linked to different patterns in normal and attack scenarios. The others except these fives are of almost no importance, suggesting that their values are relatively consistent and show minimal variance, making them less useful for distinguishing normal and attack states. On the other hand, F5 has no importance under MI method, indicating that it provides limited information about the target class. But other features have importance with various scores. Top five features from most important to least important are F15, F16, F13, F12, and F14, indicating less uncertainty with the target variable.
Feature importance scores of existing feature selection methods.
The differences in feature importance across the three methods, including CS, MAD, and MI, reveal critical insights about the security of the smart farming system. CS emphasizes features directly linked to attack conditions, such as sensor states or actuator statuses, which are essential for detecting unauthorized actions like tampering or spoofing. MAD highlights the features with high variability, which may indicate abnormal sensor readings or unstable system behavior during attacks, helping identify subtle, irregular patterns. MI focuses on features that provide the most information for distinguishing between normal and attack states, highlighting those that are most informative for classification. These findings have a significant real-world impact, as they help prioritize features that are most sensitive to malicious actions, enabling the development of more efficient and accurate IDSs. By understanding which features are most critical for detection, smart farming systems can be better protected against security threats, minimizing the risks of compromised operations, yield loss, or system malfunctions. These distinctions demonstrate how each method captures unique aspects of feature relevance, making a hybrid approach beneficial.
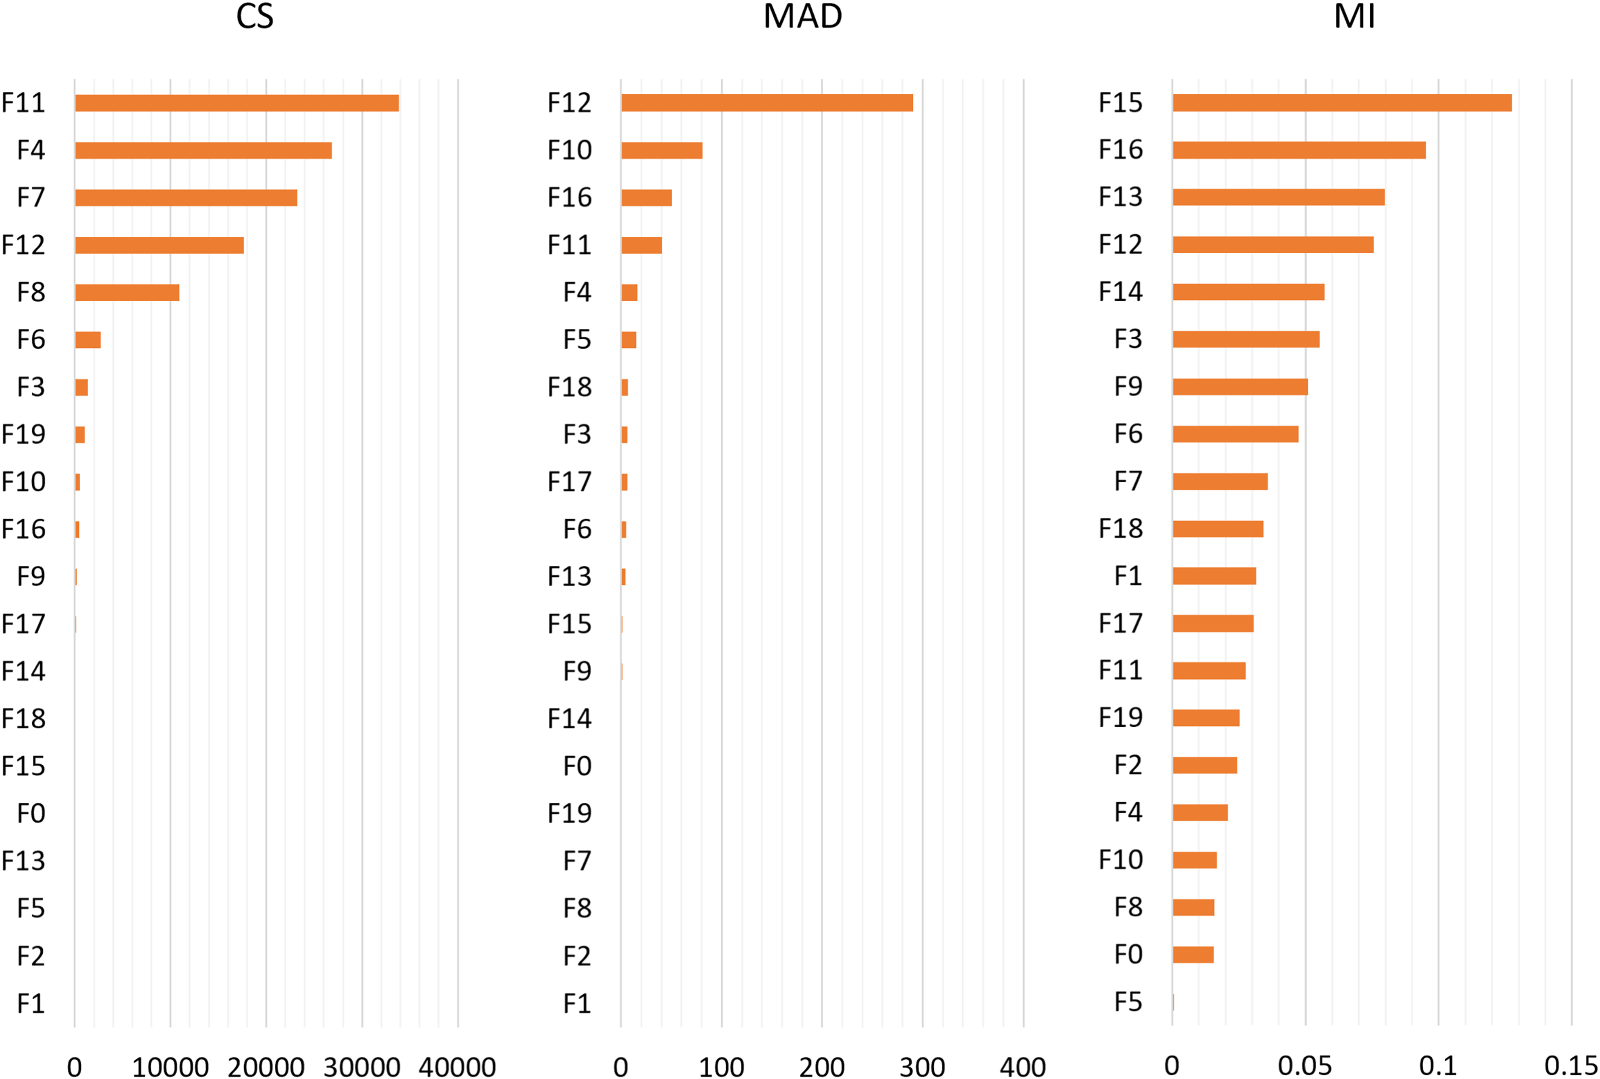
The feature importance scores of proposed hybrid methods are illustrated in Figure 5. Features F12, F11, and F4 consistently rank among the top important features across most hybrid methods. While some features (e.g., F12) maintain relatively stable importance across methods, others show considerable variability. For instance, F15 ranks high in the Max method but lower in others, indicating potential sensitivity to outliers. Features such as F5, F1, and F2 consistently rank low across all methods. The top five features for each aggregation method are as follows: For the Max method, the top five features are F15, F12, F11, F4, and F16. The Median method ranks F12, F7, F11, F16, and F4 as the top five features. According to the Mean method, the top features are F12, F11, F4, F15, and F7. The Gmean method identifies F12, F11, F4, F16, and F6 as the top five features. Finally, the Hmean method lists F12, F11, F4, F6, and F3 as the most important features. These rankings illustrate both the consistency and variability of feature importance across different aggregation methods, as each method captures different aspects of the data distribution. After determining top five features for each selection methods, ANN was used for detection.
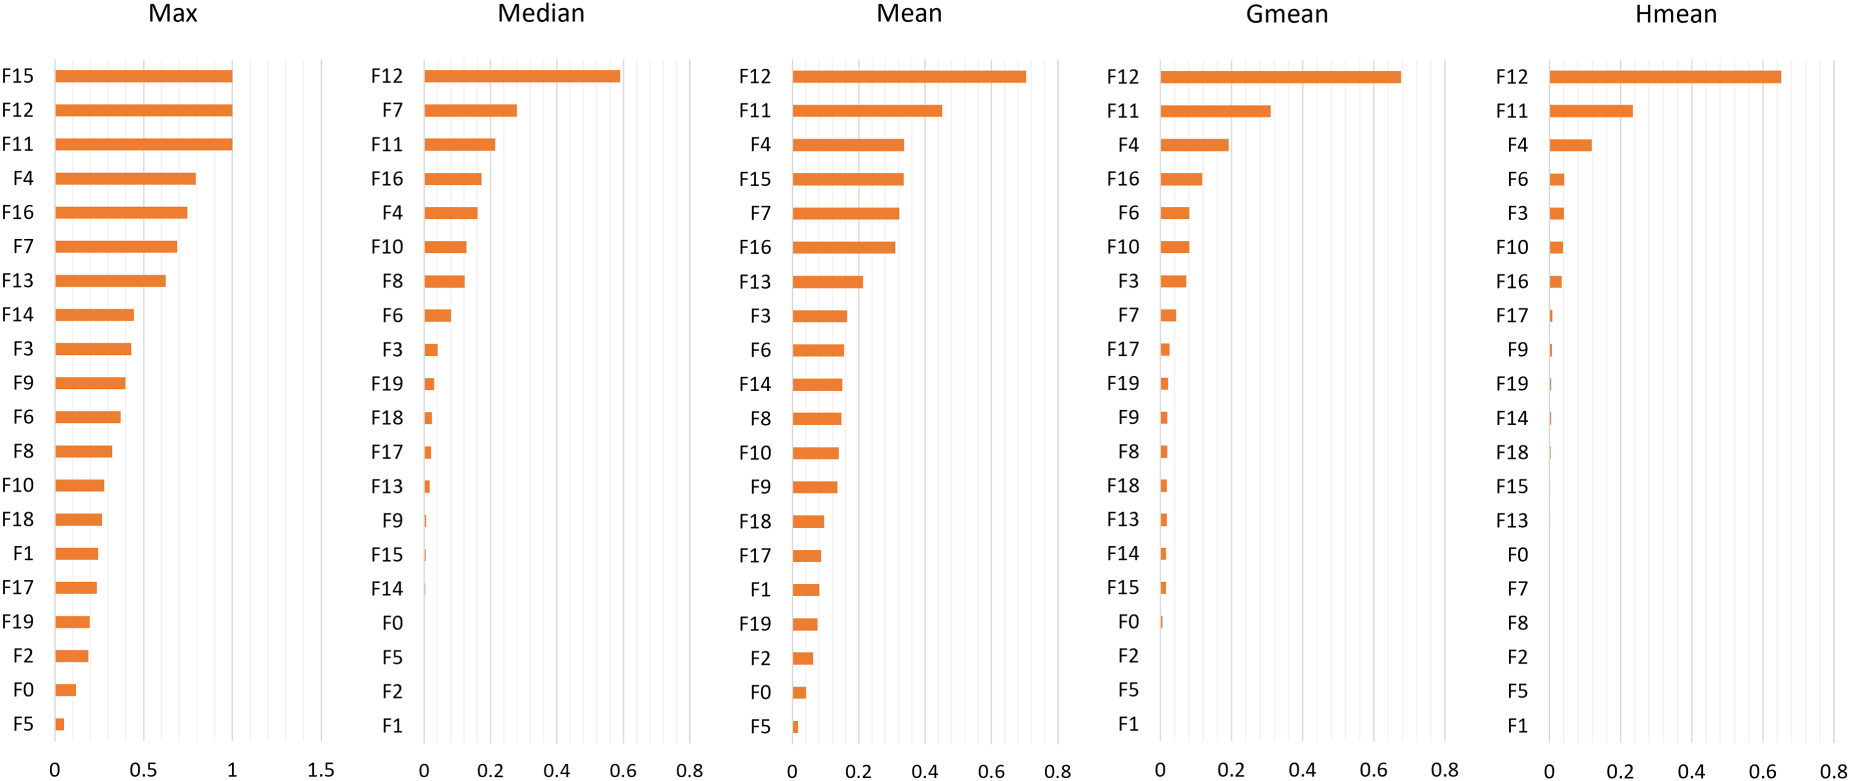
Feature importance scores of hybrid feature selection methods.
Two different ANN models which are called shallow ANN and deep ANN were used to detect anomaly. The distinction between these two models lies in the number of hidden layers they contain. Networks with one or two hidden layers are called shallow ANNs, while networks with more than two hidden layers are called deep ANNs (Al-Zewairi et al., 2020; Hoshino et al., 2022). While one hidden layer was used in the shallow ANN model, five hidden layers were used in the deep ANN. The performances of these two models for the hybrid filter-based feature selection methods were compared separately. To fair comparison, the values of parameters of both models were determined the same as: number of neurons per a hidden layer is 16, number of epochs is 50, and value for dropout in a hidden layer is 0.5. The dropout approach was used to avoid over-fitting during the training process by randomly deactivating half of the neurons in each layer.
The optimization of hyper-parameters of an ANN such as batch size, activation function, and learning optimizer is crucial to obtained best model performance (Kadhim et al., 2022). The optimization processes of shallow and deep ANN models were performed by using grid search approach. This approach is used to systematically determine the most suitable values for the hyper-parameters. It involves defining possible value ranges for them and training the model with each combination of these values. By evaluating the performance of model for each combination, it finds the optimal values that yield the highest accuracy. The optimal values of each hyper-parameter are given in Table 4.
Hyperparameters of shallow and deep ANN models with their possible values.
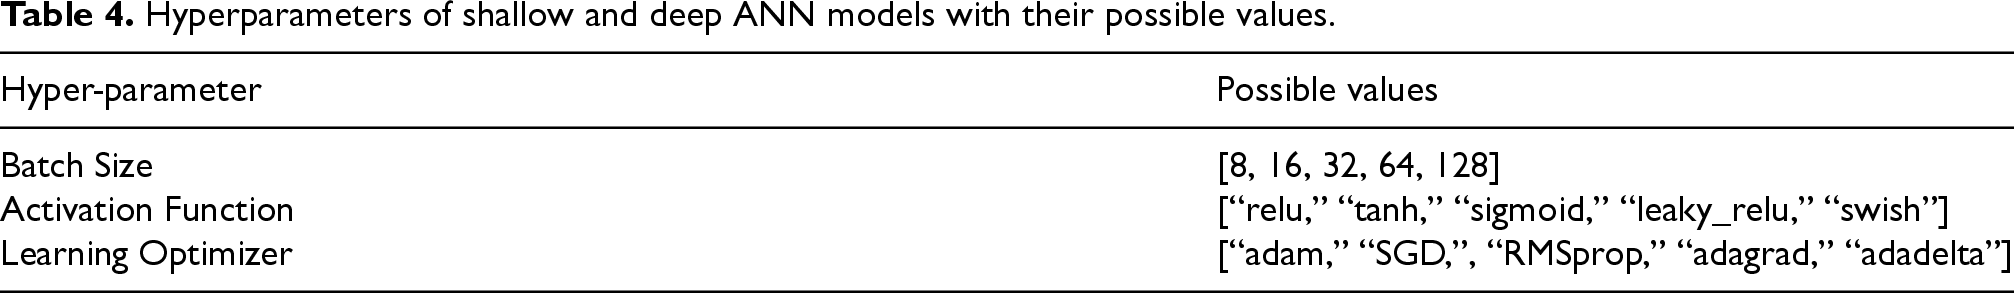
Hyperparameters of shallow and deep ANN models with their possible values.
To further validate the effectiveness of hyper-parameter optimization process and assure the robustness of the models, five-fold cross-validation was used. This approach involves dividing the dataset into five equal subsets. The ANN is trained and tested five times, each time using a different subset as the test set and the remaining four subsets as the training set. This process provides a generalizable evaluation of the subsets of models by ensuring that each data point is used for both testing and training (Tembusai et al., 2021).
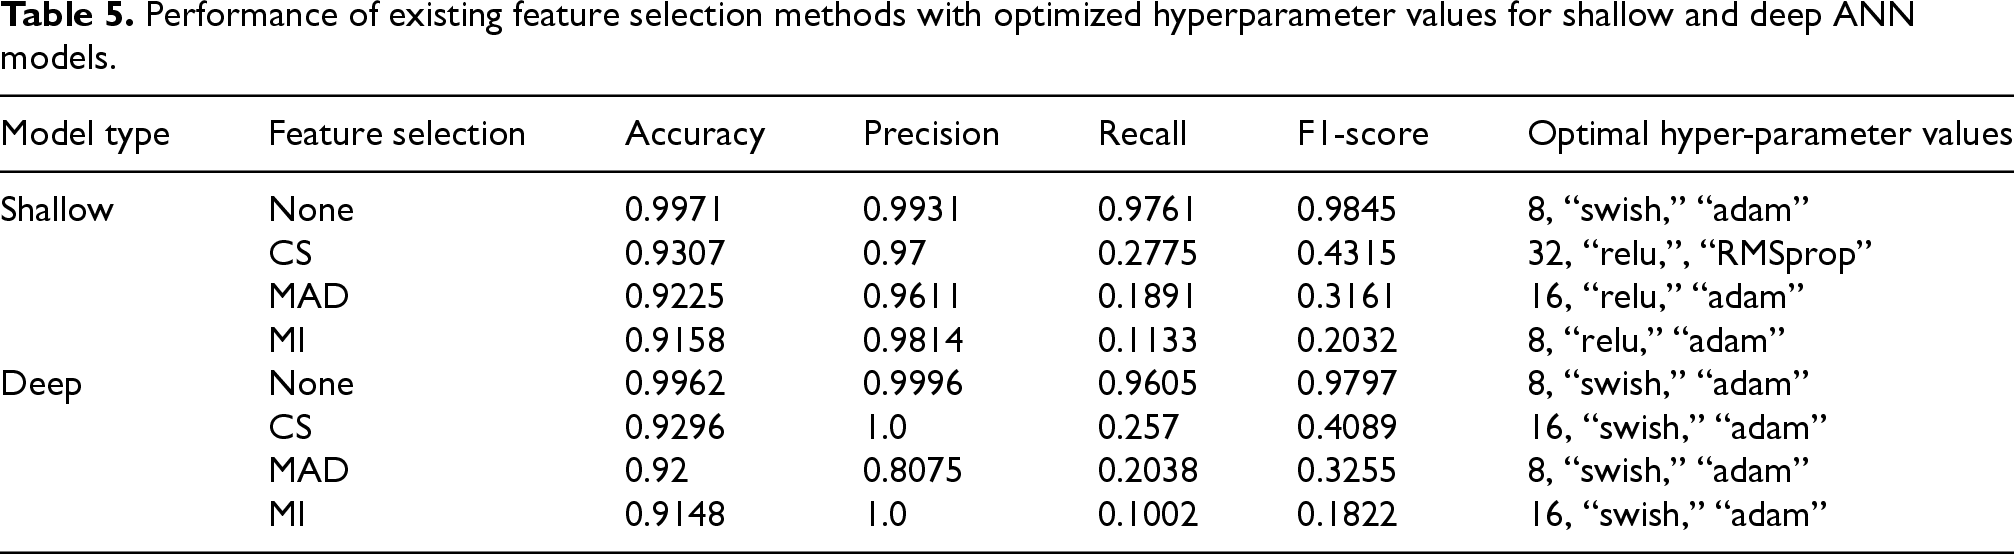
The results of existing feature selection methods are given in Table 5 for both shallow and deep ANNs. Also, the optimal hyper-parameter values obtained as result of grid search are provided and confusion matrices were illustrated in Figure 6. The models without using any feature selection method demonstrated best results as expected. Because they use the information that all 20 features have, others use only five features. Among existing feature selection methods, CS shows the best performance with 0.9307, and 0.9296 accuracies for shallow and deep ANN models, respectively. On the other hand, MI presented worst performance for both models.
Performance of existing feature selection methods with optimized hyperparameter values for shallow and deep ANN models.
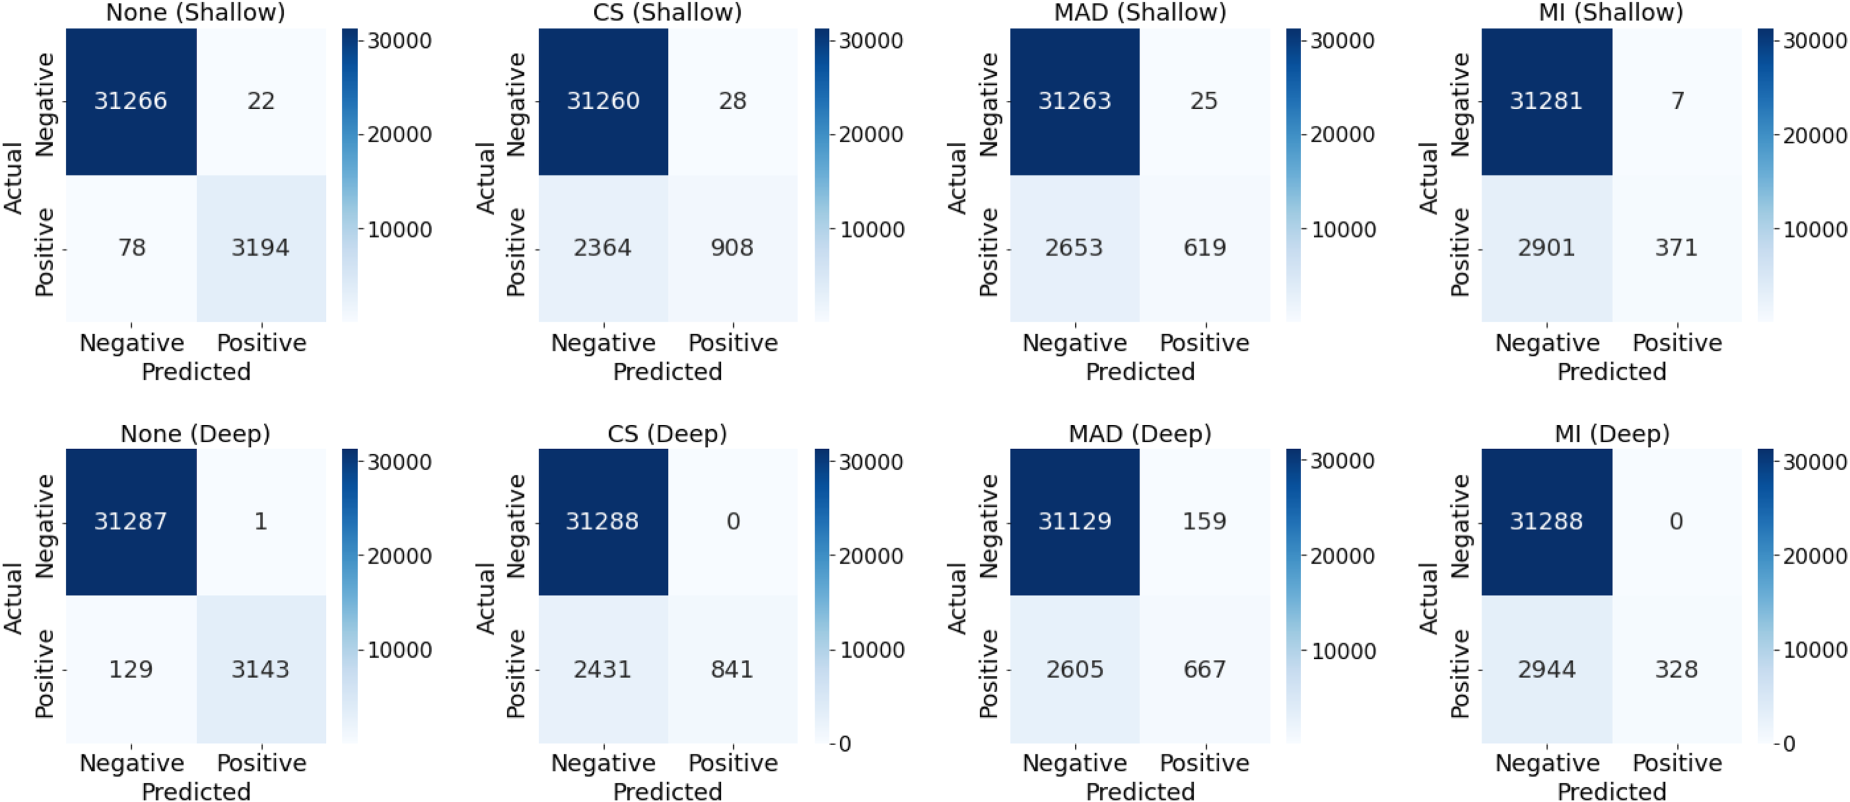
Confusion matrices of existing feature selection methods.
Table 6 presents the results of proposed hybrid feature selection methods for both shallow and deep ANNs, along with the optimal hyper-parameter values obtained through grid search. Additionally, Figure 7 illustrates the corresponding confusion matrices. Both shallow and deep models demonstrate high accuracy ranging from 0.9203 to 0.9382 and exceptional precision ranging from 0.9357 to 1.0, indicating strong overall performance and minimal false positives. However, recall values are notably lower ranging from 0.1595 to 0.3474, suggesting challenges in identifying all positive instances. This imbalance is reflected in the F1-scores, which range from 0.275 to 0.5157. The deep ANN model with Mean method consistently outperforms all other methods with the 0.9382 accuracy, 1.0 precision, 0.3474 recall, and 0.5157 F1-score using 8 as batch size, swish as activation function, and adam as learning optimizer. Secondly, the shallow ANN model with Mean method follows it. On the contrary, the shallow and deep ANN models with Max method perform worst performances.
Performance of hybrid feature selection methods with optimized hyperparameter values for shallow and deep ANN models.

Best results are in bold.
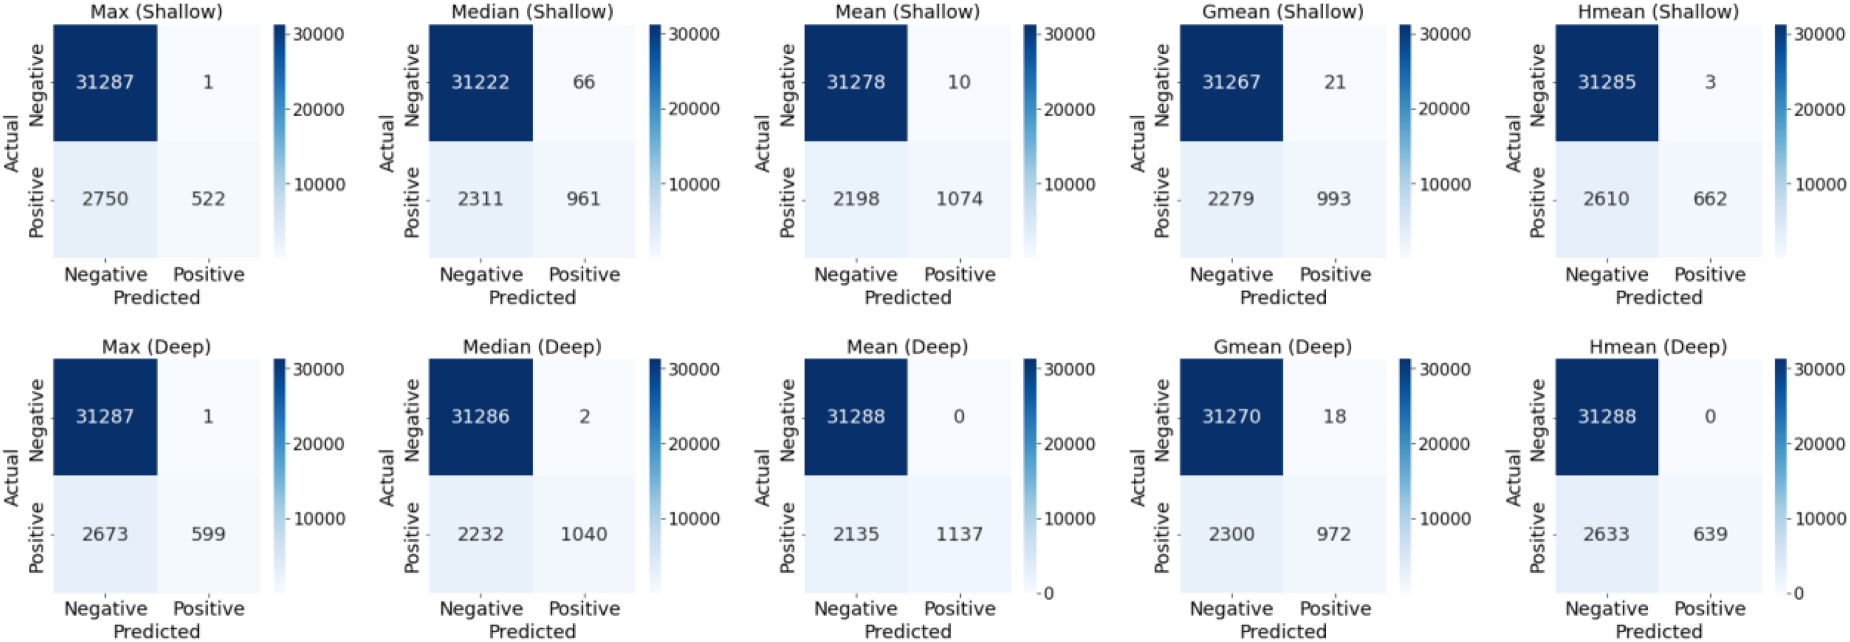
Confusion matrices of hybrid feature selection methods.
As seen in Figure 8, the proposed hybrid method Mean performs better than other existing methods such as CS, MAD, and MI for both shallow and deep ANN models. This hybrid method combines the strengths of these existing methods.
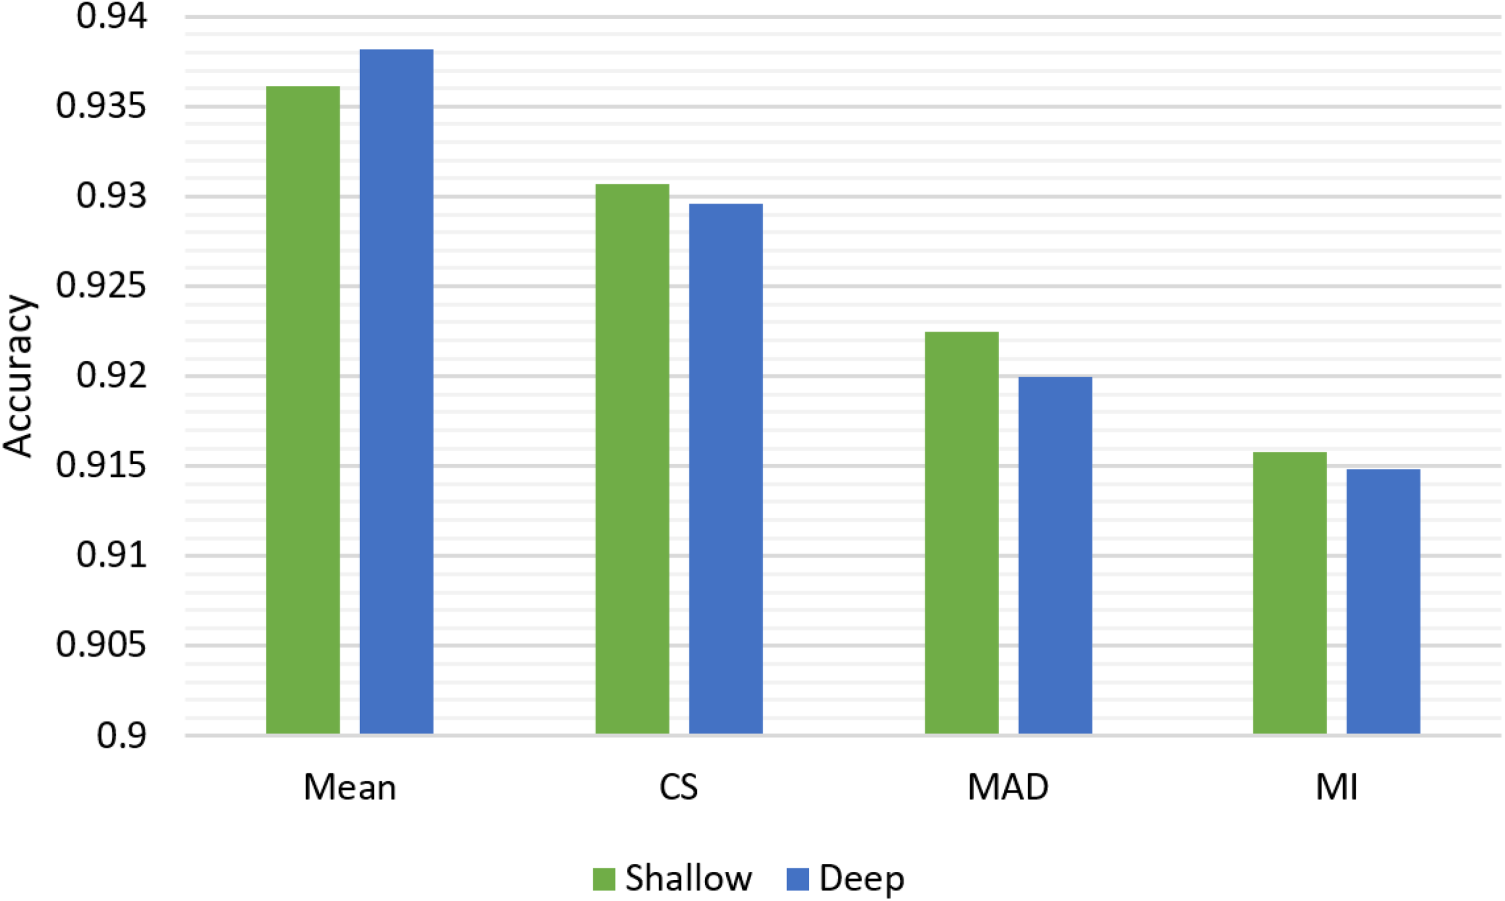
Performance comparison of hybrid and existing feature selection methods.
Figure 9 illustrates the performance change of both shallow and deep ANN using the Mean method across different batch sizes (8, 16, 32, 64, and 128). The deep ANN generally outperforms the shallow ANN across all batch sizes, suggesting that the additional complexity of the deep model contributes to better accuracy. For the deep model, there is a clear downward trend as batch size increases. The highest accuracy is achieved with the smallest batch size 8, and performance gradually decreases as batch size grows. The shallow model shows a different pattern, with performance peaking at a batch size of 32 before declining slightly for larger batch sizes. As batch size increases to 128, the performance gap between deep and shallow models narrows, suggesting that very large batch sizes might diminish the advantages of deeper architectures.
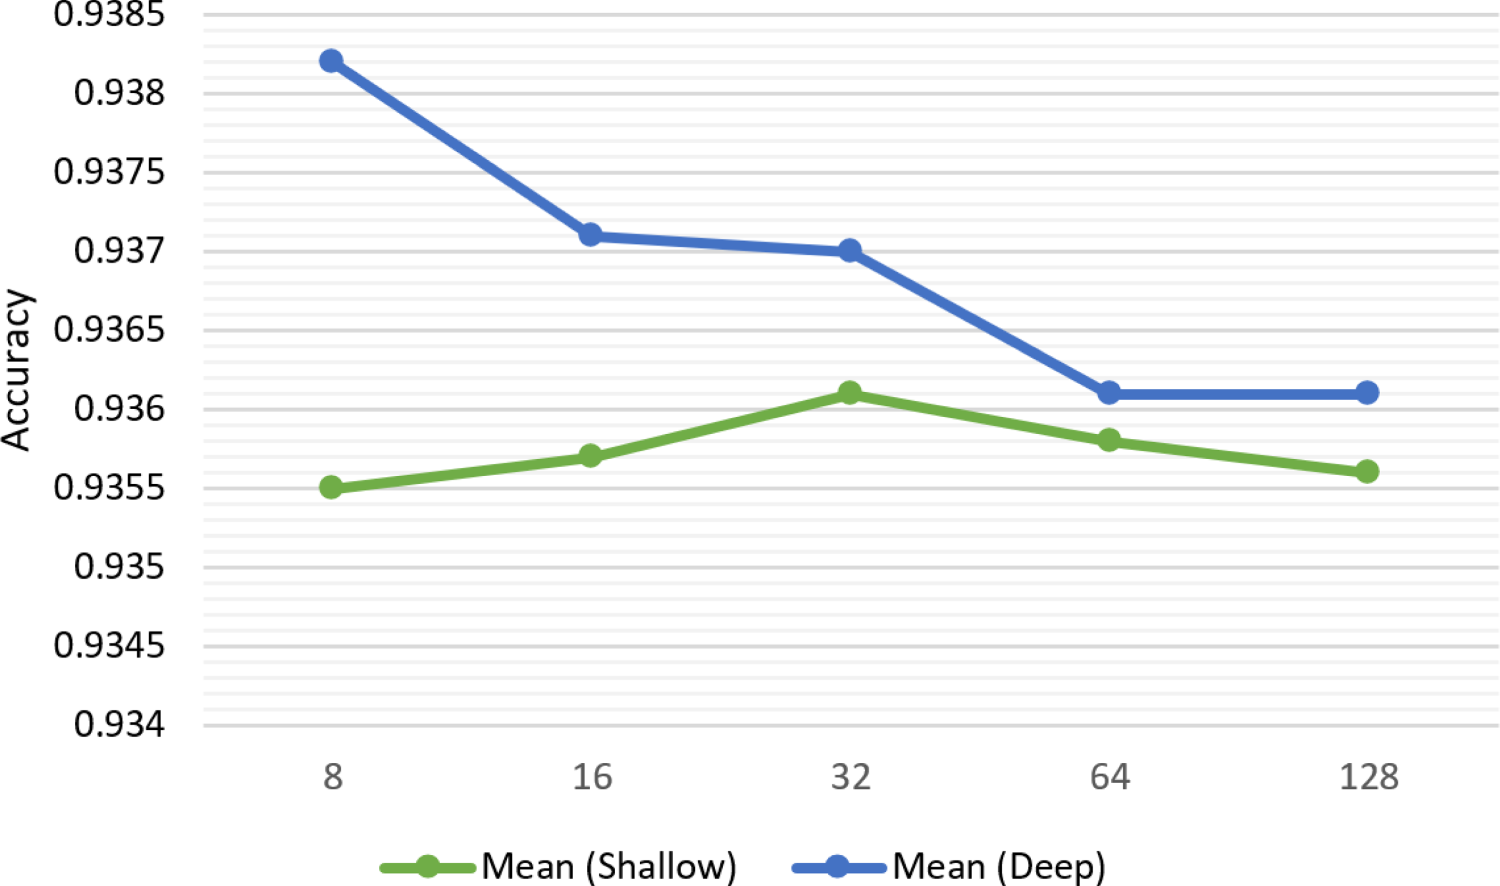
Performance change depending on batch size.
The performance change depending on activation function for both shallow and deep ANNs using the Mean method is illustrated Figure 10. The swish activation function demonstrates the highest accuracy for the deep model. While the shallow model shows superior performance with relu, it shows notable performance with swish as well. On the other hand, the shallow model performs worst with leaky_relu, while the deep model shows with tanh activation function.
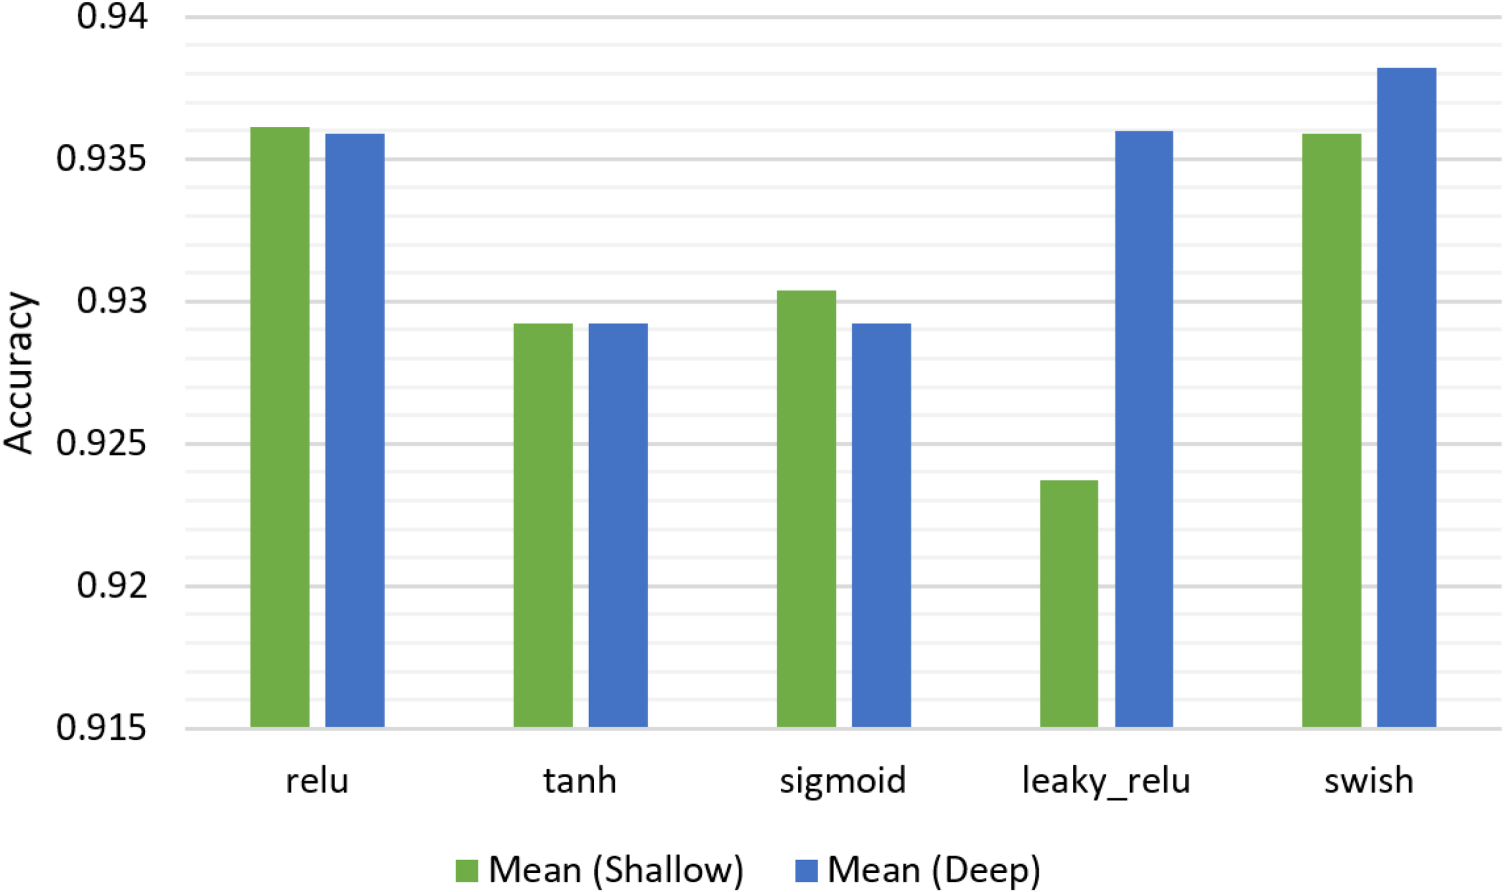
Performance change depending on activation function.
Finally, Figure 11 indicates the performance change depending on learning optimizer for both shallow and deep ANN using the Mean method. Although the shallow model exhibits the best performance with RMSprop learning optimizer, it also showed a significant result with adam. The deep model shows its best performance with adam optimizer. Conversely, worst performances are obtained with adagrad and adadelta optimizers for shallow and deep models, respectively. The outstanding performance of adam across both model types aligns with its popularity in deep learning applications, showcasing its ability to adapt learning rates effectively.
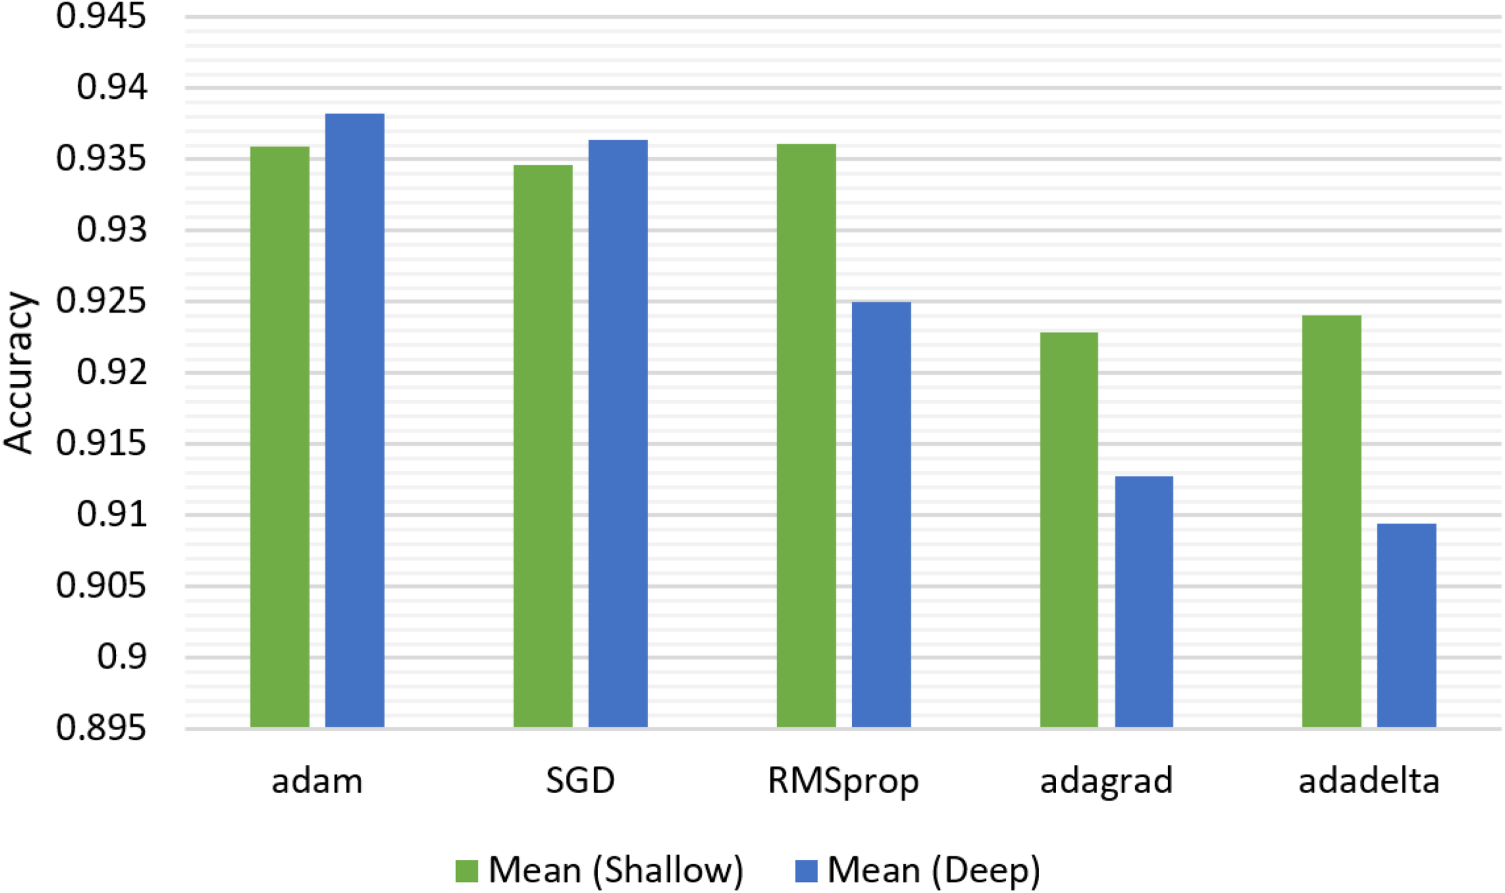
Performance change depending on learning optimizer.
A comprehensive analysis of the timing performances was conducted for both shallow and deep ANNs. The performances of models were analyzed both with and without using feature selection methods, separately. To ensure reliability of the results, each model was executed 10 times. Then, average value of execution times for each model was calculated for the final score. This approach mitigates the impact of outliers or anomalies that might occur in individual runs, resulting in more robust and consistent execution time measurements (Hao and Tian, 2020).
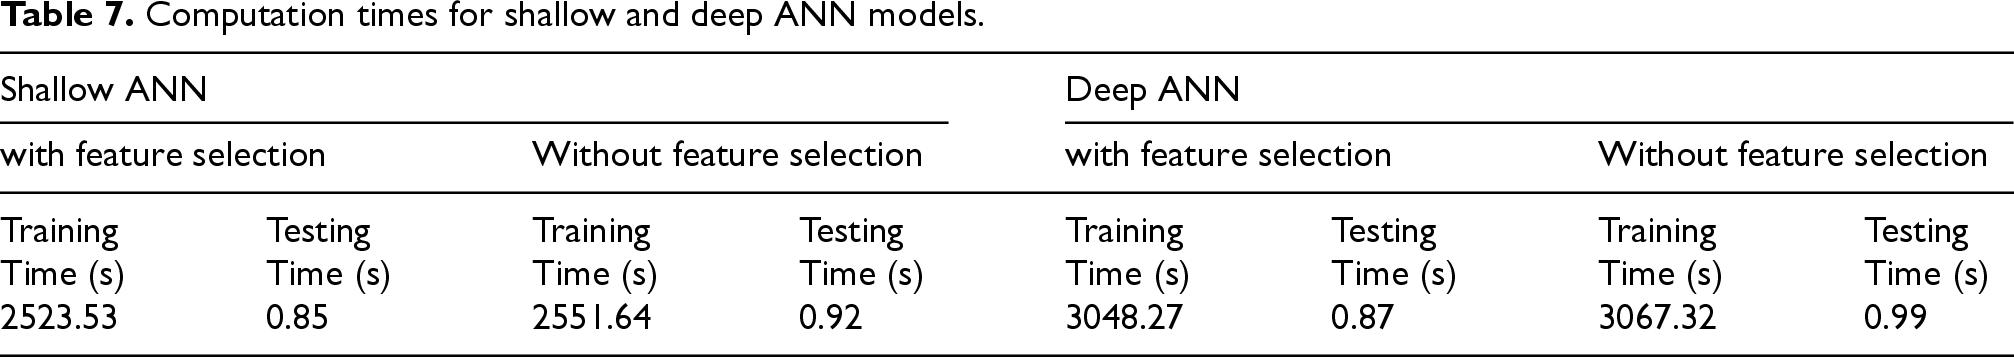
The timing analysis was conducted on a device equipped with an Intel(R) Core(TM) i5-10500 CPU (6 cores) running at 3.10 GHz, 16 GB of RAM, and Windows 11 Pro 64-bit. The results are presented in Table 7. Training and testing times are notably lower when using feature selection methods for both shallow and deep models. The shallow model shows a slight decrease in training time from 2551.64 s to 2523.53 s when feature selection is applied, and a reduction in testing time from 0.92 s to 0.85 s. Similarly, the deep model demonstrates a reduction in training time from 3067.32 s to 3048.27 s and a decrease in testing time from 0.99 s to 0.87 s. For the shallow model, feature selection reduces training time by 28.11 s (1.1% decrease) and testing time by 0.07 s (7.6% decrease). For the deep model, feature selection reduces training time by 19.05 s (0.6% decrease) and testing time by 0.12 s (12.1% decrease). The difference in computation time is attributable to the deep model having more hidden layers and being a more complex architecture. These results emphasize that the ANN model runs faster when using feature selection methods due to the reduction in the number of input features. Consequently, anomalies can be detected more quickly with feature selection methods, which is crucial for smart IoT systems.
Computation times for shallow and deep ANN models.
Computation times for shallow and deep ANN models.
This study has successfully evaluated a hybrid filter-based feature selection method for ANN-based anomaly detection systems in smart farming environments. Firstly, the establishment of a comprehensive smart farming system and the creation of a dedicated dataset named Smart-Farm-IDS have provided a solid foundation for analyzing cyber threats. This dataset, designed for binary classification between normal operations and anomalies, offers a valuable resource for future research in this area. Secondly, the performances of shallow and deep ANN models have analyzed. This comparison provides crucial insights for practitioners and researchers in selecting appropriate models for their specific use cases. Thirdly, the proposed hybrid feature selection method has demonstrated superior performance compared to existing methods such as CS, MAD, and MI in terms of classification accuracy. Besides, the feature importance scores of the proposed method reveal that features F12 (LightIntensity), F11 (Tds), F4 (Minute), F15 (HeatIndex), and F7 (WaterPumpToTank) rank as the top five most important features.
However, it is crucial to recognize the limitations of this study. Firstly, the study focuses on only ANN models. It may not fully explore the potential of other machine learning models that could also be effective for anomaly detection in smart farming systems. Secondly, the study uses a dataset specific to a particular smart farming environment. It may limit the generalizability of the results to different IoT-based systems. Thirdly, the effectiveness of the proposed hybrid feature selection method is dependent on the combination of CS, MAD, and MI methods. The combination of other feature selection methods can also be analyzed.
The experimental results highlight the effectiveness of ANNs in detecting cyber threats within smart farming systems, with the superior performance of the proposed hybrid method indicating a promising avenue for future advancements. This study offers a practical demonstration of how domain-specific datasets and hybrid feature selection techniques can substantially enhance anomaly detection in IoT-based environments. Furthermore, the insights derived from the feature importance analysis provide a deeper understanding of which data attributes are most critical for threat detection, offering valuable guidance for the development of more efficient and accurate IDSs. Additionally, the introduction of the Smart-Farm-IDS dataset serves as a valuable resource for future research, enabling the scientific community to further explore and develop advanced intrusion detection methods specifically tailored to the unique characteristics of smart farming environments.
Beyond the technical contributions, this study also raises important cross-cutting concerns that warrant consideration. The integration of AI in smart farming systems, while enhancing security and operational efficiency, introduces ethical challenges related to data privacy and security. Protecting the sensitive data generated by smart farming devices from unauthorized access is crucial to prevent misuse. Additionally, the environmental sustainability of smart farming practices must be considered, ensuring that the deployment of IoT devices and data-driven solutions does not lead to excessive energy consumption or electronic waste. Future research should explore strategies to balance technological advancements with ethical and environmental considerations in smart farming.
Footnotes
Author contributions
Kadir Ileri wrote the whole manuscript, implemented machine learning algorithms, and finally reviewed the manuscript.
Funding
The author disclosed receipt of the following financial support for the research, authorship, and/or publication of this article: This work was supported by the Scientific Research Projects Coordination Unit of Bandırma Onyedi Eylül University (Project Number: BAP-24-1004-002).
Declaration of conflicting interests
The author declared no potential conflicts of interest with respect to the research, authorship, and/or publication of this article.
Data availability statement
The dataset generated and analyzed during this study was created by the authors and is publicly available at https://github.com/kadirileri/Smart-Farm-IDS. This dataset was developed to support research in smart farming and is accompanied by detailed documentation to facilitate reuse by other researchers.