
Abstract
Purpose
The aim of this study was to evaluate the concentration of soluble programmed cell death ligand-1 (sPD-L1) in the plasma of hypopharyngeal squamous cell carcinoma (HSCC) patients before and after radiotherapy (RT) and to explore its correlation with prognosis.
Methods
A total of 47 patients and 12 healthy individuals were enrolled. All blood samples were collected before RT and 35 blood samples were obtained after RT. Twenty-three matched Formalin-fixed paraffin-embedding (FFPE) specimen from patient tumor biopsies were examined PD-L1 immunohistochemistry, and the sPD-L1 levels were quantified by enzyme-linked immunosorbent assay (ELISA).
Results
The level of plasma sPD-L1 in patients were higher than healthy individuals. Plasma sPD-L1 level at diagnosis correlated positively with T stage. The plasma sPD-L1 concentration had moderate correlations with PD-L1 expression in tissue (tPD-L1). In addition, the study proved that patients with high sPD-L1 had significantly worse overall survival (OS) than patients with low sPD-L1. sPD-L1 levels before RT was the unique independent prognostic factors for OS.
Conclusions
The study reported that sPD-L1 concentration before RT is proportional to the expression of tPD-L1. Besides, sPD-L1 before RT and tPD-L1 may serve as useful biomarkers for prognosis.
Introduction
Hypopharyngeal squamous cell carcinoma (HSCC) accounts for approximately 3% of all head and neck squamous cell carcinoma (HNSCC), which carried the worst prognosis, with a 5-year-survival rate of only 30–35%. 1 Due to its covert anatomical structures and asymptomatic feature in the early stage, the majority of patients are present with advanced stage disease when first diagnosed. Despite the considerable improvement in surgery, chemotherapy and radiotherapy (RT) in recent years, the treatment outcome remains unsatisfactory. Therefore, novel and effective therapeutic approaches are in urgent demand.
In recent years, immunotherapy as a fourth cancer treatment has been already widely used in clinical settings. Pembrolizumab and nivolumab have been approved for HNSCC by Food and Drug Administration (FDA) and European Medicines Evaluation Agency (EMEA) in the recurrent/metastatic setting. Among them, pembrolizumab emerged as the first-line agents in June 2019. 2 Meanwhile, novel biomarkers need urgent exploration to predict the prognosis. In view of this, many biomarkers were studies, especially PD-L1 expression. It is now generally accepted that PD-L1 positivity rate in the tumor can predict the effect of anti-PD-1/PD-L1 therapies in many tumor types.3,4 Previous research was mainly focused on PD-L1 expression in tumor tissues by immunohistochemistry, and little emphasis has been paid to PD-L1 expression in blood, including soluble form, exosomes, and circulating tumor cells (CTCs). Compared with classic pathological methods, liquid biopsies are more convenient, minimally invasive, of low cost and enable dynamic monitoring.5–7 In this sense, liquid biopsies are more useful and more applicable in clinical research. Of these, detecting the level of soluble PD-L1 (sPD-L1) from plasma by enzyme-linked immunosorbent assay (ELISA) is most convenient. Multiple studies about sPD-L1 have been performed to date in various tumors,8–10 but the studies that specifically report HSCC are none.
Here, we quantified plasma sPD-L1 level before and after RT, and evaluated PD-L1 expression using matched tumor tissue to explore the association of PD-L1 in different forms and the relationship between sPD-L1 and clinical features. Additionally, we explored the prognostic significance in sPD-L1 level before RT.
Materials and methods
Patients
Forty-seven HSCC patients treated with RT were included in the study, from January 2017 till December 2018 at Shandong Cancer Hospital and Institute. TNM stage was decided according to the 8th edition of AJCC/UICC TNM staging system. All patients received established diagnoses by hypopharyngeal biopsy, and all of them accepted intensity-modulated radiation therapy (IMRT). The regimens and doses of the therapies for all patients were in accordance with NCCN guidelines. All patients visited the outpatient office 1 month after RT for follow-up assessment. Patients were then evaluated every 3 months during the first 2 years, at 6-month intervals in the next 3 years, and annually thereafter. Telephone follow-up was conducted if an outpatient follow-up visit was not feasible. Follow-up was conducted with each patient until their death or June, 14, 2022, if the individual remained alive. Written informed consents were obtained from all patients for the publication of this report and the protocol of this study was approved by the Institutional Review Board of Shandong Cancer Hospital (approval number SDTHEC2020011002). All procedures were in accordance with the principles of the Declaration of Helsinki and its later amendments or comparable ethical standards.
sPD-L1 ELISAs
Blood samples were collected at pro-radiotherapy and at post-radiotherapy with aseptic tubes containing EDTA (5 ml). All blood samples were processed for plasma isolation by centrifugation at 751 g for 10 min at 4°C within half an hour of collection. Additional centrifugation for 10 min was performed to obtain cell-free plasma. The plasma was isolated into Eppendorf (EP) tubes and stored at −80 °C until measured. The sPD-L1 level was measured using enzyme-linked immunosorbent assay kit (ab214565, Abcam, USA) according to the manufacturer's instructions. Briefly, standards and samples were added to wells, followed by PD-L1-conjugated antibody. Then, the plates were incubated for 1 h at room temperature and washed 3 times. Finally, substrate solution was added for color reaction and measured at 450 nm. The sPD-L1 level was calculated using standard curves. The assay range reported in the package insert of sPD-L1 kit was 21.870–1400 pg/ml and the minimum detectable level was 2.910 pg/ml.
The tPD-L1 measurement by immunohistochemistry
The expression of PD-L1 was evaluated by immunohistochemical staining. 11 In brief, HSCC paraffin embedded tissue sample was taken: 4-μm serial sections and processed with dewaxing hydration, and then endogenous peroxidase activity was blocked by antigen retrieval. After that the tissues were incubated with the PD-L1 (clone 28–8; Abcam, Tokyo, Japan; 1:200 dilution) primary antibody for 60 min at room temperature. Finally, the slides were incubated with the second antibody, MaxVisionTM/HRP (Dako) for 30 min at room temperature. Twenty-three matched Formalin-fixed paraffin-embedding (FFPE) specimen from patient tumor biopsies. Immunohistochemical results were evaluated by two pathologists in a blind way. We randomly selected 5 fields and 200 cells/field to calculate the mean of the positive rate of five fields as the positive rate of each tissue section.
Meta-analysis
To make a comparison with existing studies, 26 studies investigating the sPD-L1 in head and neck cancer (HNC) patients were comprehensively searched in PubMed from inception to October 10, 2024. The following search terms were applied: (sPD-L1 or soluble programmed death-ligand 1) and (head and neck cancer). The hazard ratio (HR) and 95% confidence interval (CI) were extracted of each study if available. Otherwise, HR results from univariate analysis were extracted. If HR was not directly reported, we estimated it after extracting the survival data from Kaplan-Meier curve if available using GetData Graph Digitizer 2.26. 12 Review Manager 5.4 software was used to draw a forest map.
Statistical analyses
The sPD-L1 levels in HNC patients from the literature was extracted using GetData Graph Digitizer 2.26. For continuous data, due to skewed data distribution, correlations between continuous variables will be estimated by Spearman correlation coefficients. Statistical differences between two groups were determined by Mann-Whitney U-test. Group data are expressed as median (first quartile; third quartile). X-tile software (https://medicine.yale.edu/lab/rimm/research/software/) was used to generate an optimal cutoff value of sPD-L1 and tPD-L1 (Supplementary Figure A-B). The Cox proportional hazard model was used to assess prognostic factors affecting overall survival (OS). The factors with significance in the univariate analysis (P < 0.200) were incorporated in the subsequent multivariate analysis. Multivariate analysis was used to determine the independent prognostic factors. The statistical analysis was performed by SPSS 23.0 (IBM SPSS Statistics) and the graph was operated by GraphPad Prism 8.0 (GraphPad Software, Inc., San Diego, CA). The survival of patients was determined by Kaplan-Meier curve and log-rank test. The model for quantitative synthesis was determined by between-study heterogeneity. A fixed-effect model was applied when there was low heterogeneity (I2 < 0.500 and Q test P > 0.100). Otherwise, a random-effect model was used. P-values of less than 0.050 were considered significant.
Results
Plasma sPD-L1 level in patients and in controls
Our analysis included 47 patients and 12 healthy individuals as a control group. Post-radiotherapy data of sPD-L1 were available in 35 patients and all patients had pre-radiotherapy data. Based on AJCC TNM classifications, 27 cases were in stage T1-3 (4 stage T1, 11 stage T2, 12 stage T3) and 20 were in stage T4. Besides, we found 4 and 43 patients were in clinical stages I-II, III-IV, respectively. Patient and tumor characteristics are shown in Table 1. There was no difference in age between the patients and healthy control groups. The level of plasma sPD-L1 in patients were higher than healthy individuals [26.858 (22.442, 43.417) pg/ml vs. 54.352 (36.729, 71.410) pg/ml, P = 0.001; Figure 1]. Additionally, the concentrations of sPD-L1 in HNC patients were obtained from 2 existing studies,13,14 which were higher than healthy individuals [26.858 (22.442, 43.417) pg/ml vs. 200.325 (109.410, 243.190) pg/ml, P < 0.001; Figure 1]. In order to determine the optimal cutoff of sPD-L1 and tPD-L1, we determined 41 pg/ml and 30% as the optimal cutoff by X-tile.
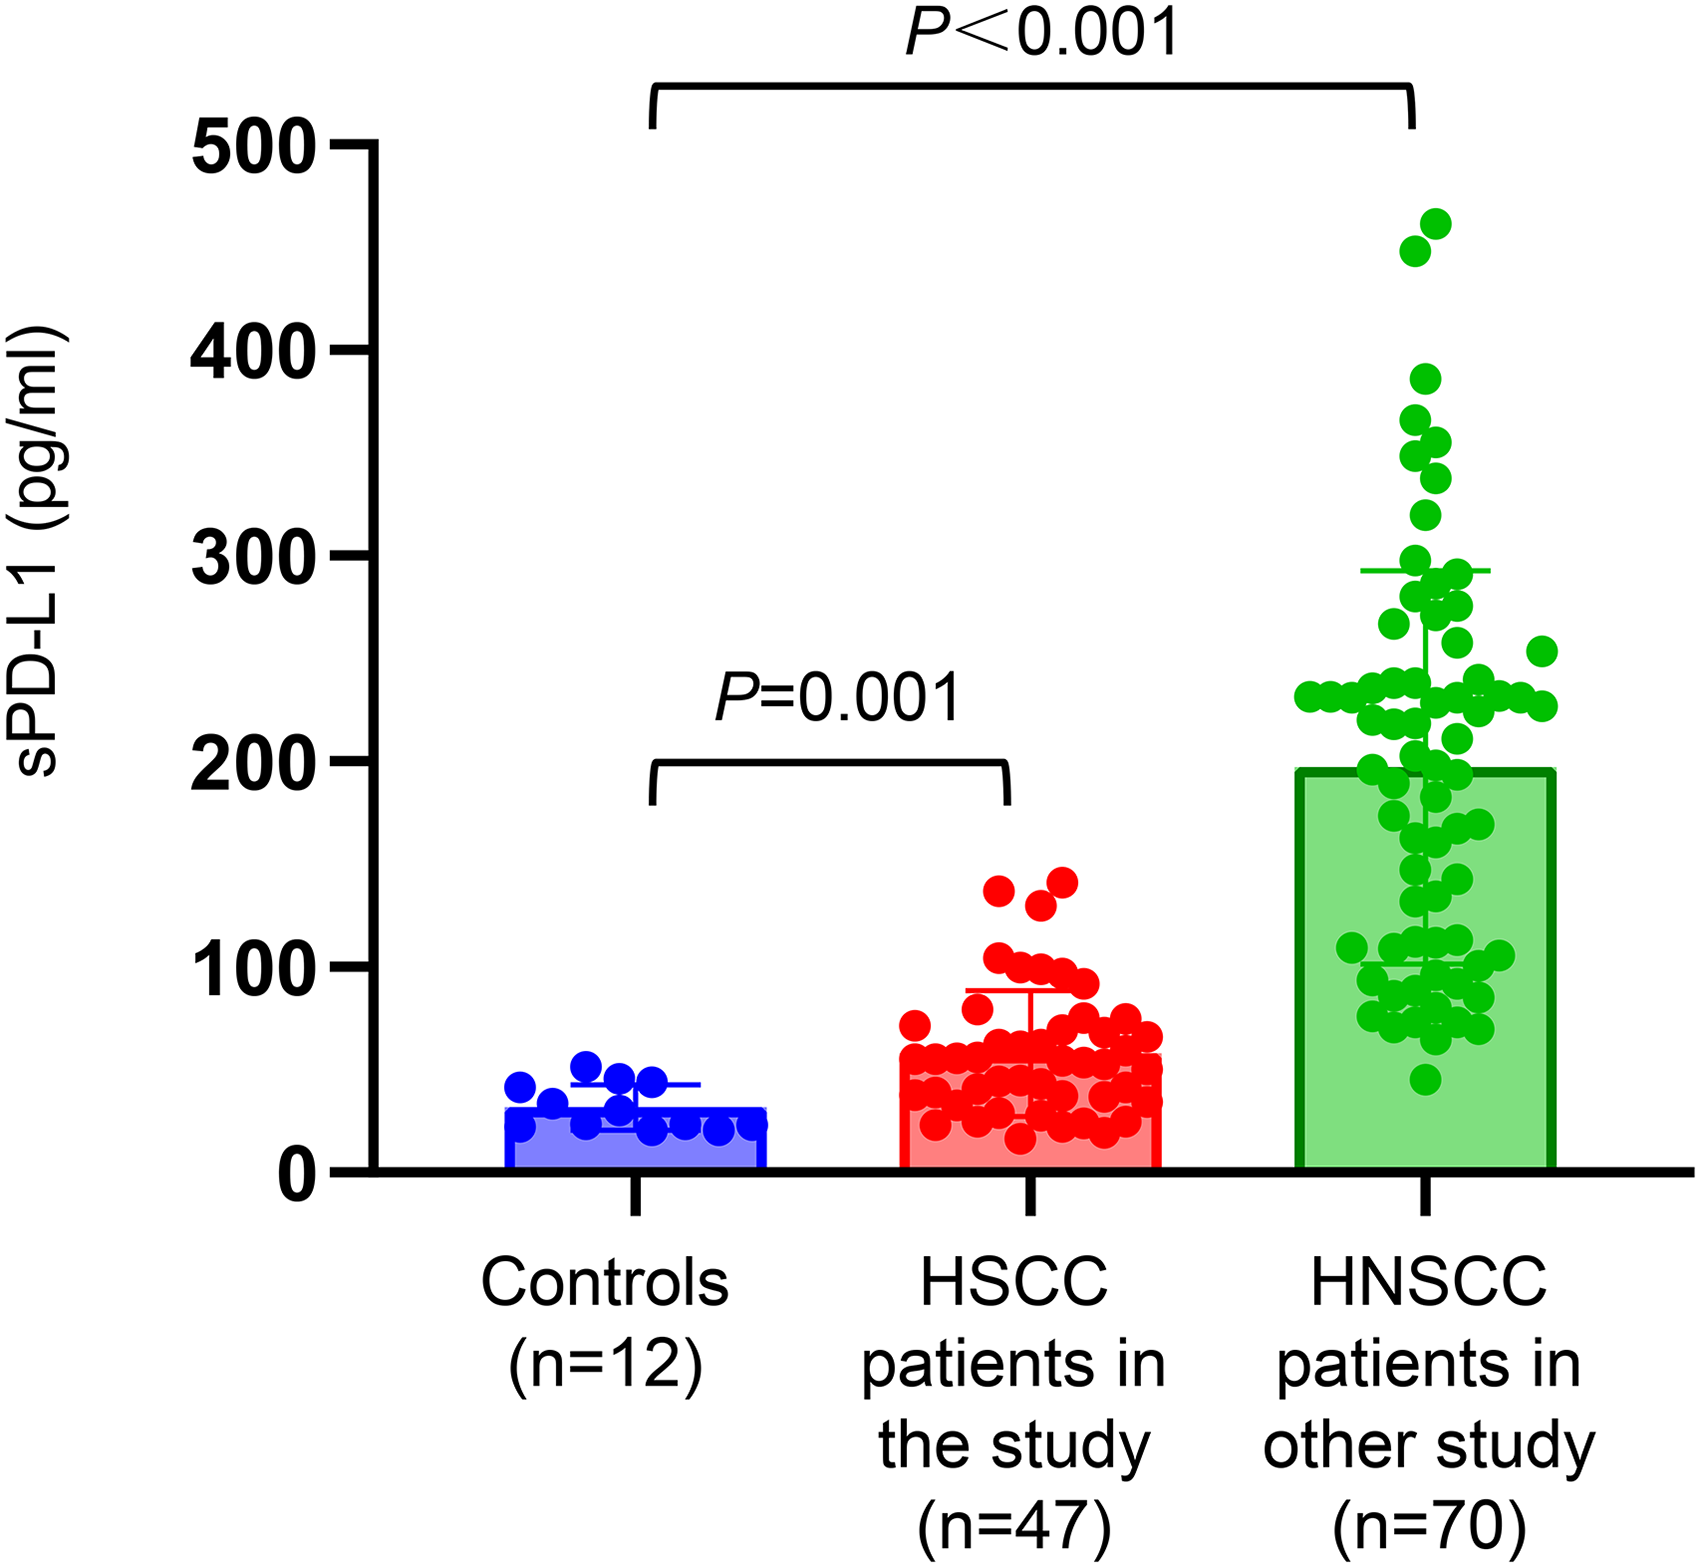
Plasma sPD-L1 levels in healthy controls (12 samples) and in patients with HSCC (47 samples).
Patient characteristics.
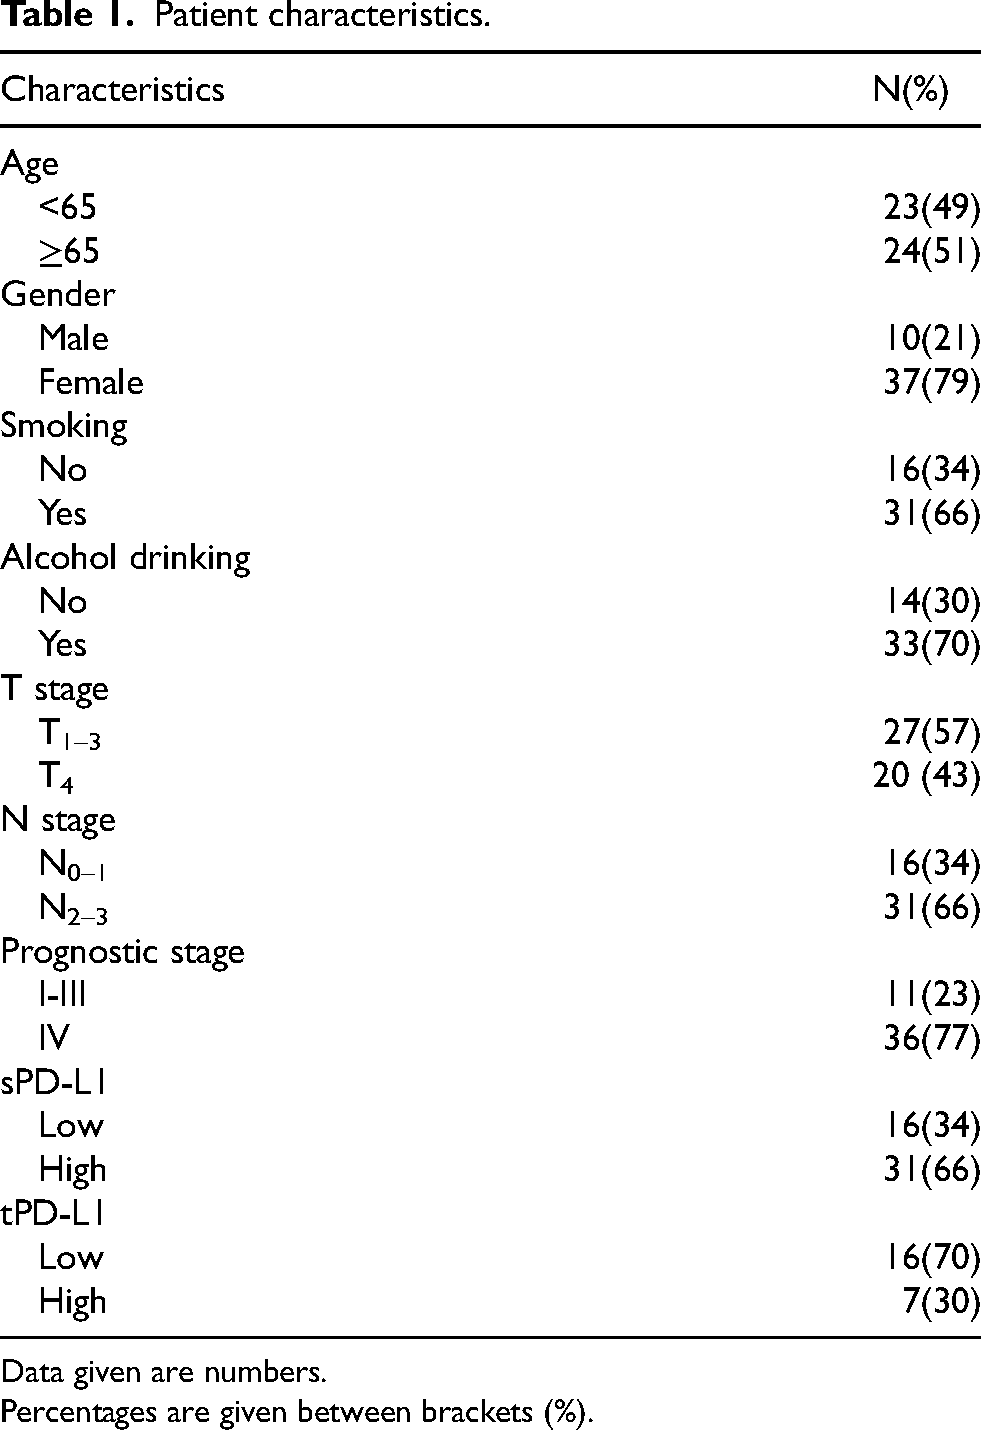
Data given are numbers.
Percentages are given between brackets (%).
The relevance of sPD-L1 and tPD-L1
Twenty-three matched FFPE specimen from patient tumor biopsies were examined PD-L1 immunohistochemistry, and 22 of them had positive PD-L1 expression (≥ 1%). Out of the positive samples, the maximum of PD-L1 positive tumor cells was 64%. The typical immunohistochemical staining images of PD-L1 are shown in Figure 2A and Figure 2B. The plasma sPD-L1 had moderate correlations with tPD-L1 (r = 0.566, P = 0.005; Figure 2C). We then separated patients into low and high expression groups, using 30% as a cut-off value. The concentration of sPD-L1 was significantly higher in the patients who were in high tPD-L1 group (P = 0.023; Figure 2D).
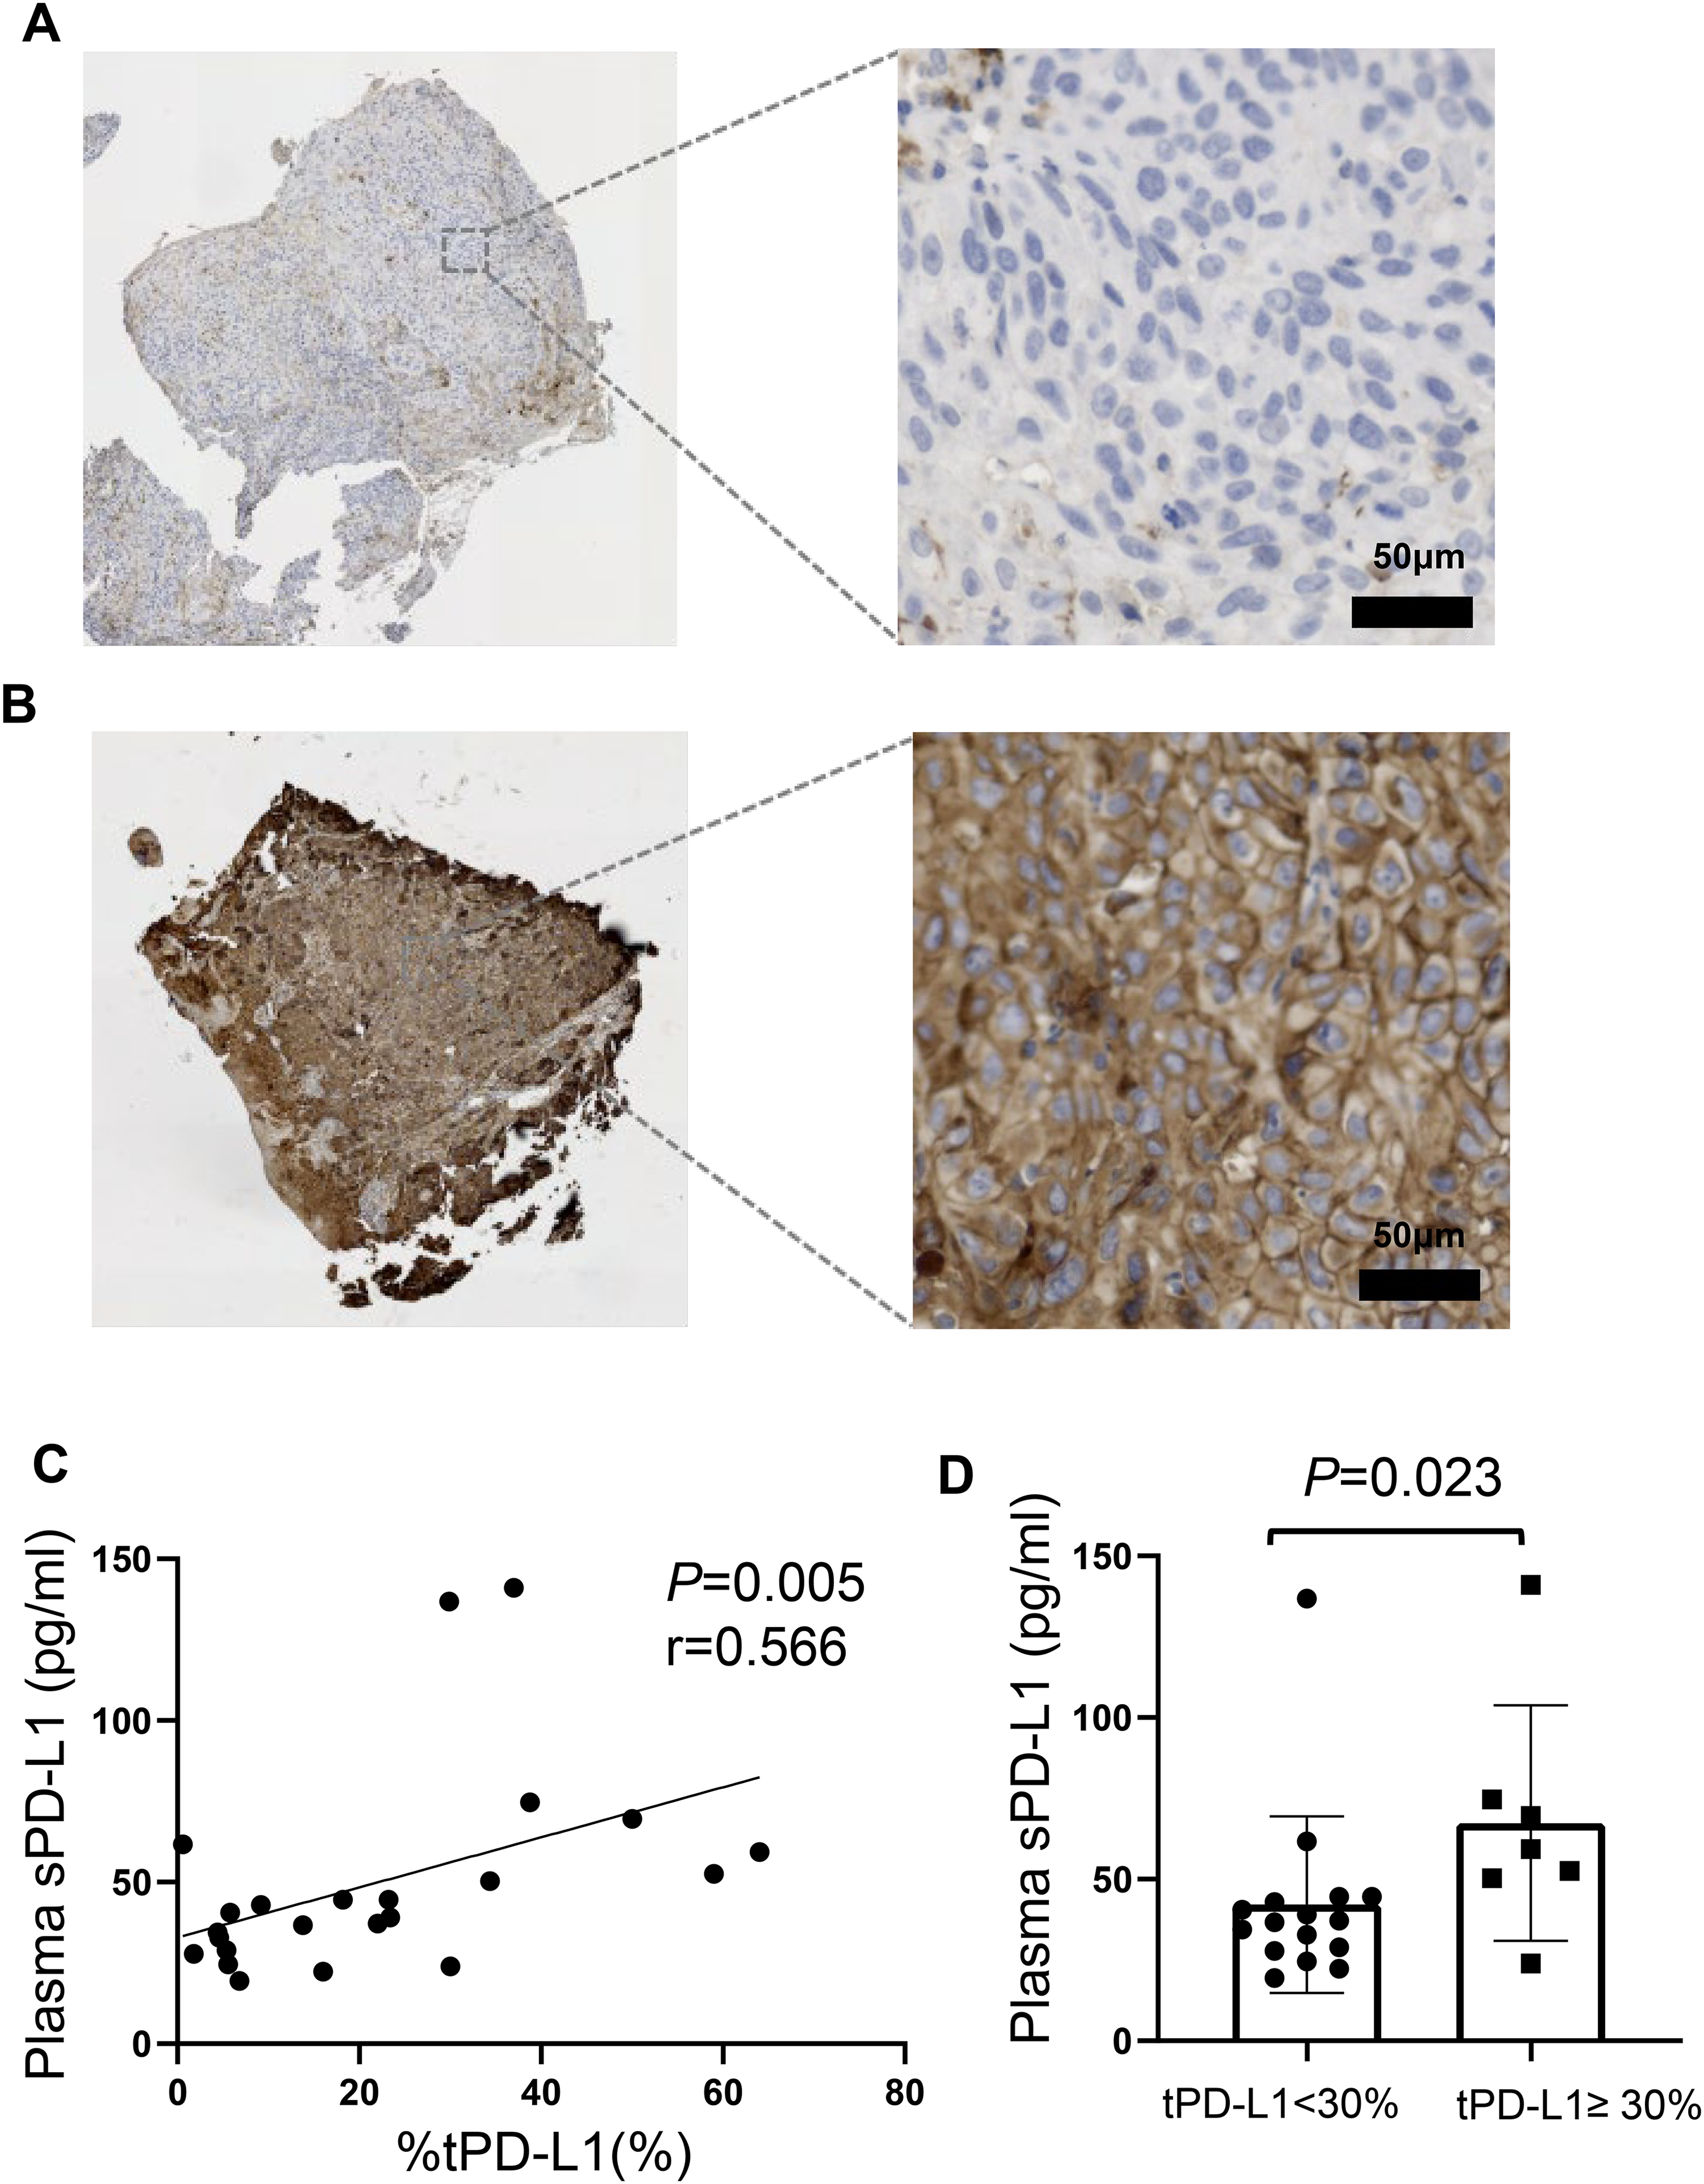
PD-L1 expression in tissue. Representative images from PD-L1-positive (A) and PD-L1-negative (B) cases are presented. (C) The baseline sPD-L1 levels had moderate correlations with PD-L1 in tissue (r = 0.566, P = 0.005). (D) Patients with a high tPD-L1 expression (≥30%) had a higher sPD-L1 concentration (P =0.023).
Association of baseline sPD-L1 levels with clinical features
T stage correlated positively with plasma sPD-L1 level at diagnosis (r = 0.332, P = 0.023; Figure 3A). T4 stage patients showed trends towards a higher plasma sPD-L1 level at diagnosis compared to T1-3 stage patients, but the difference did not reach statistical significance [41.664 (27.817, 68.093) pg/ml vs. 55.691 (46.032, 90.601) pg/ml, P = 0.053; Figure 3B]. There was no association and difference between plasma sPD-L1 level at diagnosis and gender, age, N stage, clinical stage and blood cell counts neither (all P > 0.050).
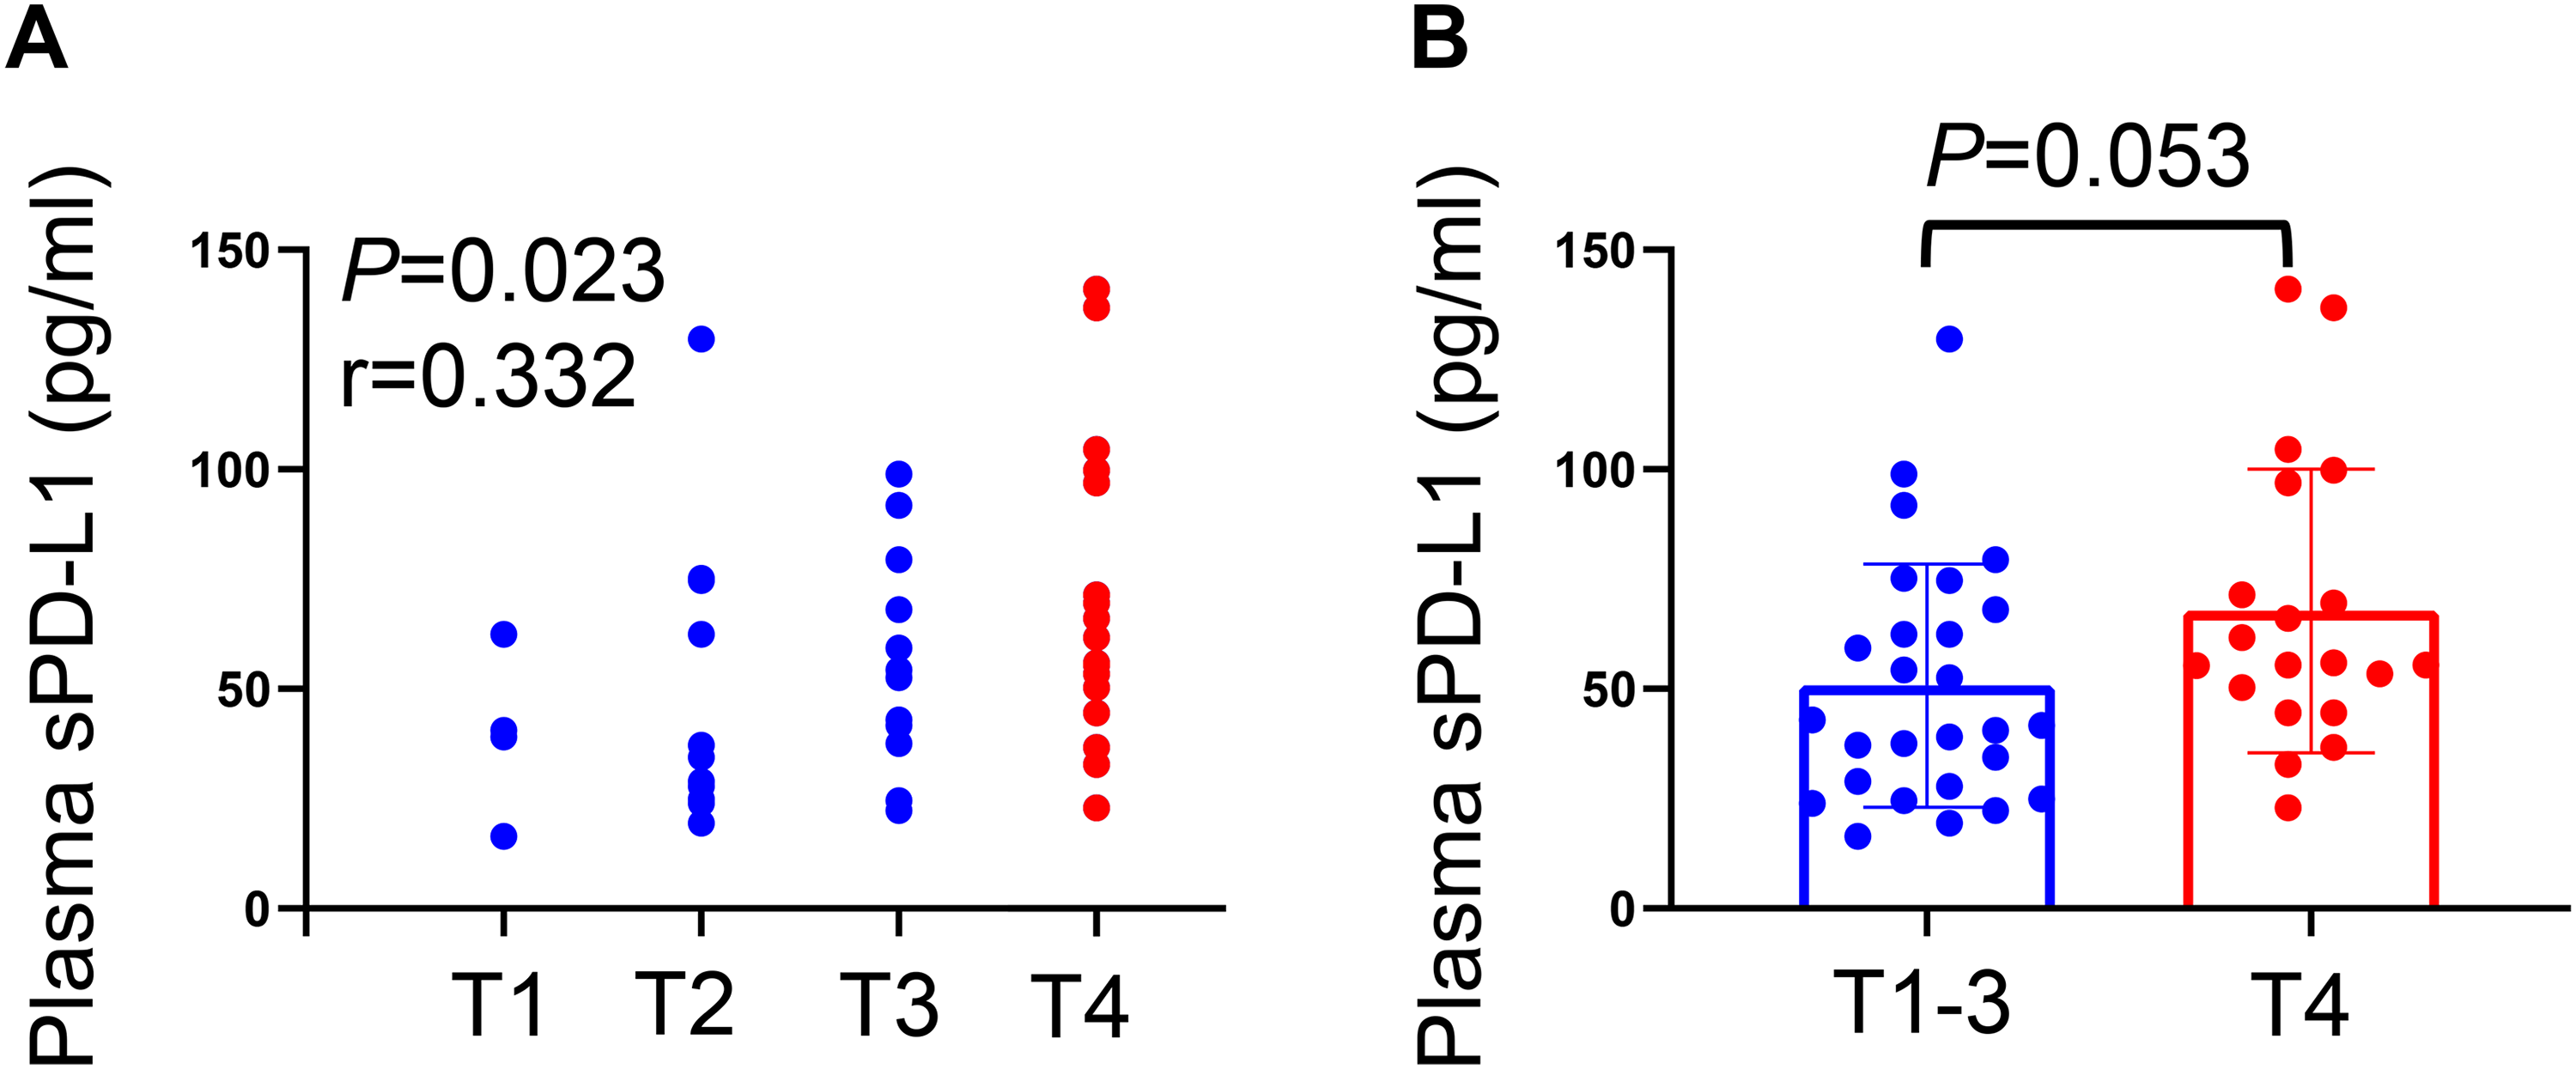
Association between baseline sPD-L1 levels with T stage. (A) T stage correlated positively with baseline sPD-L1 levels (r = 0.332, P = 0.023). (B) T4 stage patients showed trends towards a higher baseline sPD-L1 levels compared to T1-3 stage patients (P = 0.053).
Survival outcomes
The study proved that patients with high sPD-L1 had significantly worse OS than patients with low sPD-L1 (P = 0.038; Figure 4A). Similarly, patients with high tPD-L1 had significantly worse OS than patients with low tPD-L1 (P = 0.047; Figure 4B). Alterations in plasma sPD-L1 levels after RT were observed, where 25 patients decreased and 13 patients increased. The value of plasma sPD-L1 levels for the pro-radiotherapy and post-radiotherapy in decreased group was 55.951 (40.611, 91.785) pg/ml and 32.808 (23.311, 49.140) pg/ml, respectively (P < 0.001). In increased group, it was 38.157 (24.702, 66.672) pg/ml and 52.574 (45.924, 89.730) pg/ml, respectively (P = 0.002; Figure 4D). Kaplan-Meier survival analyses showed no significant difference in OS between decreased group and increased group (P = 0.538; Figure 4E).
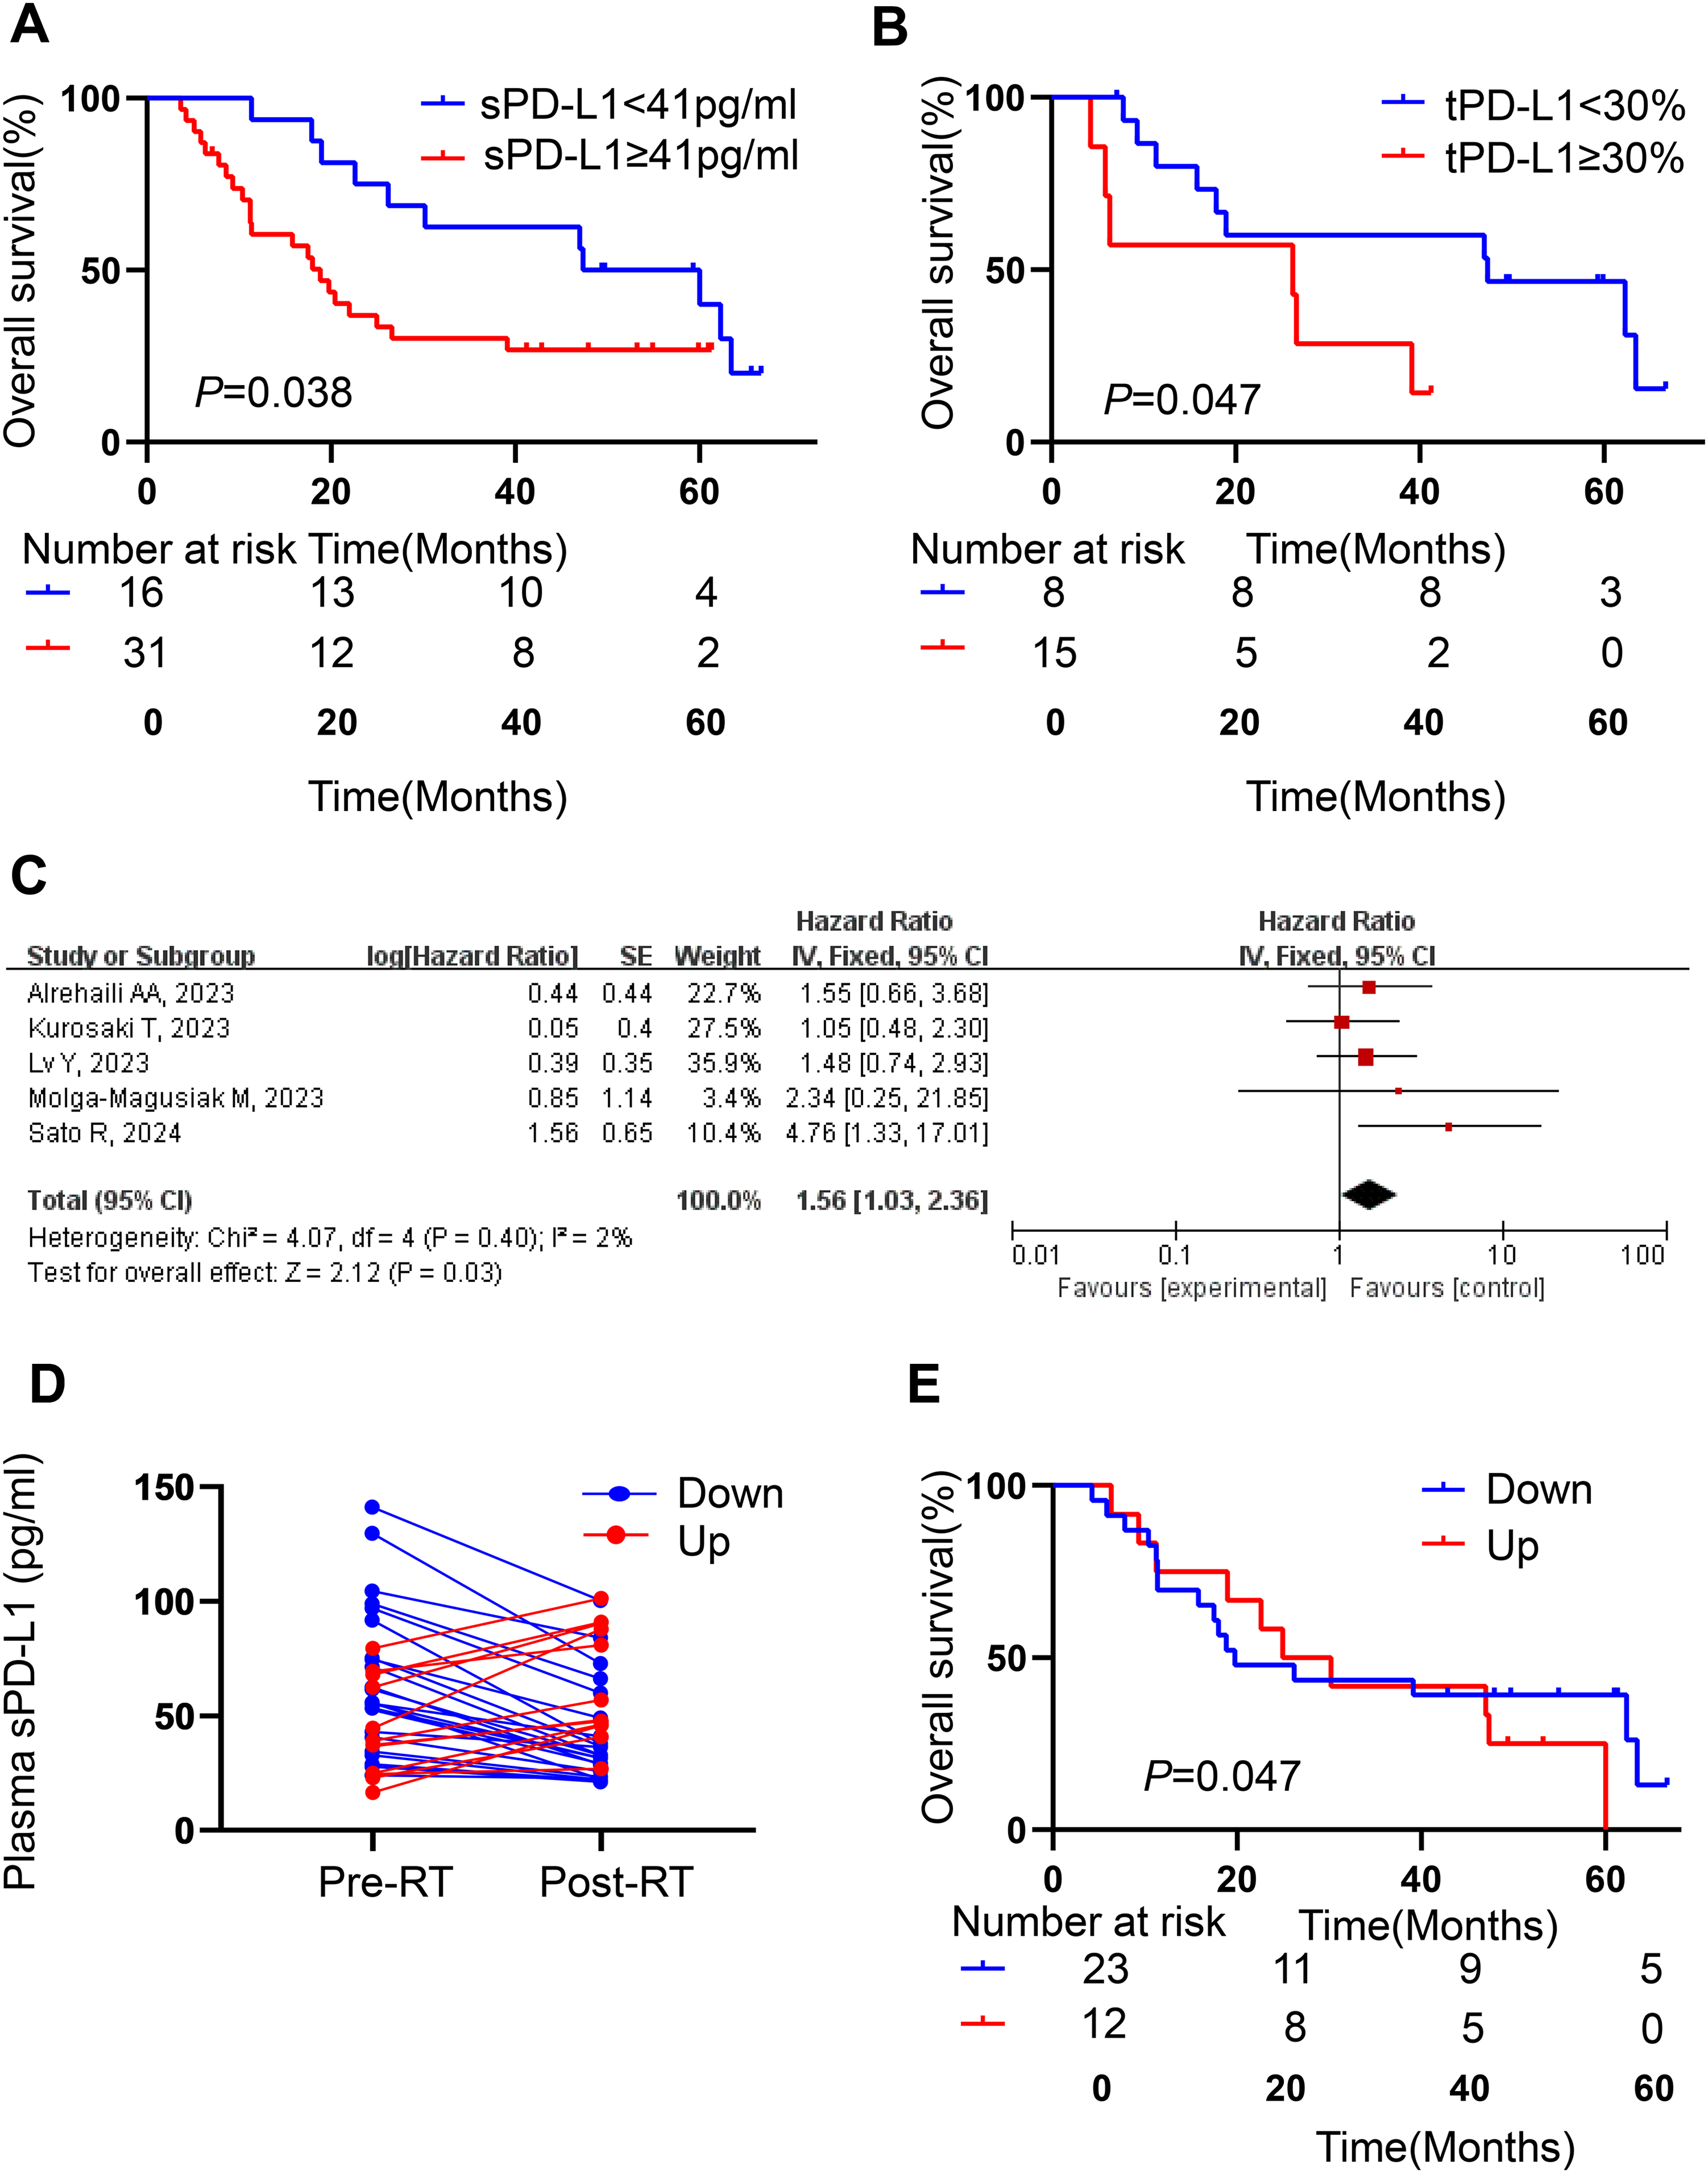
Survival curve and forest plot. (A) High sPD-L1 had significantly worse OS than patients with low sPD-L1 (P =0.038). (B) High tPD-L1 had significantly worse OS than patients with low tPD-L1 (P =0.047). (C) Forest plot of pre-treatment sPD-L1 levels in association with OS. (D) There were 25 patients decreased and 13 patients increased. (E) no significant difference in OS between decreased group and increased group (P = 0.538).
Meta-analysis was used for comprehensive analysis. Five related researches have been published,13,15–18 and there was low heterogeneity (I2 = 2% and Q test P = 0.400). Thus, a fixed-effect model was applied for meta-analysis. The forest map was shown in Figure 4C.
Table 2 shows the results of the univariate and multivariate analysis of prognostic factors associated with OS. Univariate Cox analysis revealed that later T stage, higher sPD-L1 levels and higher expression PD-L1 in tissue were significantly associated with worse OS. Multivariable Cox analysis revealed sPD-L1 levels was the unique independent prognostic factors for OS.
Univariate and multivariate analysis of survival.
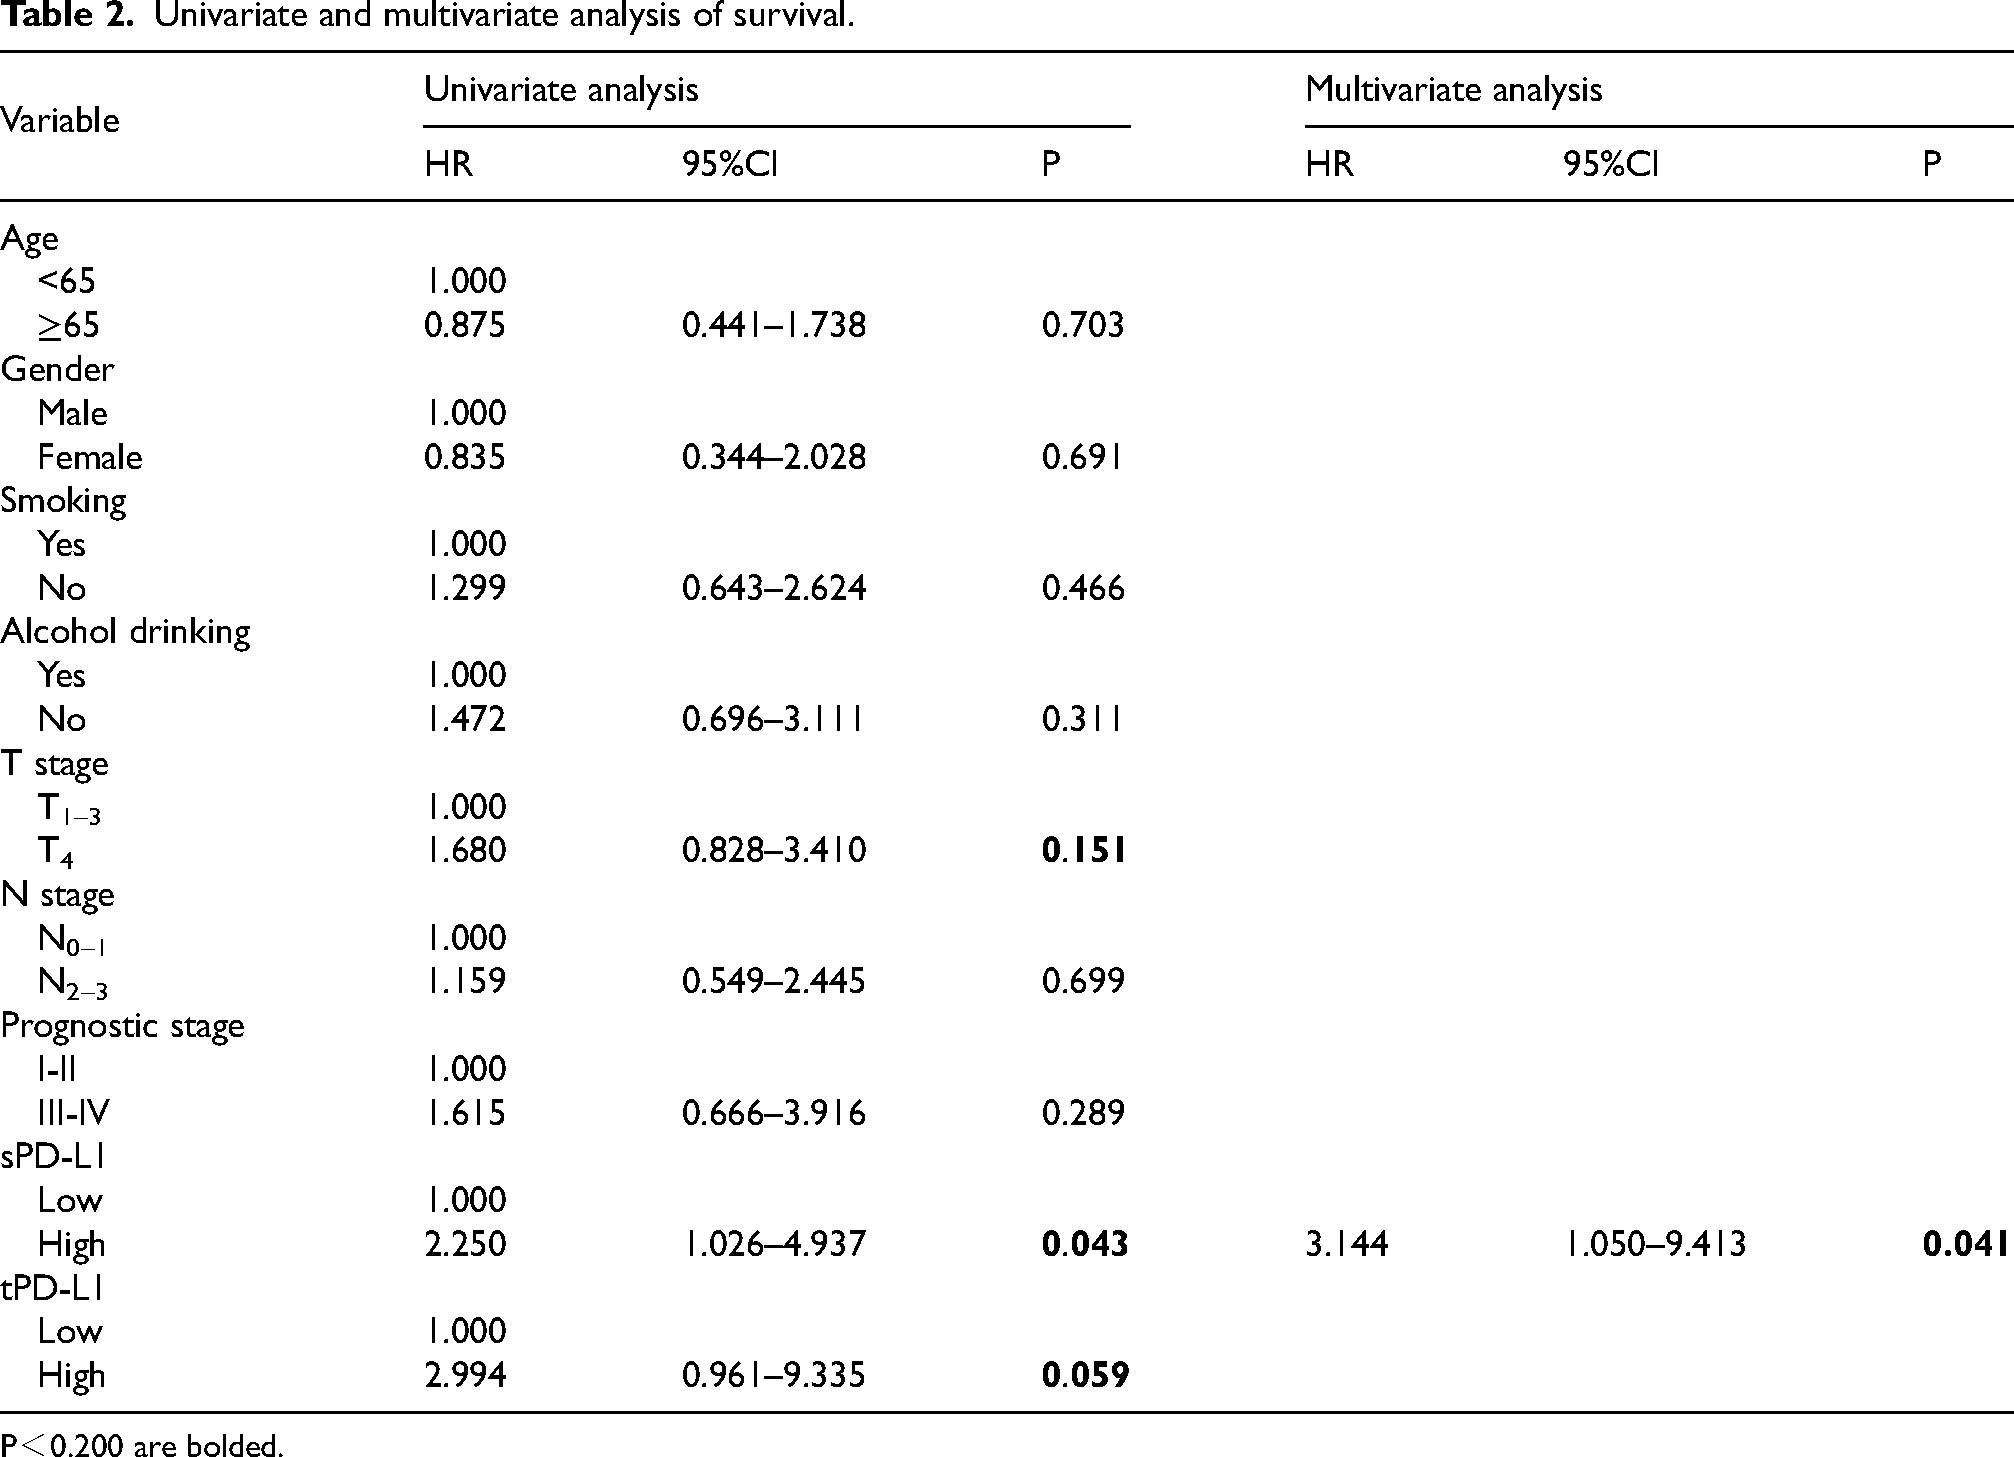
P<0.200 are bolded.
Discussion
Because PD-L1 expression in tumor has gained much attention, the role of sPD-L1 in blood has also gradually aroused attention in various tumors, head and neck cancers are not an exception.13,14,17 The studies focusing on HSCC are few, not to speak of the data before and after RT. Therefore, the study was designed to mine the significance of plasma sPD-L1 in HSCC. Consistent with previous studies of other cancers, the study revealed significantly higher concentrations of sPD-L1 in the plasma of HSCC patients compared with healthy control group.19–22
Furthermore, our study demonstrated that plasma levels of sPD-L1 could reflect the expression of PD-L1 in tumor tissue. Similar observations were identified in Peripheral T-cell lymphoma, hepatocellular carcinoma and so on.20,23 Based on it, it could be speculated that circulating sPD-L1 could be secreted by PD-L1-positive cells, and was predominantly from tumor cell. 24 However, there were also some studies that did not find a correlation. 25 These discrepancies of results may be attributed to different tumor types, the different sensitivity of antibodies and detection methods employed. The concentrations of sPD-L1 significantly differed across the studies. The reasons may be as follows: 1) Different blood samples treatment methods were used in different study centers; 2) Some articles studied with serum while some studies with plasma; 3) Currently, sPD-L1 levels were determined by ELISA, its brands are diverse. Thus, there was strong heterogeneity between the studies. The study found high PD-L1 expression is positively associated with advanced T stage, and T4 stage patients showed trends towards a higher baseline sPD-L1 level compared to T1-3 stage patients, which were similar to the report by Lu et.al. 26 This may predict that high sPD-L1 level was associated with tumor burden, it was a possible prognostic indicator for a poor outcome. In our previous work, we have reported high PD-L1 expression on tumor cell was significantly associated with a poor prognosis in HNSCC. 27 We also observed the same result in this study. In addition, the study showed that high sPD-L1 had significantly worse OS. Hence, not only tPD-L1 but also sPD-L1 was prognosis-associated biomarkers. To further demonstrated that the sPD-L1 served as biomarker of the prognosis for HSCC patients, attempts were made to focus on recently published data. Regrettably, no independent cohort of HSCC patients was found. Thus, the data of HNC patients was collated as circumstantial evidence. Due to the variety of cut-off point for sPD-L1, meta-analysis was used for comprehensive analysis. The results indicated that HNC patients with high sPD-L1 levels have worse OS. Bernstein MB et.al reported that radiation reduced PD-L1 expression by irradiating DU145 and PC3 cells with a single fraction of 10 Gy. 28 And yet, the mainstream view is that RT could upregulate the expression of PD-L1. Preclinical studies demonstrate that RT induces PD-L1 upregulation by 4 pathways, including IFN-γ signaling, EGFR pathway, DNA damage signaling pathway and cGAS-STING pathway. All of these involved via JAK/STAT pathway. 29 However, almost all clinical research revealed that sPD-L1 level increasing in some patients while decreasing in others after RT. Twenty-three cases (65.71%) were decreased group and others were increased groups after RT in our study. Interestingly, survival analysis revealed that no significant difference in the OS between the two groups. This result seems to be contradictory to the role of sPD-L1 (biomarker of poor prognostic). Actually, it is not so. sPD-L1 levels as prognostic indicators refer to baseline (pre-radiotherapy) measurements. The interaction of RT and PD-L1 were influenced by various factors in the human body, so RT can alter sPD-L1 levels. However, RT is not the only interfering factor that causes changes in sPD-L1 levels. The study only shows that the level of sPD-L1 at baseline indicates good or bad prognosis, but not means that the level of sPD-L1 at any time is equal to the outcome. Thus, it is not contradictory.
To our knowledge, the study is the first prospective study specially evaluating the sPD-L1 levels in HSCC patients before and after RT. Several limitations of this study should be discussed. First, this was a small sample size and single-center study, selection bias might be present. Studies are needed to further validate the findings in independent patient cohorts from different geographical regions and treatment centers. Because of the limitation of sample size, we could not use 1% or 50% as cut-off value of tPD-L1 as used in clinical trials. Thus, we selected 30% as cut-off value based on the actual situation of the cohort.
Second, in addition to sPD-L1, other biomarkers, such as lymphocyte activation gene-3 (LAG3), T cell immunoglobulin and mucin-domain containing 3 (TIM3), T cell immunoglobulin and ITIM domain (TIGIT), and circulating tumor cells, have also been found to predict the prognosis.30–33 Further study could combine sPD-L1 with other biomarkers to develop a comprehensive biomarker panel for better prediction of patient outcomes.
Conclusions
In conclusion, sPD-L1 can be detectable in the plasma of HSCC and a positive association between sPD-L1 levels before RT and T stage. Besides, not only tPD-L1 but also sPD-L1 was prognosis-associated biomarkers.
Supplemental Material
sj-docx-1-cbm-10.1177_18758592251343041 - Supplemental material for The change of soluble programmed cell death ligand-1 (sPD-L1): A new predictor of prognosis in hypopharyngeal squamous cell carcinoma patients treated with radiotherapy
Supplemental material, sj-docx-1-cbm-10.1177_18758592251343041 for The change of soluble programmed cell death ligand-1 (sPD-L1): A new predictor of prognosis in hypopharyngeal squamous cell carcinoma patients treated with radiotherapy by Zihan Zhou, Xingchen Ding, Xinbin Bai, Jia Yang, Jin Xu, Juan Xu, Yunhao Chen, Shumei Jiang and Man Hu in Cancer Biomarkers
Footnotes
Ethical considerations and consent to participate
The study complied with the principles set forth in the Declaration of Helsinki. It was approved by the Institutional Review Board of Shandong Cancer Hospital and Institute, Shandong First Medical University and Shandong Academy of Medical Sciences. Written informed consent was obtained from each patient.
Consent for publication
Written informed consents were obtained from all patients for the publication of this report.
Authors’ contributions
Conception: MH and XCD
Interpretation or Analysis of Data: ZHZ, XBB, JY, JX, JX, YHC
Preparation of the Manuscript: ZHZ and XCD
Revision for important intellectual content: ZHZ, SMJ and MH
Supervision: MH, SMJ and XCD
Funding
The authors disclosed receipt of the following financial support for the research, authorship, and/or publication of this article: This work was funded by National Natural Science Foundation of China (No. 82202958, 82272751), Higher Educational Institutions Youth Innovation Science and Technology Support Program of Shandong Province (2023KJL004), National Natural Science Foundation of Shandong Province (ZR2021LSW002), Science Technology Program of Jinan (No. 202225013, 202225019) and China Postdoctoral Science Foundation (2023M734299).
Declaration of conflicting interests
The authors declared no potential conflicts of interest with respect to the research, authorship, and/or publication of this article. The part of the data was presented at Master thesis in Jinan university.
Data availability statement
The data that support the findings of this study are available on request from the corresponding author.
Supplemental material
Supplemental material for this article is available online.
References
Supplementary Material
Please find the following supplemental material available below.
For Open Access articles published under a Creative Commons License, all supplemental material carries the same license as the article it is associated with.
For non-Open Access articles published, all supplemental material carries a non-exclusive license, and permission requests for re-use of supplemental material or any part of supplemental material shall be sent directly to the copyright owner as specified in the copyright notice associated with the article.