
Abstract
Background
Non-invasive methods with universal prognostic guidance for detecting breast cancer (BC) survival biomarkers need to be further explored.
Objective
This study aimed to investigate C-C motif chemokine receptor type 5 (CCR5) prognosis value in BC and develop a radiomics model for noninvasive prediction of CCR5 expression in BC.
Methods
A total of 840 cases with genomic information were included and divided into CCR5 high- and low-expression groups for clinical characteristic differences exploration. Bioinformatics and survival analysis including Kaplan-Meier (KM) survival analysis, Cox regression, immunoinfiltration analysis, and tumor mutation load (TMB) were performed. For radiomics model development, 98 cases with dynamic contrast-enhancement magnetic resonance imaging (DCE-MRI) scans were used. Radiomics features extracted were using Pyradiomics and filtered by maximum-relevance minimum-redundancy (mRMR) and recursive feature elimination (REF) algorithms. Support vector machine (SVM) and logistic regression (LR) models were developed to predict CCR5 expression, with the radiomics score (Rad_score) representing the predicted probability of CCR5 expression. The models’ performance was compared using the Delong test, and the model with the superior area under the curve (AUC) values was selected to analyze the correlation between CCR5 expression, Rad_score, and immune genes.
Results
The CCR5 high-expression group exhibited better overall survival (OS) (p < 0.01). Six radiomics features were selected for model development. The AUCs of the SVM model predicting CCR5 were 0.753 and 0.748 in the training and validation sets, respectively, while the AUCs of the LR model were 0.763 and 0.762. Calibration curves and decision curve analysis (DCA) validated the models’ calibration and clinical utility. The SVM_Rad_score showed a strong association with immune-related genes.
Conclusions
The DCE-MRI radiomics model presents a novel, non-invasive tool for predicting CCR5 expression in BC and provides valuable insights to inform clinical decision-making.
Introduction
Breast cancer (BC) is the most common malignancy among women worldwide. According to the latest global cancer statistics in 2022, 1 there are approximately 2.32 million new cases of BC and approximately 670,000 deaths annually. Survival rates for BC vary greatly between countries, with developed nations showing an 80% estimated 5-year survival rate, compared to less than 40% in developing countries. 2 To reduce mortality, primary treatments for BC include mastectomy, radiation therapy, chemotherapy and immunotherapy.3,4 BC is a heterogeneous disease, 5 with clinical and molecular specificity. However, traditional biomarkers such as CEA, HER-2, CA199, and others do not fully align with the requirements of prognosis and precision medicine in clinical settings. Therefore, there is an urgent need to identify and explore new biomarkers with potential prognostic value.
Currently, extensive research has been conducted on immunotherapy 6 and targeted therapies7,8 for BC, as well as on prognostic biomarkers9,10 that demonstrate significant potential for improving treatment and prognosis. Immune cells within the tumor microenvironment (TME) are recognized for their vital role in tumor diagnosis and prognosis, and have become a focal point in recent years.11,12 The involvement of immune-related genes and cells is crucial in the development and outcome of various types of BC.13–16 In recent years, bioinformatics has emerged as a critical tool in cancer research, particularly in the study of BC. For instance, it facilitates immune cell infiltration analysis using tools such as CIBERSORTx 17 and enables the identification of immune-related prognostic biomarkers in BC through RNA-seq data analysis. 18 Among them, C-C motif chemokine receptor Type 5 (CCR5), a member of the beta-chemokine receptor family, is expressed on immune cells such as T cells and macrophages. 19 Some studies indicate that CCR5 enhances T-cell responses to tumors by regulating the activation of helper-dependent CD8+ T cells and NK cells.20,21 Activated CD8+ T cells recruit macrophages to the tumor and surrounding areas through CCR5 signaling. 22 Evidence suggests that CCR5 plays a significant role in tumor immunity 23 and targeted therapy 24 for BC. Therefore, this research proposes that CCR5 levels could serve as a valuable prognostic marker for individuals with BC. 25
Currently, the expression of CCR5 in tumors can only be assessed through invasive biopsy or surgical resection. However, locally puncture examination can only provide information about a part of the tumor, rather than the entire tumor. Intra- and intertumoral heterogeneity significantly contributes to the poor prognosis of BC patients. 26 There is a lack of non-invasive methods with universal prognostic values for detecting survival markers. Mammography and ultrasound, as non-invasive imaging techniques, have limited sensitivity and specificity in detecting lesions and distinguishing between malignant and benign cases. In contrast, dynamic contrast-enhanced magnetic resonance imaging (DCE-MRI) offers high-resolution imaging, making it the most sensitive and specific diagnostic tool available. It is widely used as a standard method for routine BC diagnosis and is accessible to most patients. 27 Studies have also shown that radiomics features from DCE-MRI provide superior predictive performance for BC than T2-weighted imaging (T2WI) and diffusion-weighted imaging (DWI).27,28 The application of artificial intelligence in imaging is leading to significant advancements, and one notable technique is Radiomics. 29 Radiomics utilize advanced computational methods to convert medical images into extensive quantitative descriptors of tumor tissue, enabling non-invasive and dynamic detection and quantitative assessment of tumor characteristics. Previous research has demonstrated the efficiency of DCE-MRI radiomics in the early detection and classification of BC, as well as in evaluating residual abnormalities, lymph node involvement, tumor heterogeneity, and the TME.27,30
This study aims to predict the CCR5 expression in BC using DCE-MRI radiomics models and to evaluate its clinical predictive value. Additionally, bioinformatics will be utilized to analyze the relationship between CCR5 expression and prognosis, exploring its role in regulating the tumor immune microenvironment and provide valuable insights for clinical decision-making.
Materials and methods
Data collection and processing
Altogether, 1097 BC bioinformatic datasets were obtained from The Cancer Genomic Atlas (TCGA) database (https://portal.gdc.cancer.gov). After excluding datasets based on the following criteria: non-primary BC samples (n = 15), lack of survival data or survival time under 30 days (n = 50), male gender (n = 12), Tx stage (n = 3), missing clinical variables (n = 137), and absence of primary solid tumor and RNA-seq data (n = 40), 840 cases were included in the study.
Imaging data of all BC patients (n = 137) were obtained from The Cancer Imaging Archive (TCIA) database (http://www.cancerimagingarchive.net/). Of these, 98 cases were included in the development of radiomics. The exclusion criteria for radiomics datasets were poor image quality due to motion artifact or metal artifact, missing images (n = 29), and absence of TCGA-BC data (n = 10). Table S1 contains the concise inclusion/exclusion criteria.
Data processing and differential expression analysis
CCR5 has no prior cutoff value. The R package ‘survminer’ based on the principle of minimum p-value was utilized to determine the cutoff value for CCR5 expression levels.31,32 The Xiantao tool (https://www.xiantao.love/products) 33 was employed to analyze gene expression patterns across different tissues. RNA-seq data in Fragments Per Kilobase of exon model per Million mapped fragments (FPKM) format from TCGA and Genotype-Tissue Expression project (GTEx)database (https://gtexportal.org/) were pre-processed using the Toil process, 34 sourced from UCSC Xena (https://xenabrowser.net/datapages/). Following the log2 transformation of FPKM format RNA-seq data, differential expression analysis of CCR5 across samples was performed.
Survival analysis
Overall survival (OS) is regarded as the gold standard for oncology drug approval. It serves as a clinically meaningful and objective measure for assessing the safety and efficacy of treatments. 35 Survival analysis across different groups was conducted using Kaplan-Meier (KM) curves and log-rank tests. Additionally, the Schoenfeld residuals test was employed to assess the validity of the proportional hazards assumption (Figure S1). Univariate Cox regression was utilized to identify factors influencing OS. Multivariate Cox regression was used to assess independent predictors of OS. Exploratory subgroup analysis involved univariate Cox regression to evaluate the impact of CCR5 expression on patient prognosis within each covariate subgroup. The interaction between CCR5 expression and other covariates was examined using the likelihood ratio test.
Immune cell infiltration, immune genes, and enrichment analysis between CCR5 high- and low-expression groups
The gene expression matrix for BC samples was uploaded to the CIBERSORTx database (https://cibersortx.stanford.edu/) to calculate the immune cell infiltration for each sample. Spearman correlation tests were utilized to examine the relationship between CCR5 expression and clinical features, as well as immune cell infiltration.
The tumor mutation burden (TMB) can help identify cancer patients who may benefit from immune checkpoint inhibitors. 36 The Wilcoxon test was employed to analyze variations in immune gene expression and TMB between CCR5 high- and low-expression groups using Mutation Annotation Format (MAF) data from the TCGA-BC database. The R-package ‘limma’ was utilized for these analyses. 37 Additionally, Gene Set Enrichment Analysis (GSEA) was performed using the R package ‘clusterProfiler’ with the Hallmark (h.all.7.5.1.Symbols.GMT) and KEGG38–40 (c2.Cp.KEGG.7.5.1.Symbols.GMT) gene sets.
Radiomics analysis
Screening of radiomics features and models development
Figure 1 illustrates the radiomics analysis procedure. After one radiologist (observer Z, M.Z., with 16 years of experience) completed the image segmentation sketch, another radiologist (observer W, H.Y., with 16 years of experience) repeated the sketch on 30 samples randomly selected by the “random number table method”. Both radiologists manually segmented the volume of interest (VOI) in each image using 3D Slicer software (version 4.10.2), incorporating both plain and DCE-MRI images for a comprehensive evaluation. The lesion location was determined by adjusting the window width and position. Bilateral comparisons were conducted to identify abnormal soft tissue masses, structural changes, varying signal intensities, and abnormal enhancement areas to confirm the tumor area. Subsequently, 107 radiomics features were extracted from DCE-MRI images using Pyradiomics package based on Python (3.9.0), including 14 shape, 18 first-order, and 75 texture features. First-order features described the distribution of signal intensity for each voxel, while texture features described the spatial relationship between voxels, reflecting the heterogeneity of signal intensity within the lesion. Inter-observer consistency of radiomics features was evaluated using the intra-class correlation coefficient (ICC) with the R package ‘irr’. A total of 103 radiomics features were obtained, with ICC values exceeding 0.75. The data were randomly divided into training and validation sets in a 7:3 ratio, and differences between the two groups were compared using the R packages ‘caret’ and ‘CBCgrps’.
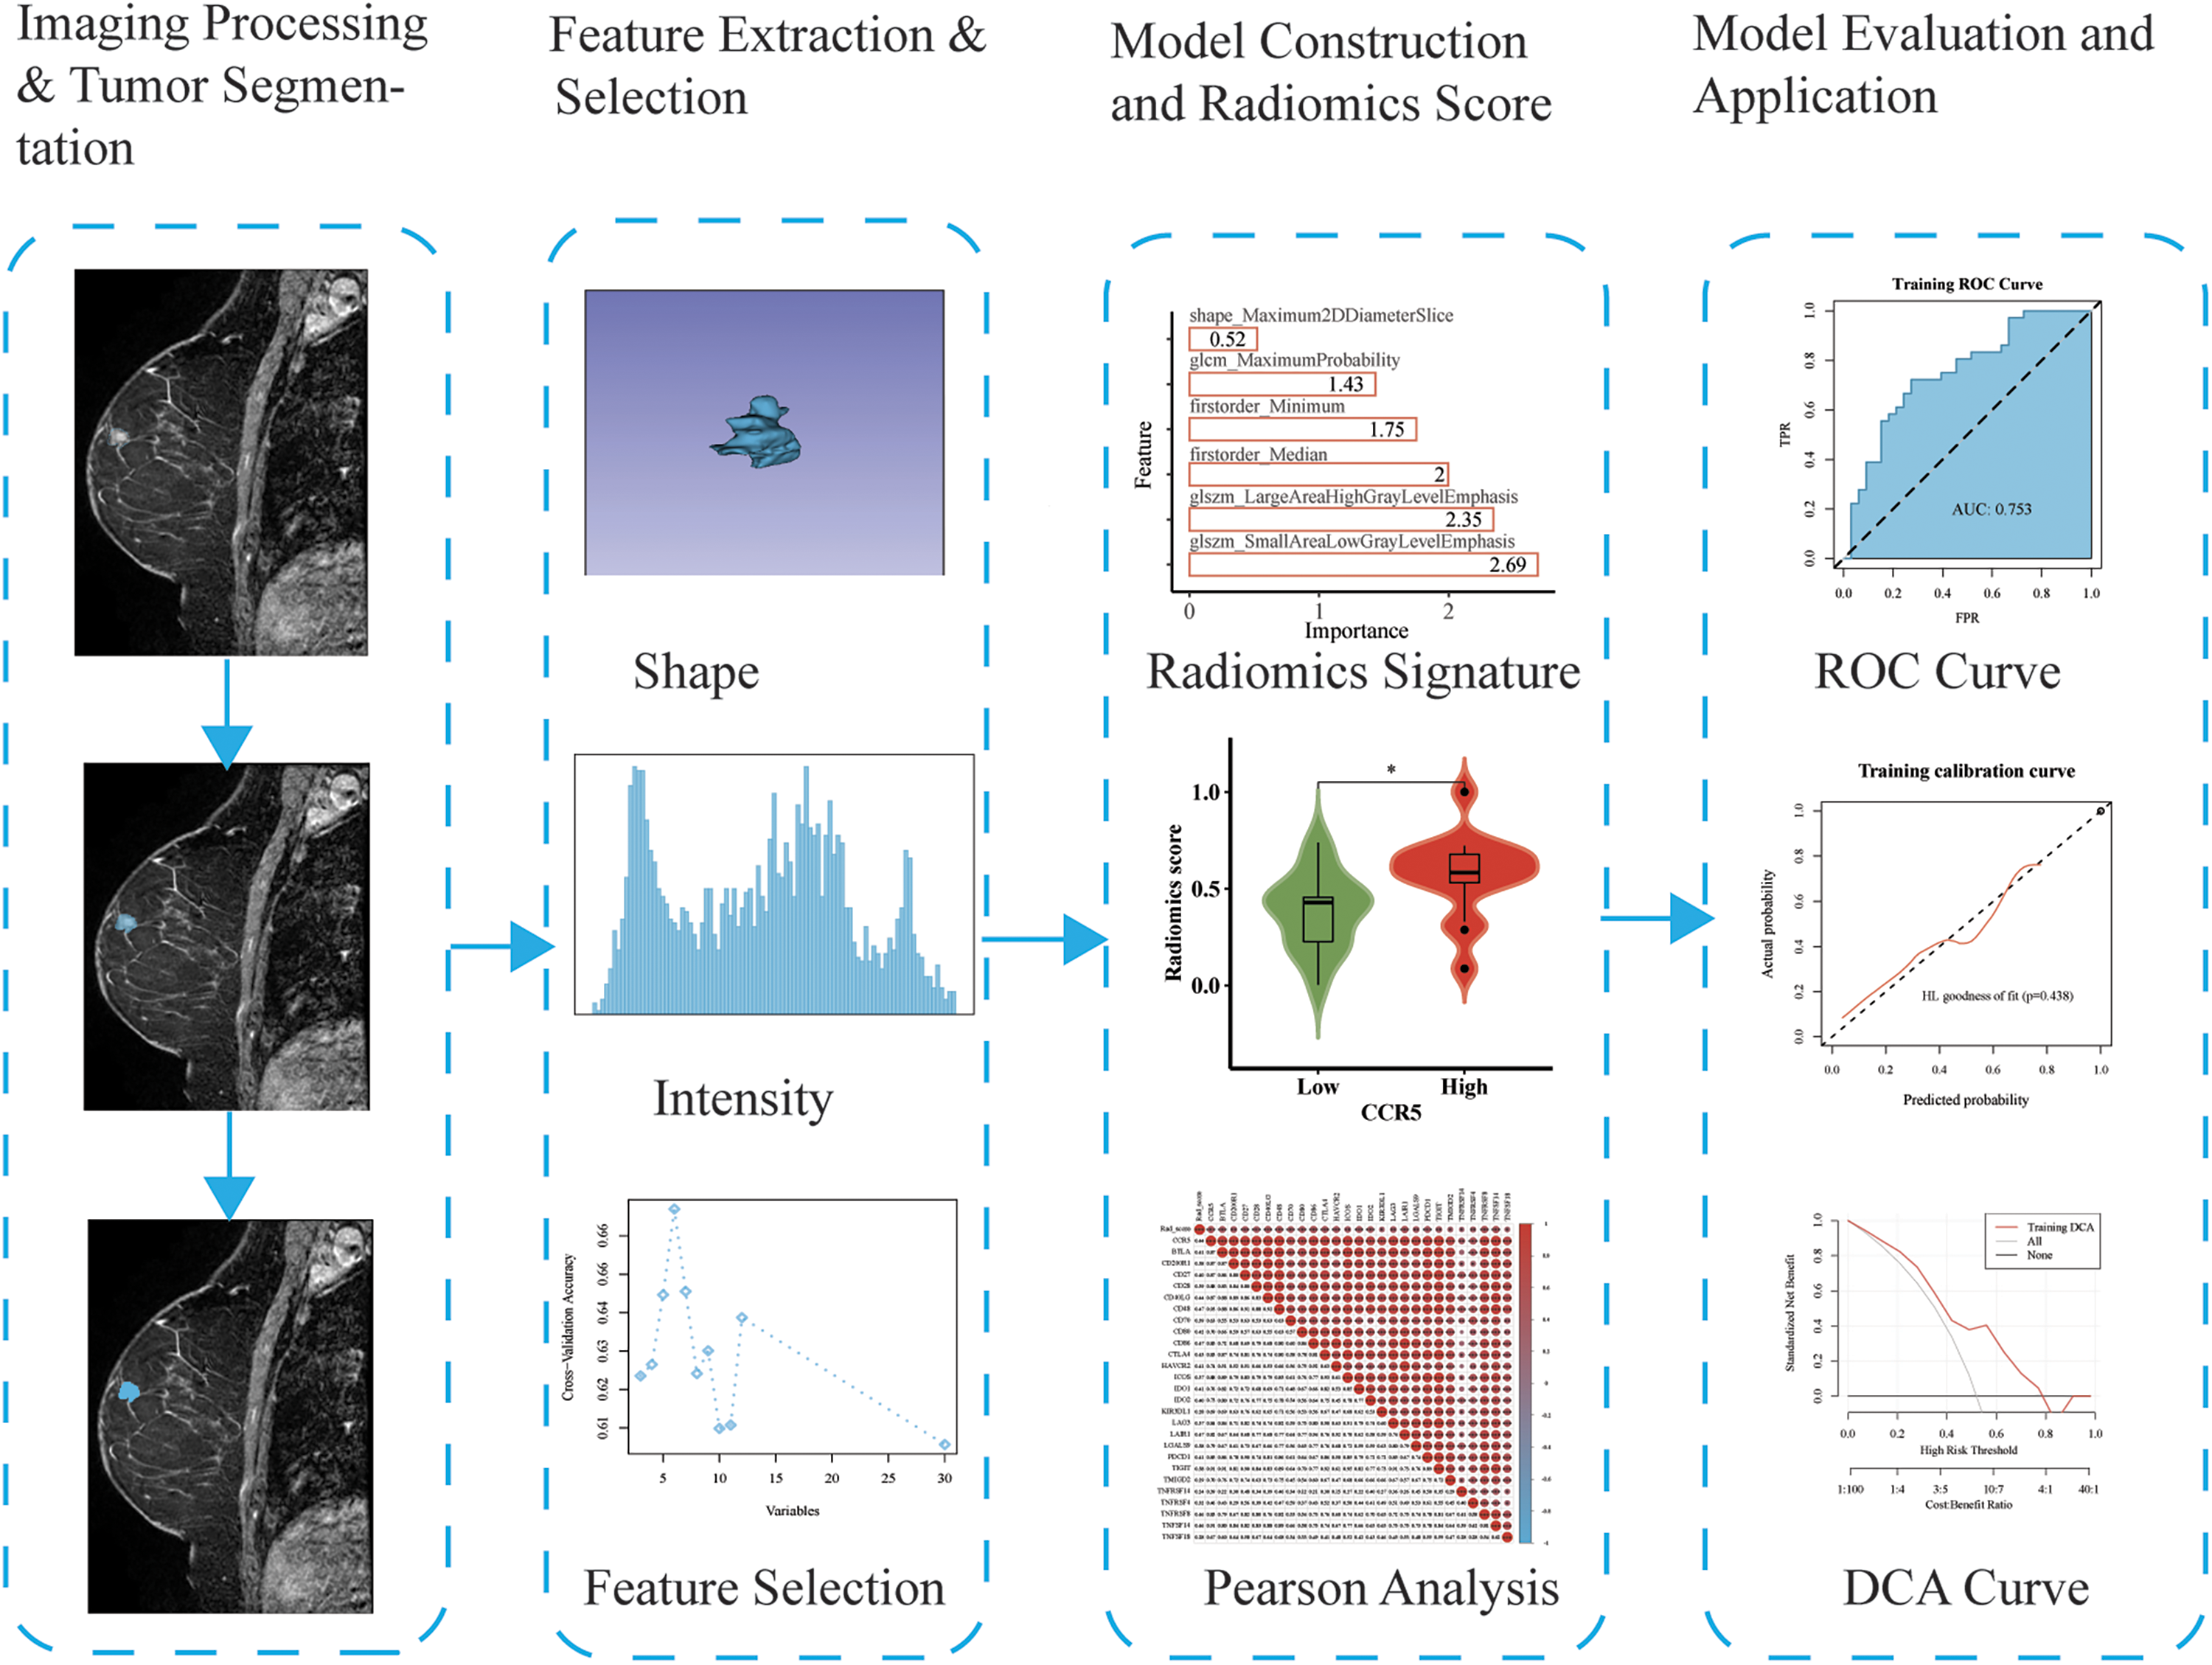
The flowchart of radiomics progression.
Prior to the modeling process, the maximum-relevance minimum-redundancy (mRMR) algorithm was employed to filter features, aiming to maximize correlation while minimizing redundancy. This method helps maximize the relevance of features to the target variable while minimizing redundancy among them, effectively reducing issues related to multicollinearity. The mRMR algorithm, implemented via the R package ‘mRMRe’, filtered down to the top 30 features. Subsequently, this subset underwent further refinement through recursive feature elimination (RFE) using the ‘caret’ R package. RFE iteratively trains the model, removing less important features at each step to eliminate irrelevant or redundant variables. This process ultimately selects the optimal feature subset, further reducing the risk of overfitting or overlooking feature interactions.
This study employed two of the most commonly used machine learning algorithms, Logistic Regression (LR) and Support Vector Machine (SVM), to construct radiomics models.41–43 SVM effectively handles non-linear relationships between features by utilizing kernel functions to map the data into a higher-dimensional space, 44 while LR considers the interactions between linear features during model training. 45 For the training set, the ‘caret’ R package was utilized to build a SVM model based on the above filtered radiomics features to predict gene expression. Additionally, a binary classification model was developed using the ‘stats’ R package to predict gene expression by filtrated radiomics features with the LR algorithm. The model with the best performance was selected, and the radiomics score (Rad_score), defined as the probability of predicting expression of CCR5, was computed.
Evaluation of SMV and LR models and correlation analysis of Rad_score and immune genes
The performance of the models was evaluated using both training and validation datasets. The evaluation metrics included accuracy (ACC), specificity (SPE), sensitivity (SEN), positive predictive value (PPV), and negative predictive value (NPV). A higher receiver operating characteristic area under the curve (ROC-AUC) value indicates better model performance. Calibration of the radiomics prediction model was assessed through the calibration curve and the Hosmer-Lemeshow (HL) goodness-of-fit test. The Brier score, with smaller values indicating better predictive consistency, was used to quantify overall model performance. Additionally, a decision curve analysis (DCA) was conducted to illustrate the practical utility of the radiomics models. Statistical analyses were carried out using the R packages ‘pROC’, ‘ResourceSelection’, ‘rms’, and ‘rmda’.
The Wilcoxon test was employed to evaluate differences in Rad_score between the CCR5 high- and low-expression groups. The DeLong test was used to compare the AUC values of the training and validation sets. The ‘stats’ Package was used to predict the correlation between Rad_score, CCR5, and immune genes by using the SVM radiomics model. 37
Statistical analysis
The tools, software and related standards used in each analysis step are listed in Table S2. Statistical analysis was performed using R software (version 4.1.0). Visualization was facilitated through the R packages ‘ggplot2’, ‘corrplot’, and ‘ggpubr’. Numerical data are presented as mean ± standard deviation, while categorical data are expressed as relative frequencies and percentages. Spearman's rank correlation tests were used to analyze the relationships between variables. A p-value of less than 0.05 was considered statistically significant. Significance levels are denoted as ns for p ≥ 0.05, * for p < 0.05, ** for p < 0.01, and *** for p < 0.001.
Ethics declaration
All subjects at TCGA and TCIA datasets had obtained informed consent and ethical approval in accordance with the Declaration of Helsinki in the original study. Therefore, additional ethical and informed consent was exempted from this retrospective study.
Results
Patient characteristics
840 patients from the TCGA database were categorized into a CCR5 high-expression group (n = 406) and a CCR5 low-expression group (n = 434), based on a cutoff value of 1.90149. There were no significant differences in clinical factors between the two groups, except for ER status, radiotherapy, and chemotherapy (p < 0.05) (Table 1).
Clinical characteristics of the population with high and low CCR5 expression group.
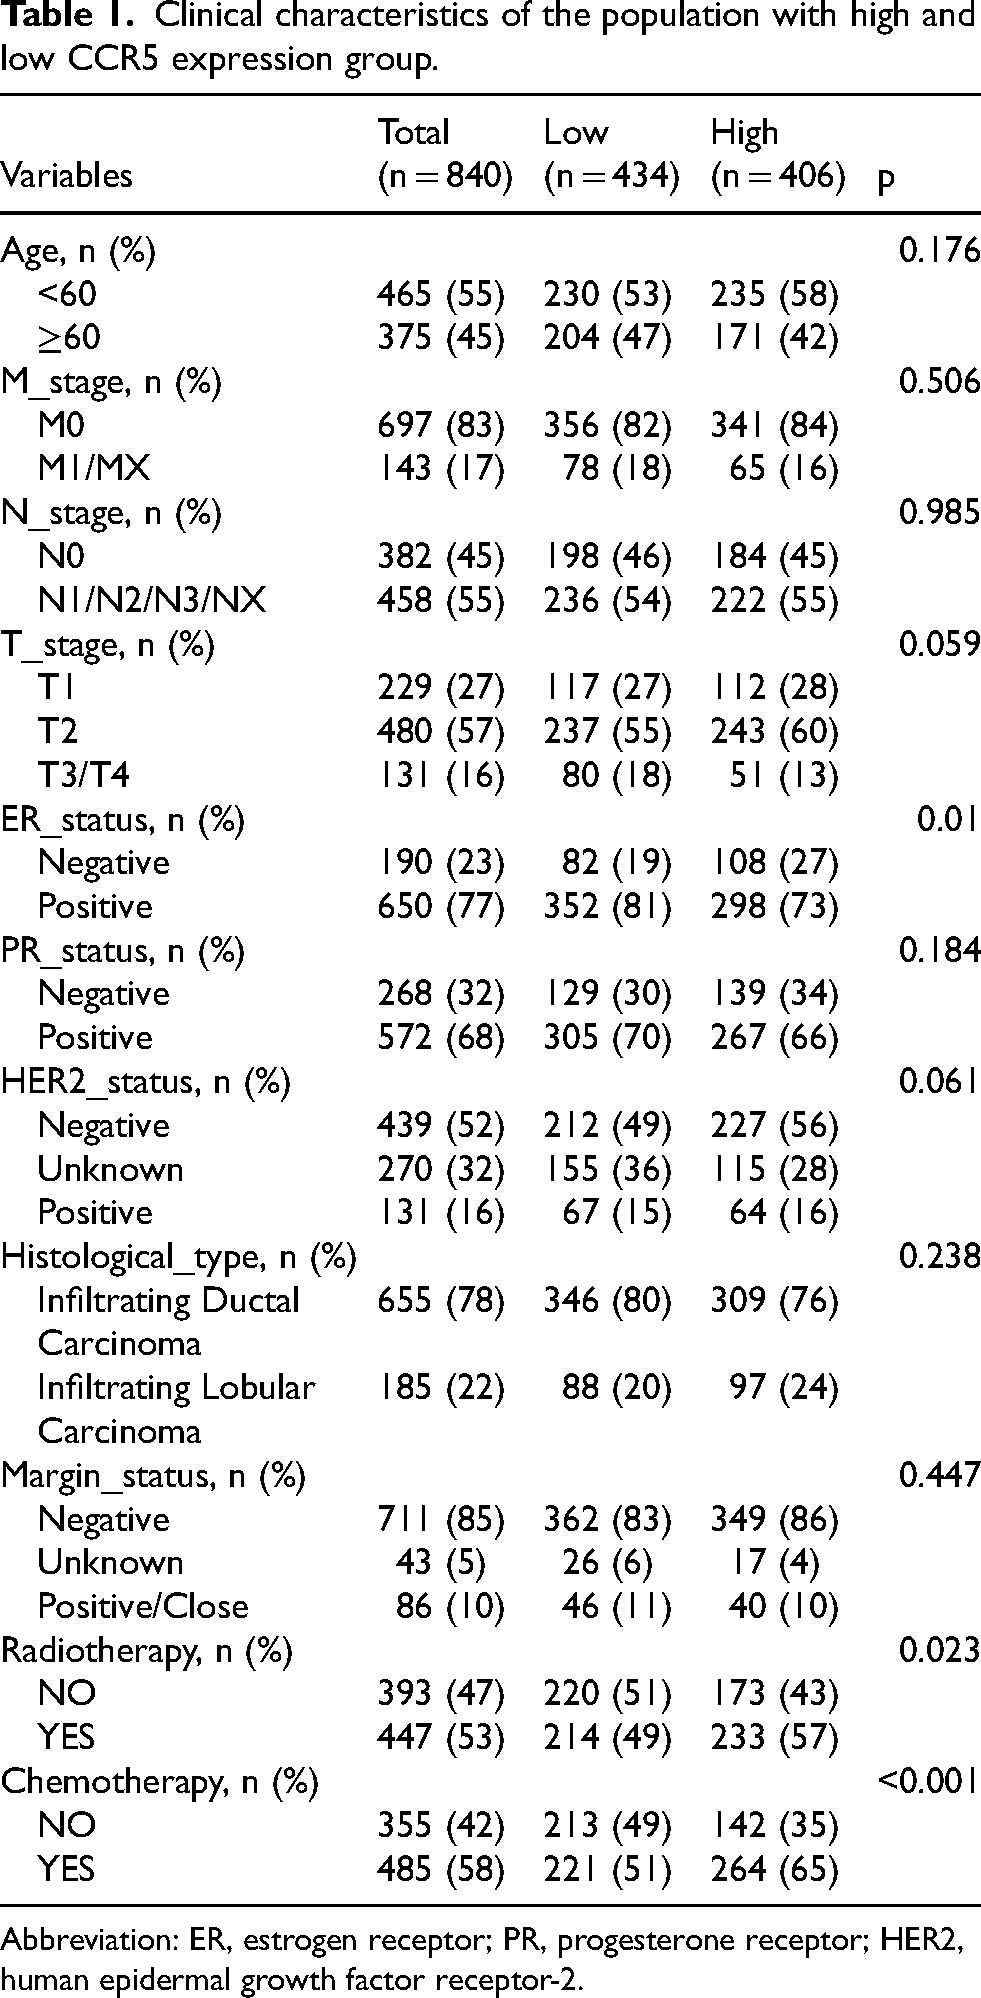
Abbreviation: ER, estrogen receptor; PR, progesterone receptor; HER2, human epidermal growth factor receptor-2.
Association between CCR5 gene expression level and clinical characteristics
In the tumor group, CCR5 expression was significantly higher compared to the normal group (p < 0.001) (Figure 2(a)). KM analysis revealed that individuals with high CCR5 levels had longer OS compared to those with low CCR5 levels, with median OS durations of 219.77 months and 130.87 months, respectively (p = 0.005) (Figure 2(b)). Additionally, factors such as age, N stage, M stage, margin status, chemotherapy, and radiotherapy were significantly associated with OS (p < 0.05) (Figure S2).
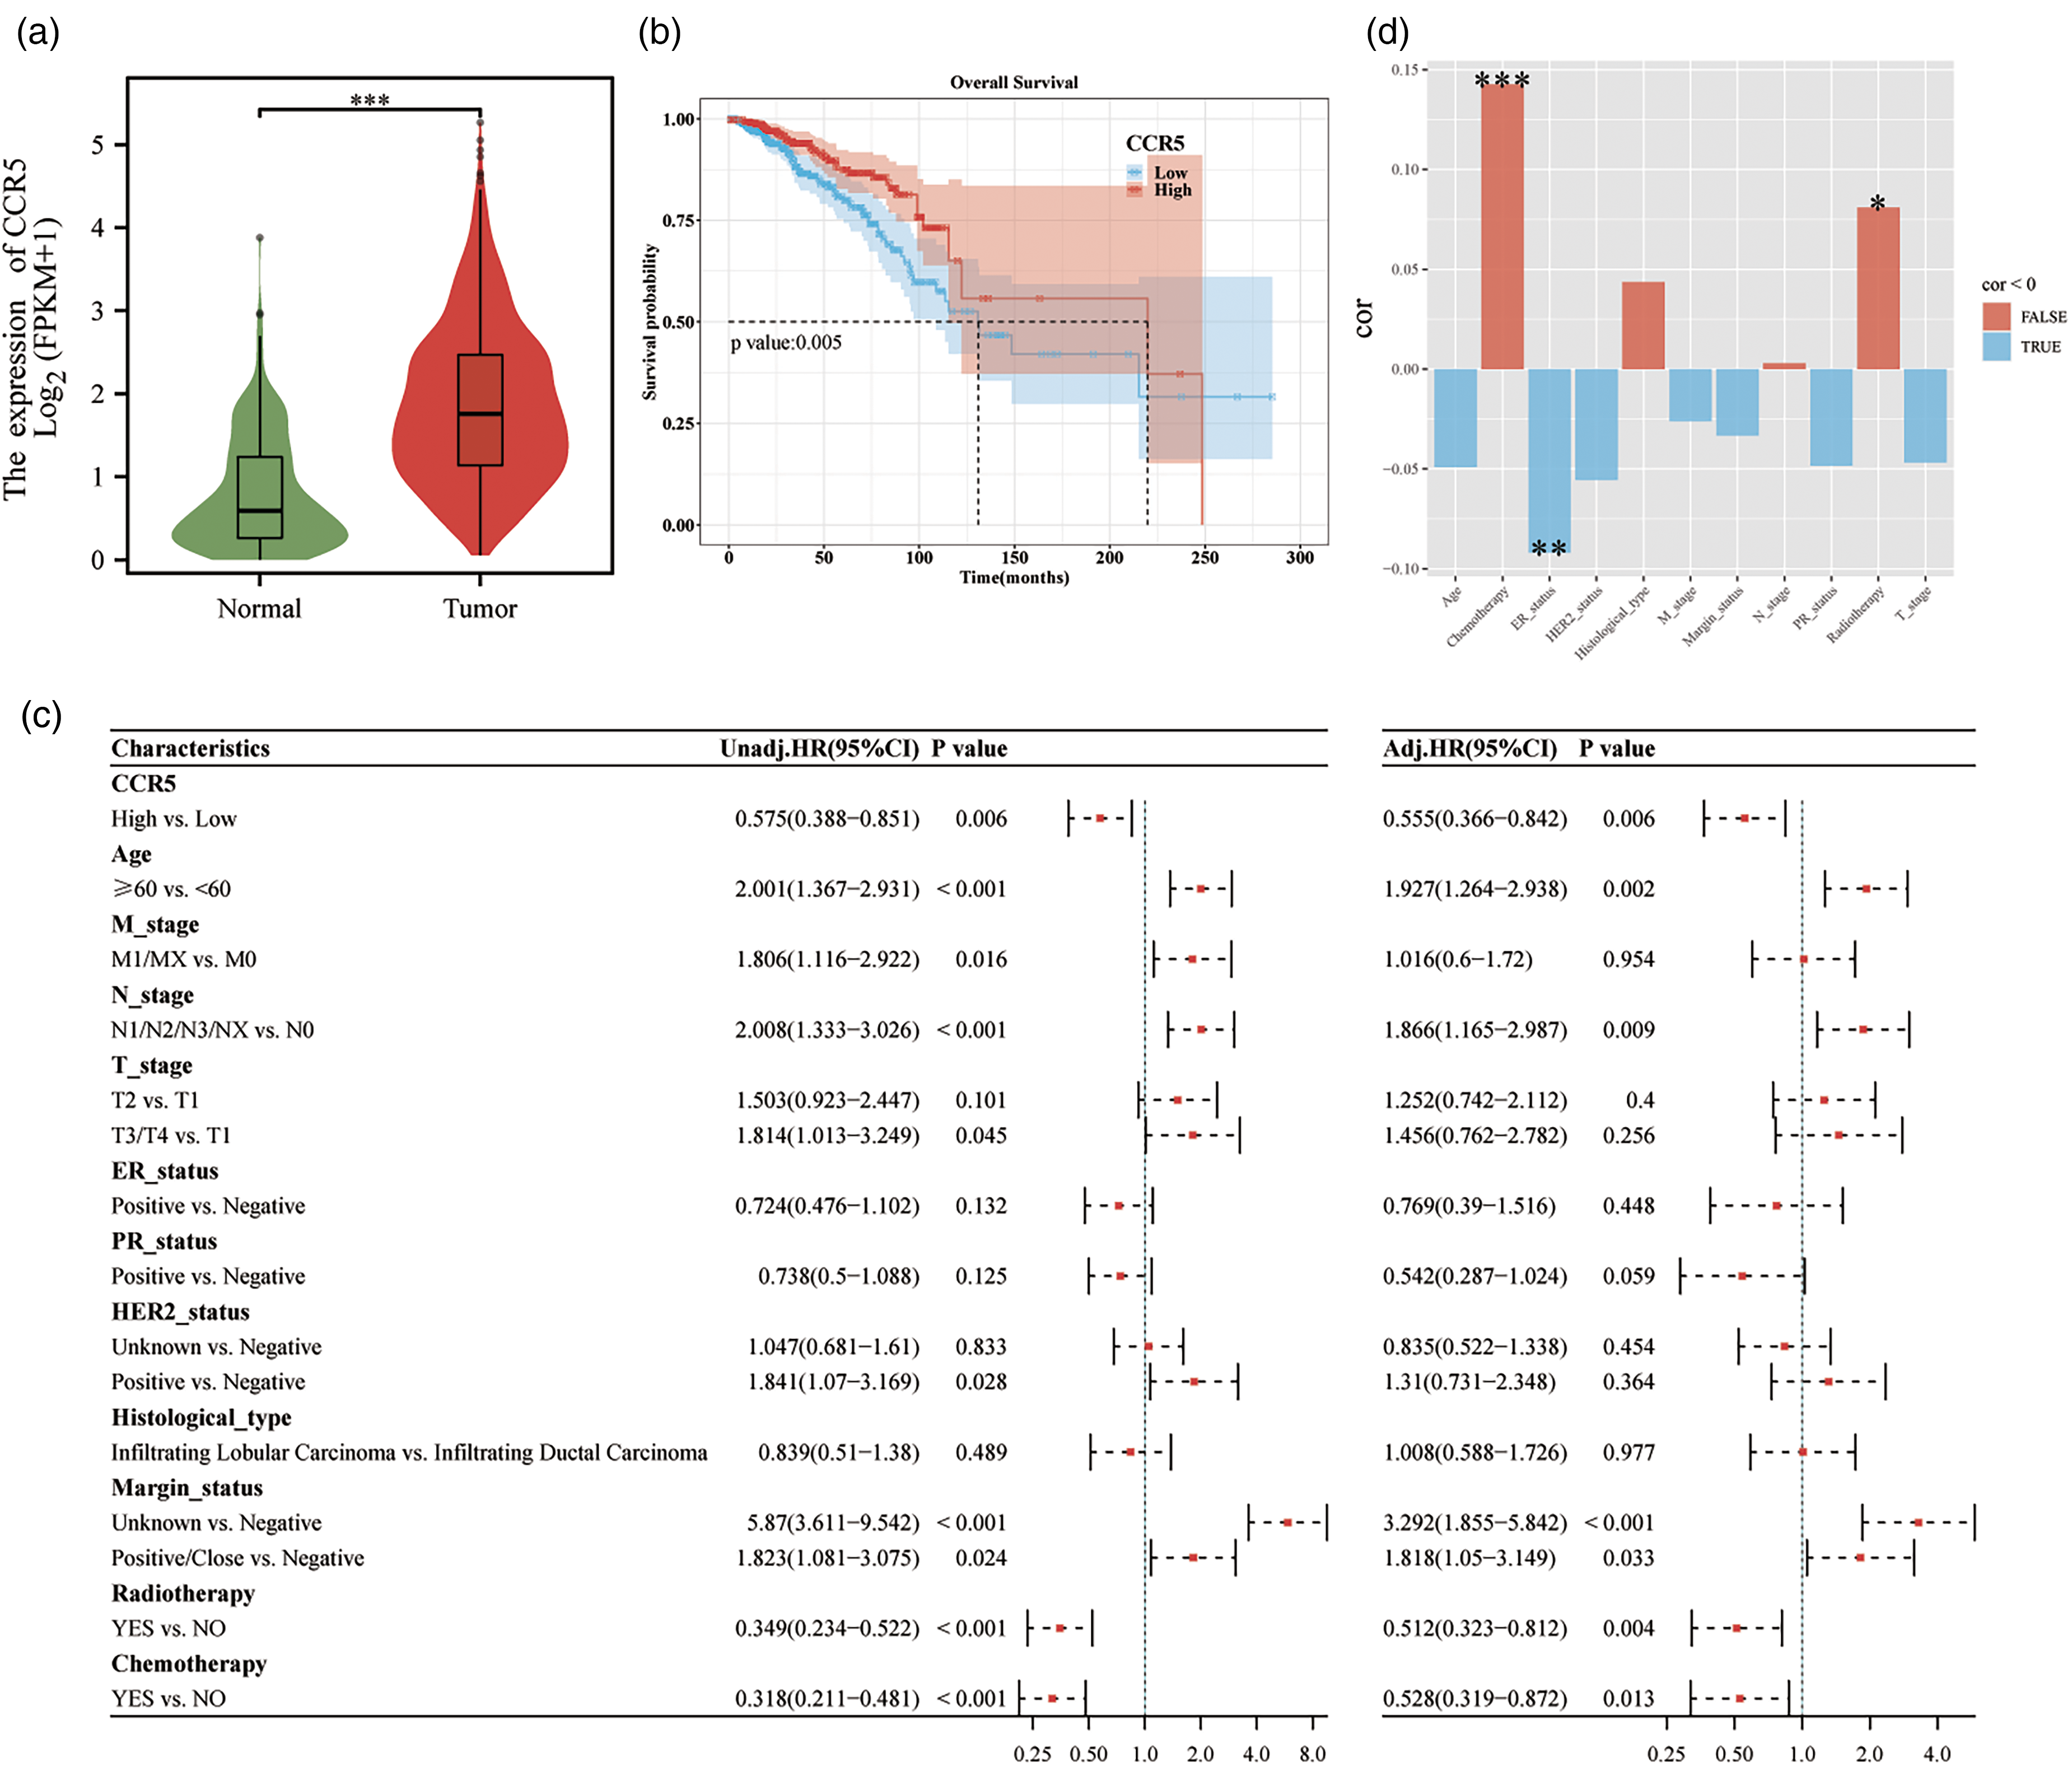
Association between gene expression level and clinical characteristics. (a) CCR5 expression in normal and tumor tissues. (b) Correlations between CCR5 expression and OS in BC. (c) Univariate and Multivariate Cox regression analyses. (d) Correlation analysis between CCR5 and clinical characteristics of BC. *p < 0.05, **p < 0.01, ***p < 0.001, NS, no significance.
Univariate analysis showed that high CCR5 expression (HR = 0.575, 95% CI: 0.388–0.851, p = 0.006) was associated with better OS outcomes. Radiotherapy and chemotherapy were also identified as protective factors. Following multivariate adjustment, elevated CCR5 expression (HR = 0.555, 95% CI: 0.366–0.842, p = 0.006), radiotherapy, and chemotherapy remained significantly associated with OS (p < 0.05) (Figure 2(c)). Subgroup analysis and interaction testing did not reveal any significant interaction effects between high CCR5 levels and the other factors considered (Figure S3). Furthermore, the bar chart demonstrated a significant correlation between CCR5 expression and both chemotherapy and radiotherapy (Figure 2(d)).
Relationship between CCR5 expression level, clinical characteristic and tumor-immune microenvironment
The Spearman correlation analysis results showed that the expression of CCR5 was positively correlated with the infiltration of immune cells such as M1 macrophages, CD8+ T cells, CD4+ T cells, and Tregs (p < 0.001) (Figure 3(a)). In the CCR5 high-expression group, immune gene expression levels of TNFSF14, TNFSF18, TNFRSF14, TNFRSF4, TNFRSF9, and others were significantly elevated (p < 0.001) (Figure S4). TMB analysis indicated that the CCR5 high-expression group had a higher median TMB compared to the low-expression group (p < 0.05) (Figure 3(b)).
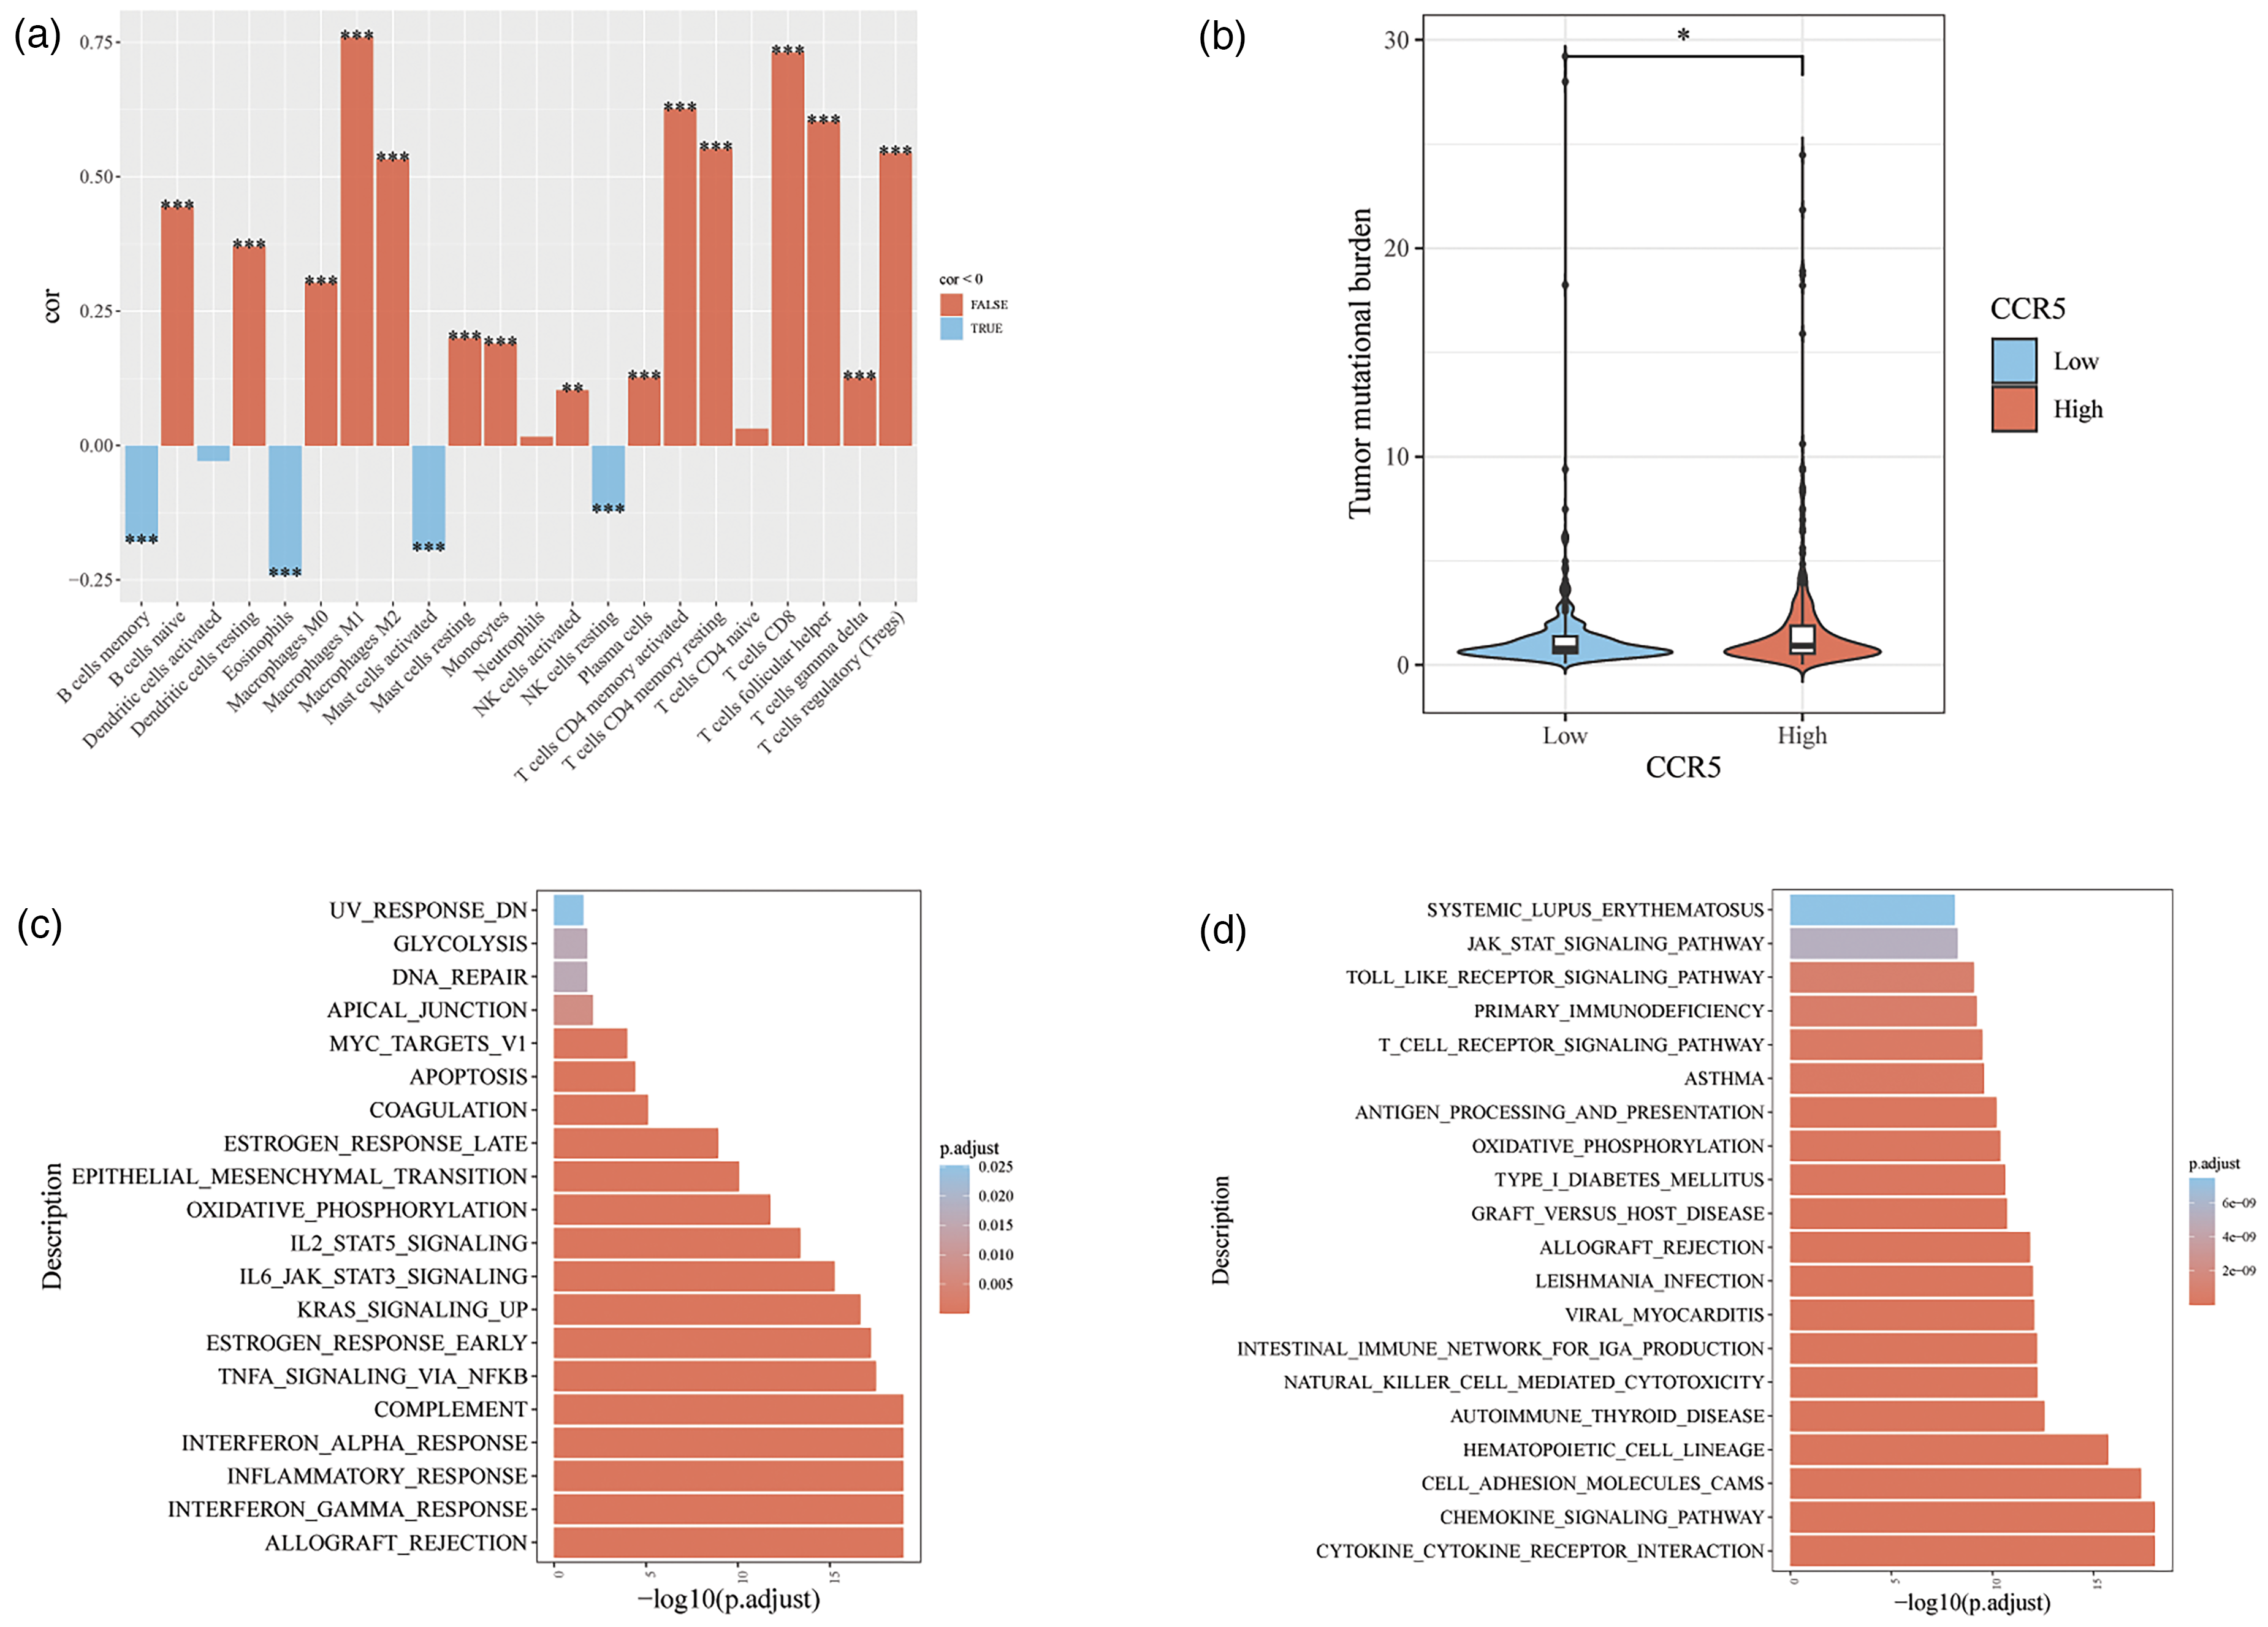
Analysis of the immune-cell infiltration and CCR5 expression in BC. (a) Correlation analysis between CCR5 and immune cell infiltration. (b) Analysis of CCR5 and tumor mutation load (TMB). (c) Hallmark enrichment analysis. (d) KEGG enrichment analysis. *p < 0.05, **p < 0.01, ***p < 0.001, NS, no significance.
Analysis of differentially-expressed genes (DEGs) in BC in relation to CCR5
The Hallmark gene set enrichment analysis revealed that DEGs in the CCR5 high-expression group were significantly enriched in the ESTROGEN_RESPONSE_EARLY, IL2_STAT5_SIGNALING, IL6_JAK_STAT3_SIGNALING, and TNFA_SIGNALING_VIA_NFKB pathways (Figure 3(c)). KEGG gene set enrichment analysis further indicated that DEGs in this group were predominantly enriched in the T_CELL_RECEPTOR_SIGNALING_PATHWAY and the CHEMOKINE_SIGNALING_PATHWAY, among others (Figure 3(d)).
Development and evaluation of radiomics models and correlation analysis of SVM_Rad_score, CCR5 and immune genes
The dataset was divided into two subsets: 69 cases were assigned to the training set, and 29 cases to the validation set. The lack of statistical significance (p > 0.05) between the two groups indicates that the baseline characteristics of the patients were comparable and that the division did not introduce notable bias (Table S3).
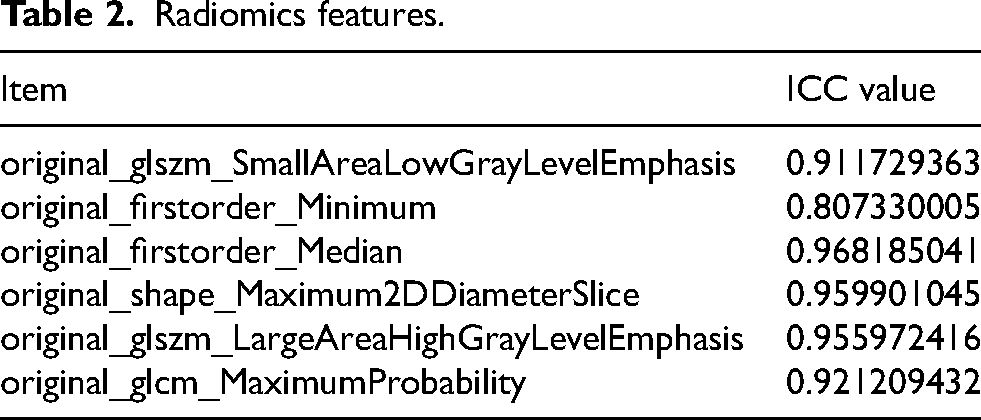
Of the 107 radiomics features included in the models, 103 demonstrated Intraclass Correlation Coefficients (ICCs) greater than 0.75. The selected features in the final model all had ICCs exceeding 0.80, indicating high consistency (Table 2). After filtering with the mRMR_RFE algorithm, six features were selected for the development of the SVM and LR models, namely, glszm_Small Area Low Gray Level Emphasis, first order_Minimum, first order_Median, shape_Maximum2DDiameterSlice, glszm_Large Area High Gray Level Emphasis, and glcm_Maximum, as illustrates in Figure 4(a) and Table S4.
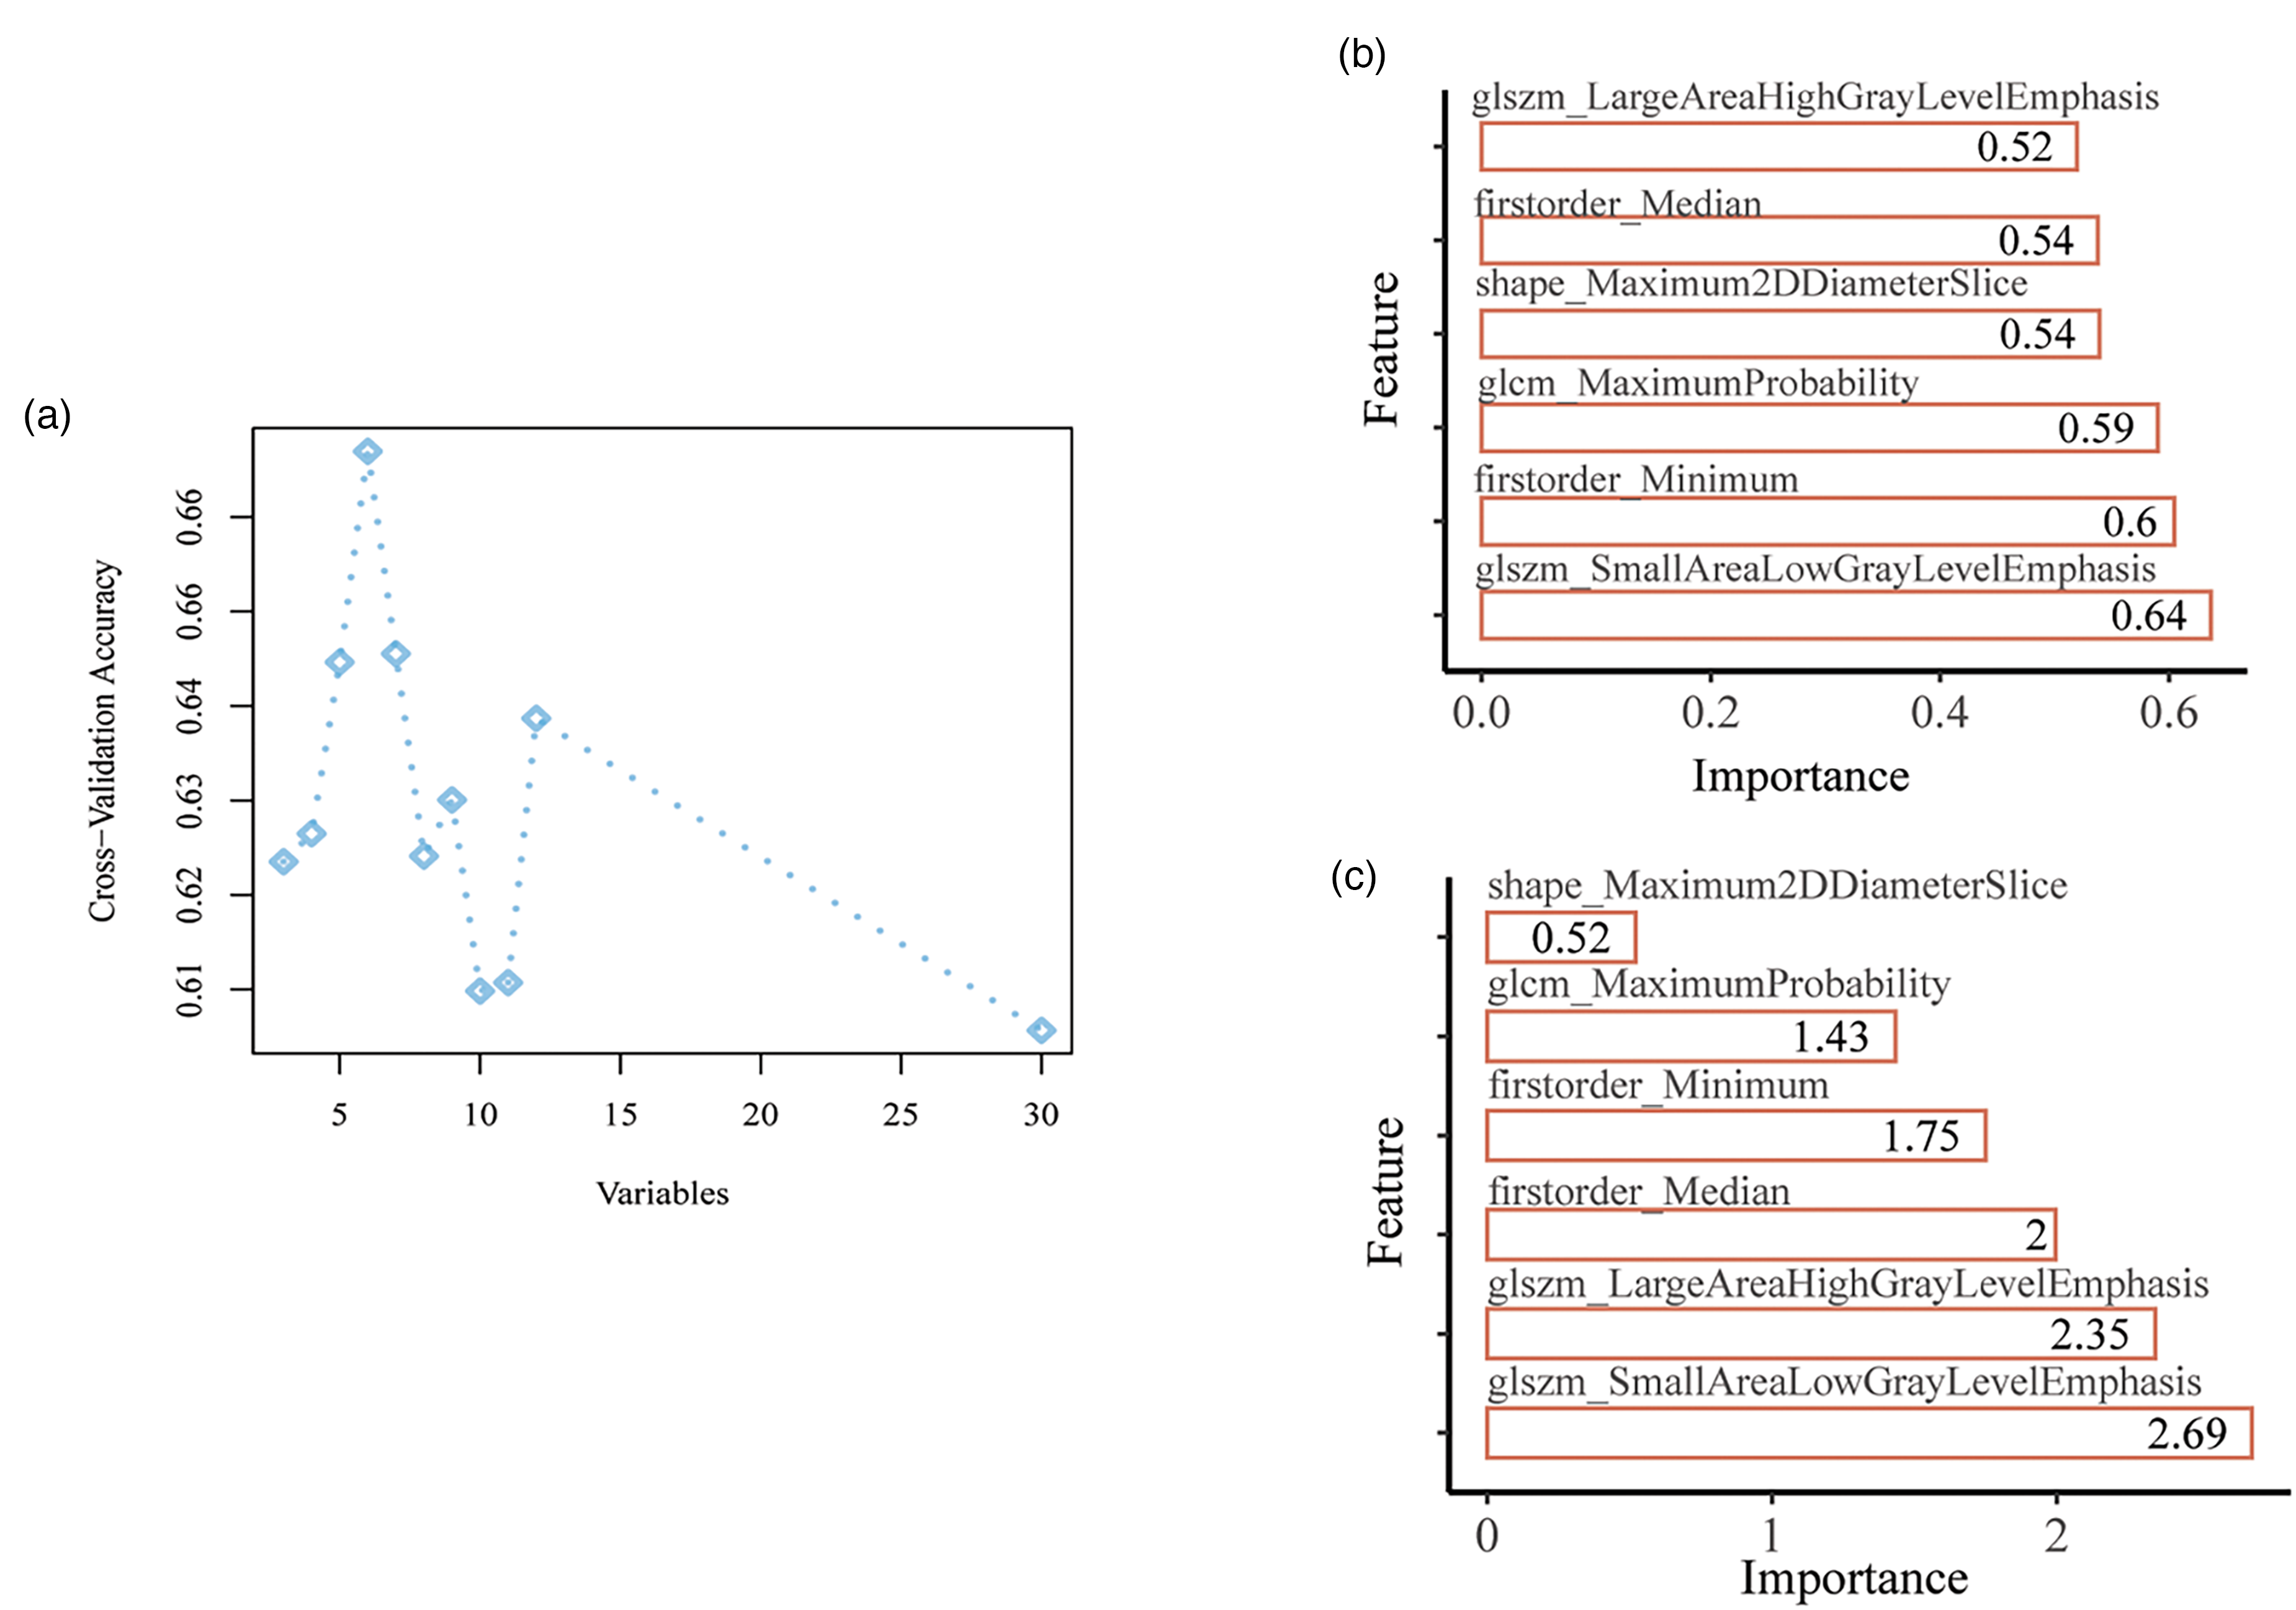
Feature filtration of the radiomics model. (a) Feature screening by mRMR and RFE (b) Importance of the selected features in SVM model. (c) Importance of the selected features in LR model.
Radiomics features.
Radiomics models were developed using SVM and LR. The importance of the selected features is depicted in Figure 4(b) and (c). The SVM model demonstrated strong predictive performance in both the training and validation cohorts, the ACC, SEN, SPE, PPV, NPV, and Brier score in the training set were 0.725, 0.722, 0.727, 0.743, 0.706, and 0.215, respectively. In the validation set, these values were 0.655, 0.533, 0.786, 0.727, 0.611, and 0.219, respectively (Table S5). In the training and validation datasets, the AUC values for the ROC curve were 0.753 (95% CI 0.637–0.868) and 0.748 (95% CI 0.564–0.931), respectively (Figure 5(a)). The calibration curve and HL goodness-of-fit test confirmed that the radiomics prediction model accurately predicted CCR5 expression levels in both the training and validation sets (p = 0.438 and 0.456, respectively) (Figure 5(b)). The DCA demonstrated the model's high clinical practicality (Figure 5(c)).
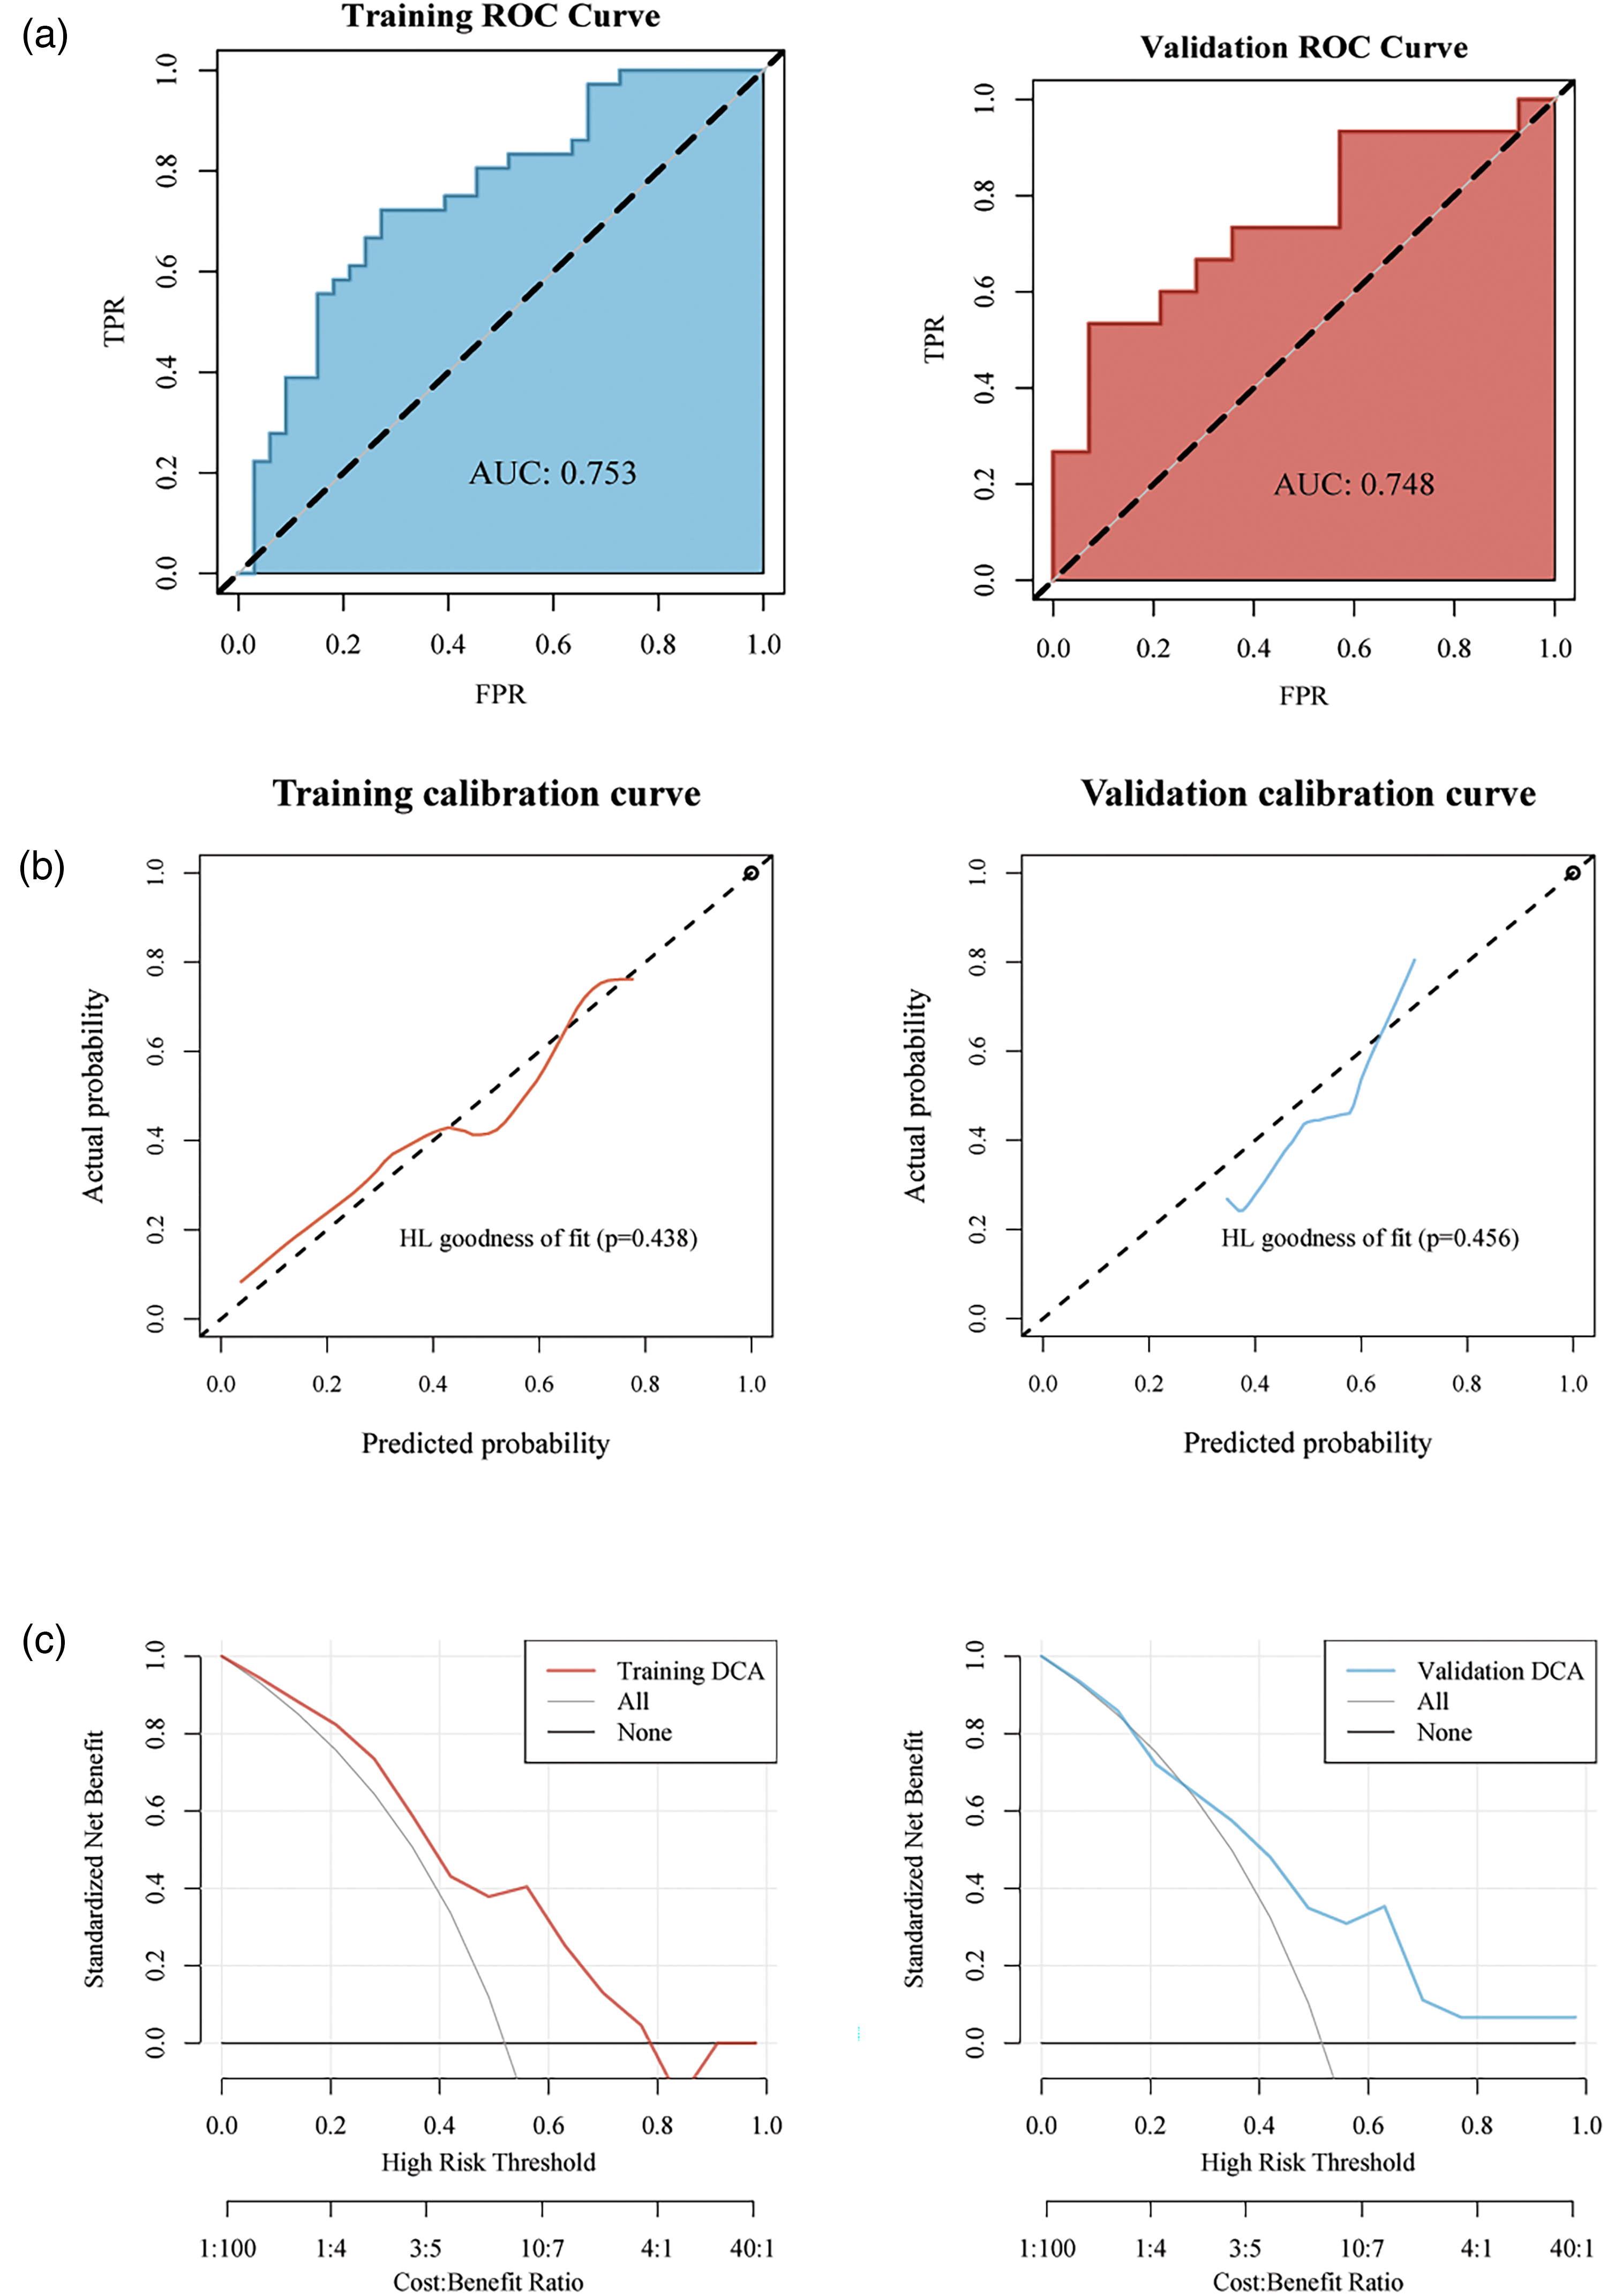
Development and evaluation of the radiomics models (SVM) (a) ROC curve analysis of the radiomics model. (b) Calibration-curve analysis of the radiomics model. (c) Decision curve analysis (DCA) for the model.
The LR model incorporates a radiomics signature with a Rad_score calculated using the following formulas:
Rad_Score = 2.179 × (original_firstorder_Median) − 0.897 × (original_firstorder_Minimum) − 1.887 × (original_glszm_SmallAreaLowGrayLevelEmphasis) + 0.210 × (original_shape_Maximum2DDiameterSlice) − 2.427 × (original_glszm_LargeAreaHighGrayLevelEmphasis) + 0.920 × (original_glcm_MaximumProbability) − 0.099
In the LR model, the ACC, SEN, SPE, PPV, NPV, and Brier score in the training set were 0.71, 0.583, 0.848, 0.808, 0.651, and 0.197, respectively. In the validation set, these values were 0.621, 0.4, 0.857, 0.75, 0.571, and 0.206, respectively (Table S6). The AUC values for the ROC curve in the training and validation datasets were 0.763 (95% CI 0.649–0.876) and 0.762 (95% CI 0.57–0.954), respectively, indicating strong predictive performance (Figure 6(a)). The calibration curve and HL goodness-of-fit test demonstrated that the LR model's predictions closely aligned with actual gene expression values (p > 0.05) (Figure 6(b)). DCA further confirmed the model's high clinical practicality (Figure 6(c)).
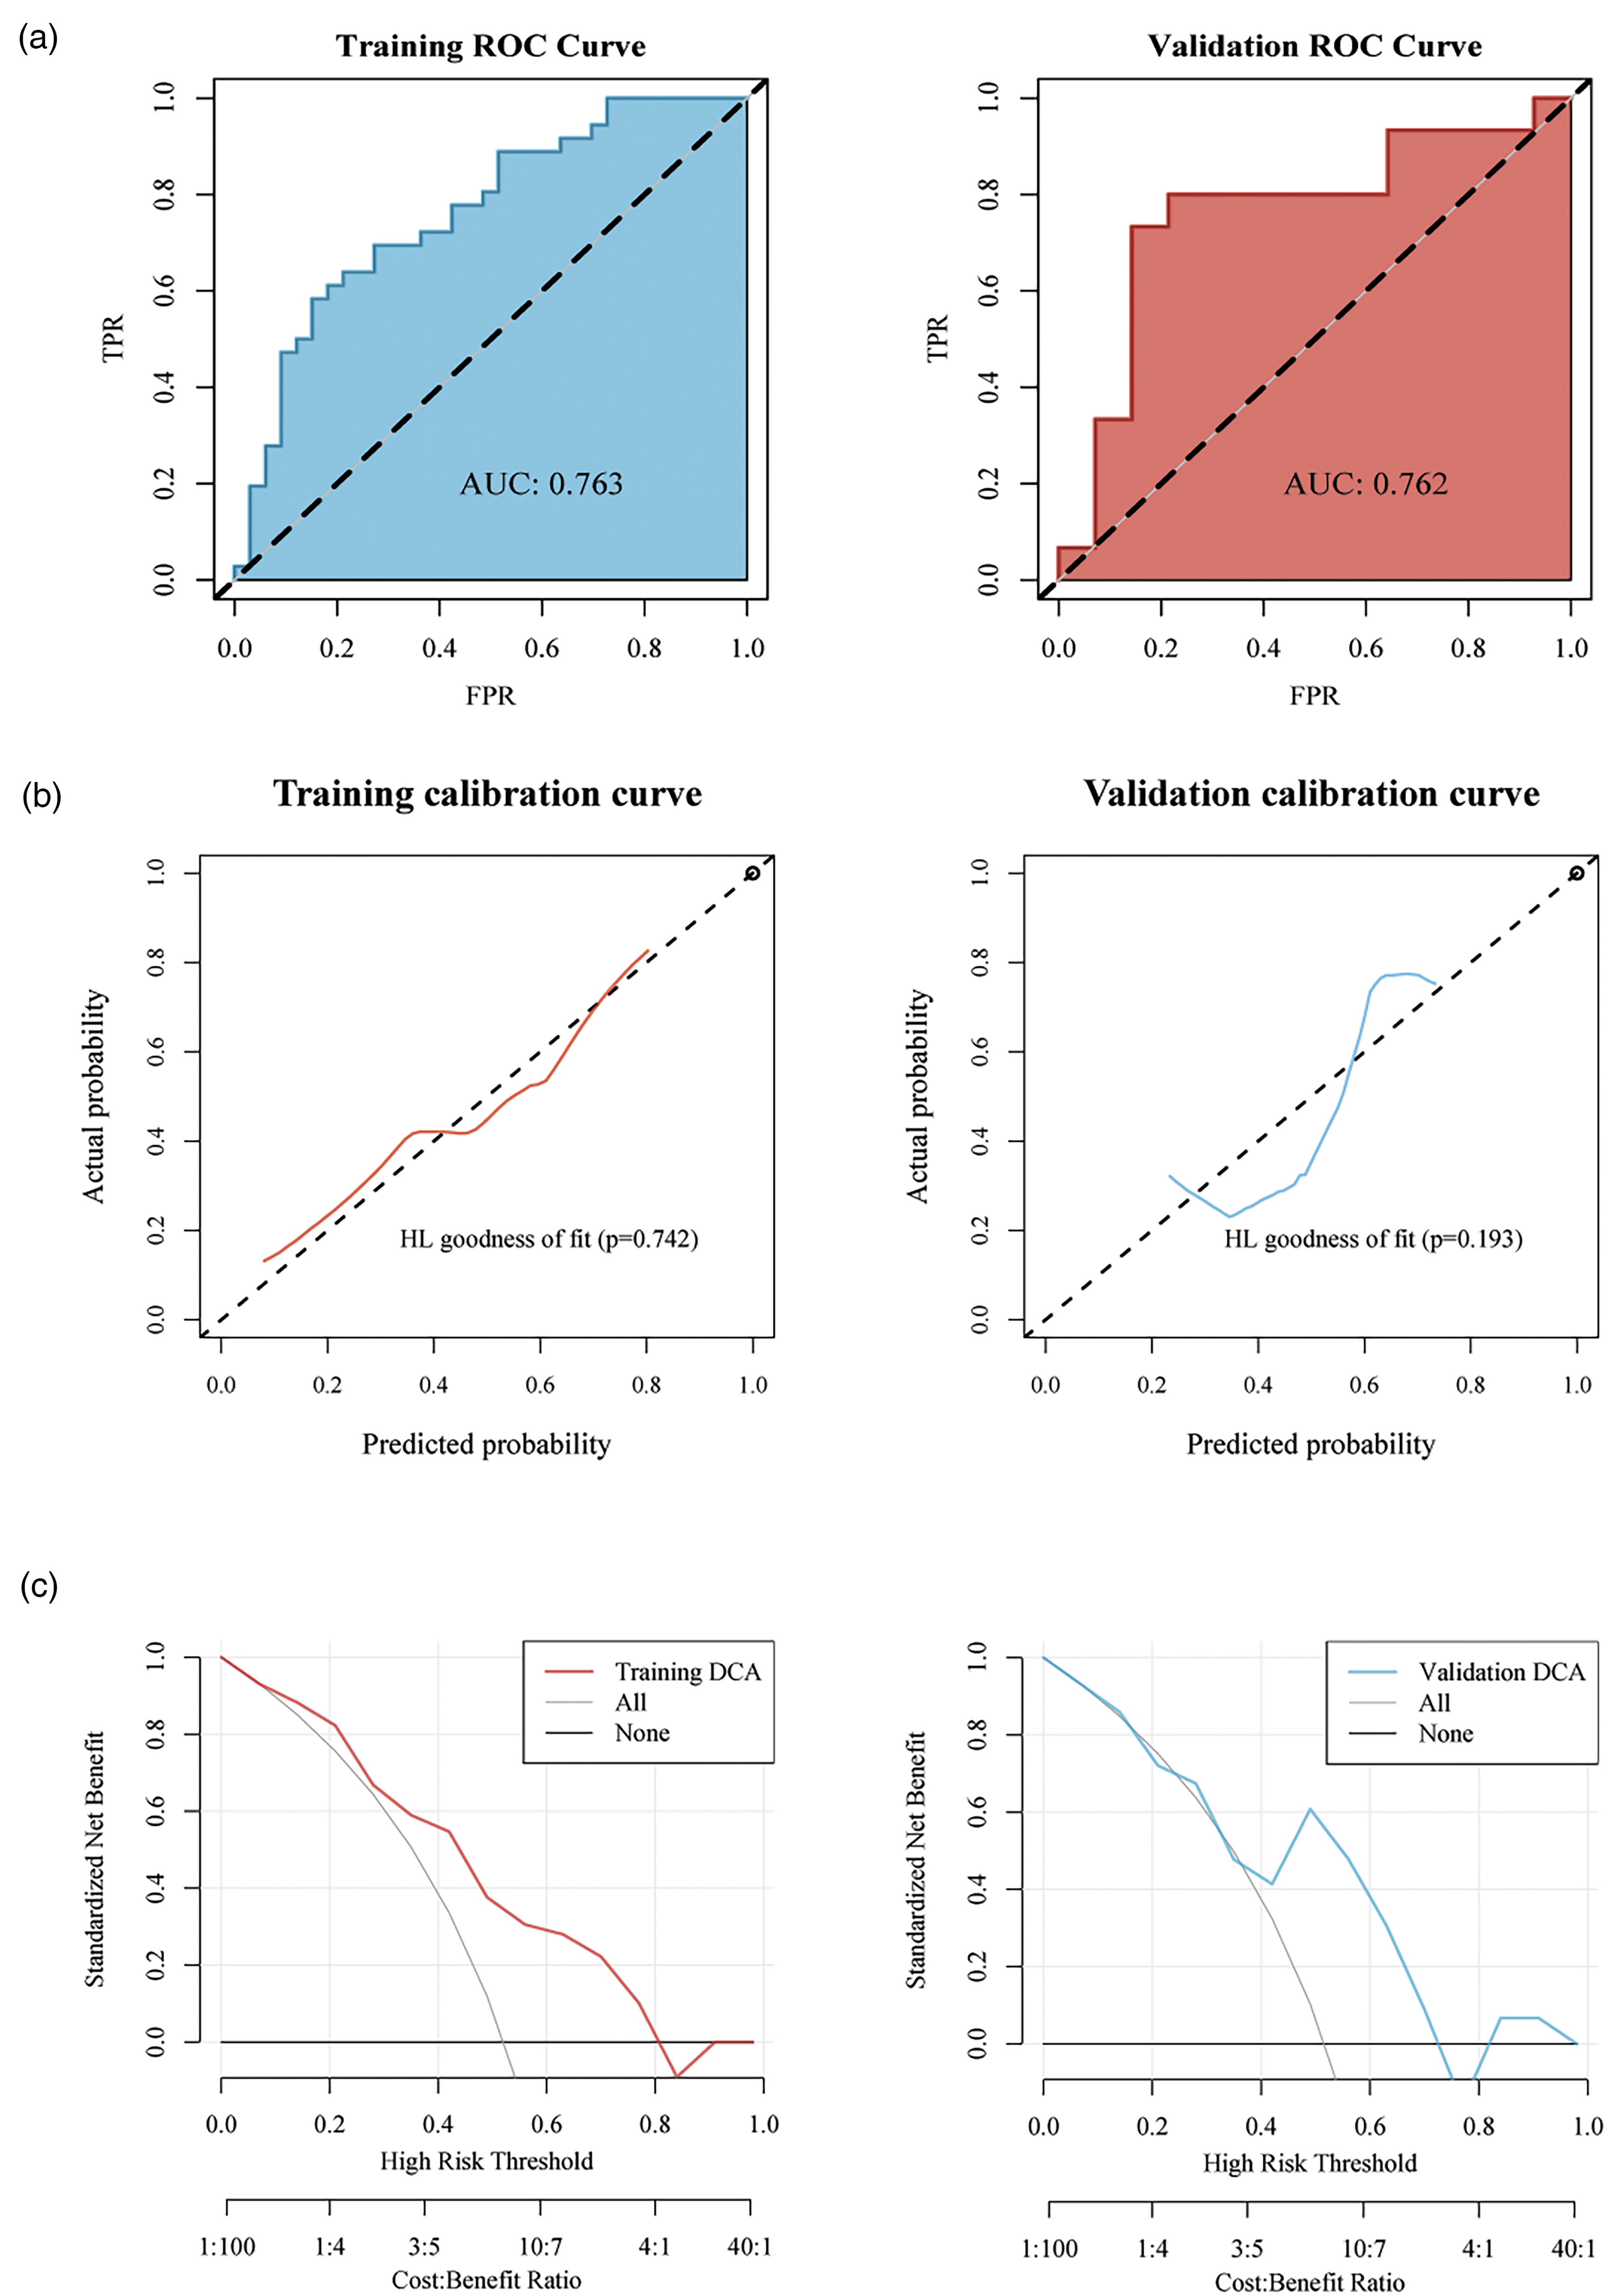
Development and evaluation of the radiomics models (LR). (a) ROC curve analysis of the radiomics model. (b) Calibration-curve analysis of the radiomics model. (c) Decision curve analysis (DCA) for the model.
In both the training and validation sets of the two models, the Rad_score of the CCR5 high-expression group were significantly higher than those of the low-expression group (p < 0.05) (Figure 7(a) and (b)). Furthermore, analysis of AUC values revealed no significant difference between the SVM and LR models in either dataset (p = 0.964 and 0.994, respectively), suggesting comparable generalization performance. Both models showed effective predictive performance, and SVM model was more balanced in sensitivity and specificity, which could be used for further correlation analysis. The SVM_Rad_score and CCR5 expression exhibited similar positive correlations with immune-related gene expression, both showing statistical significance (p < 0.05) (Figure 7(c)).
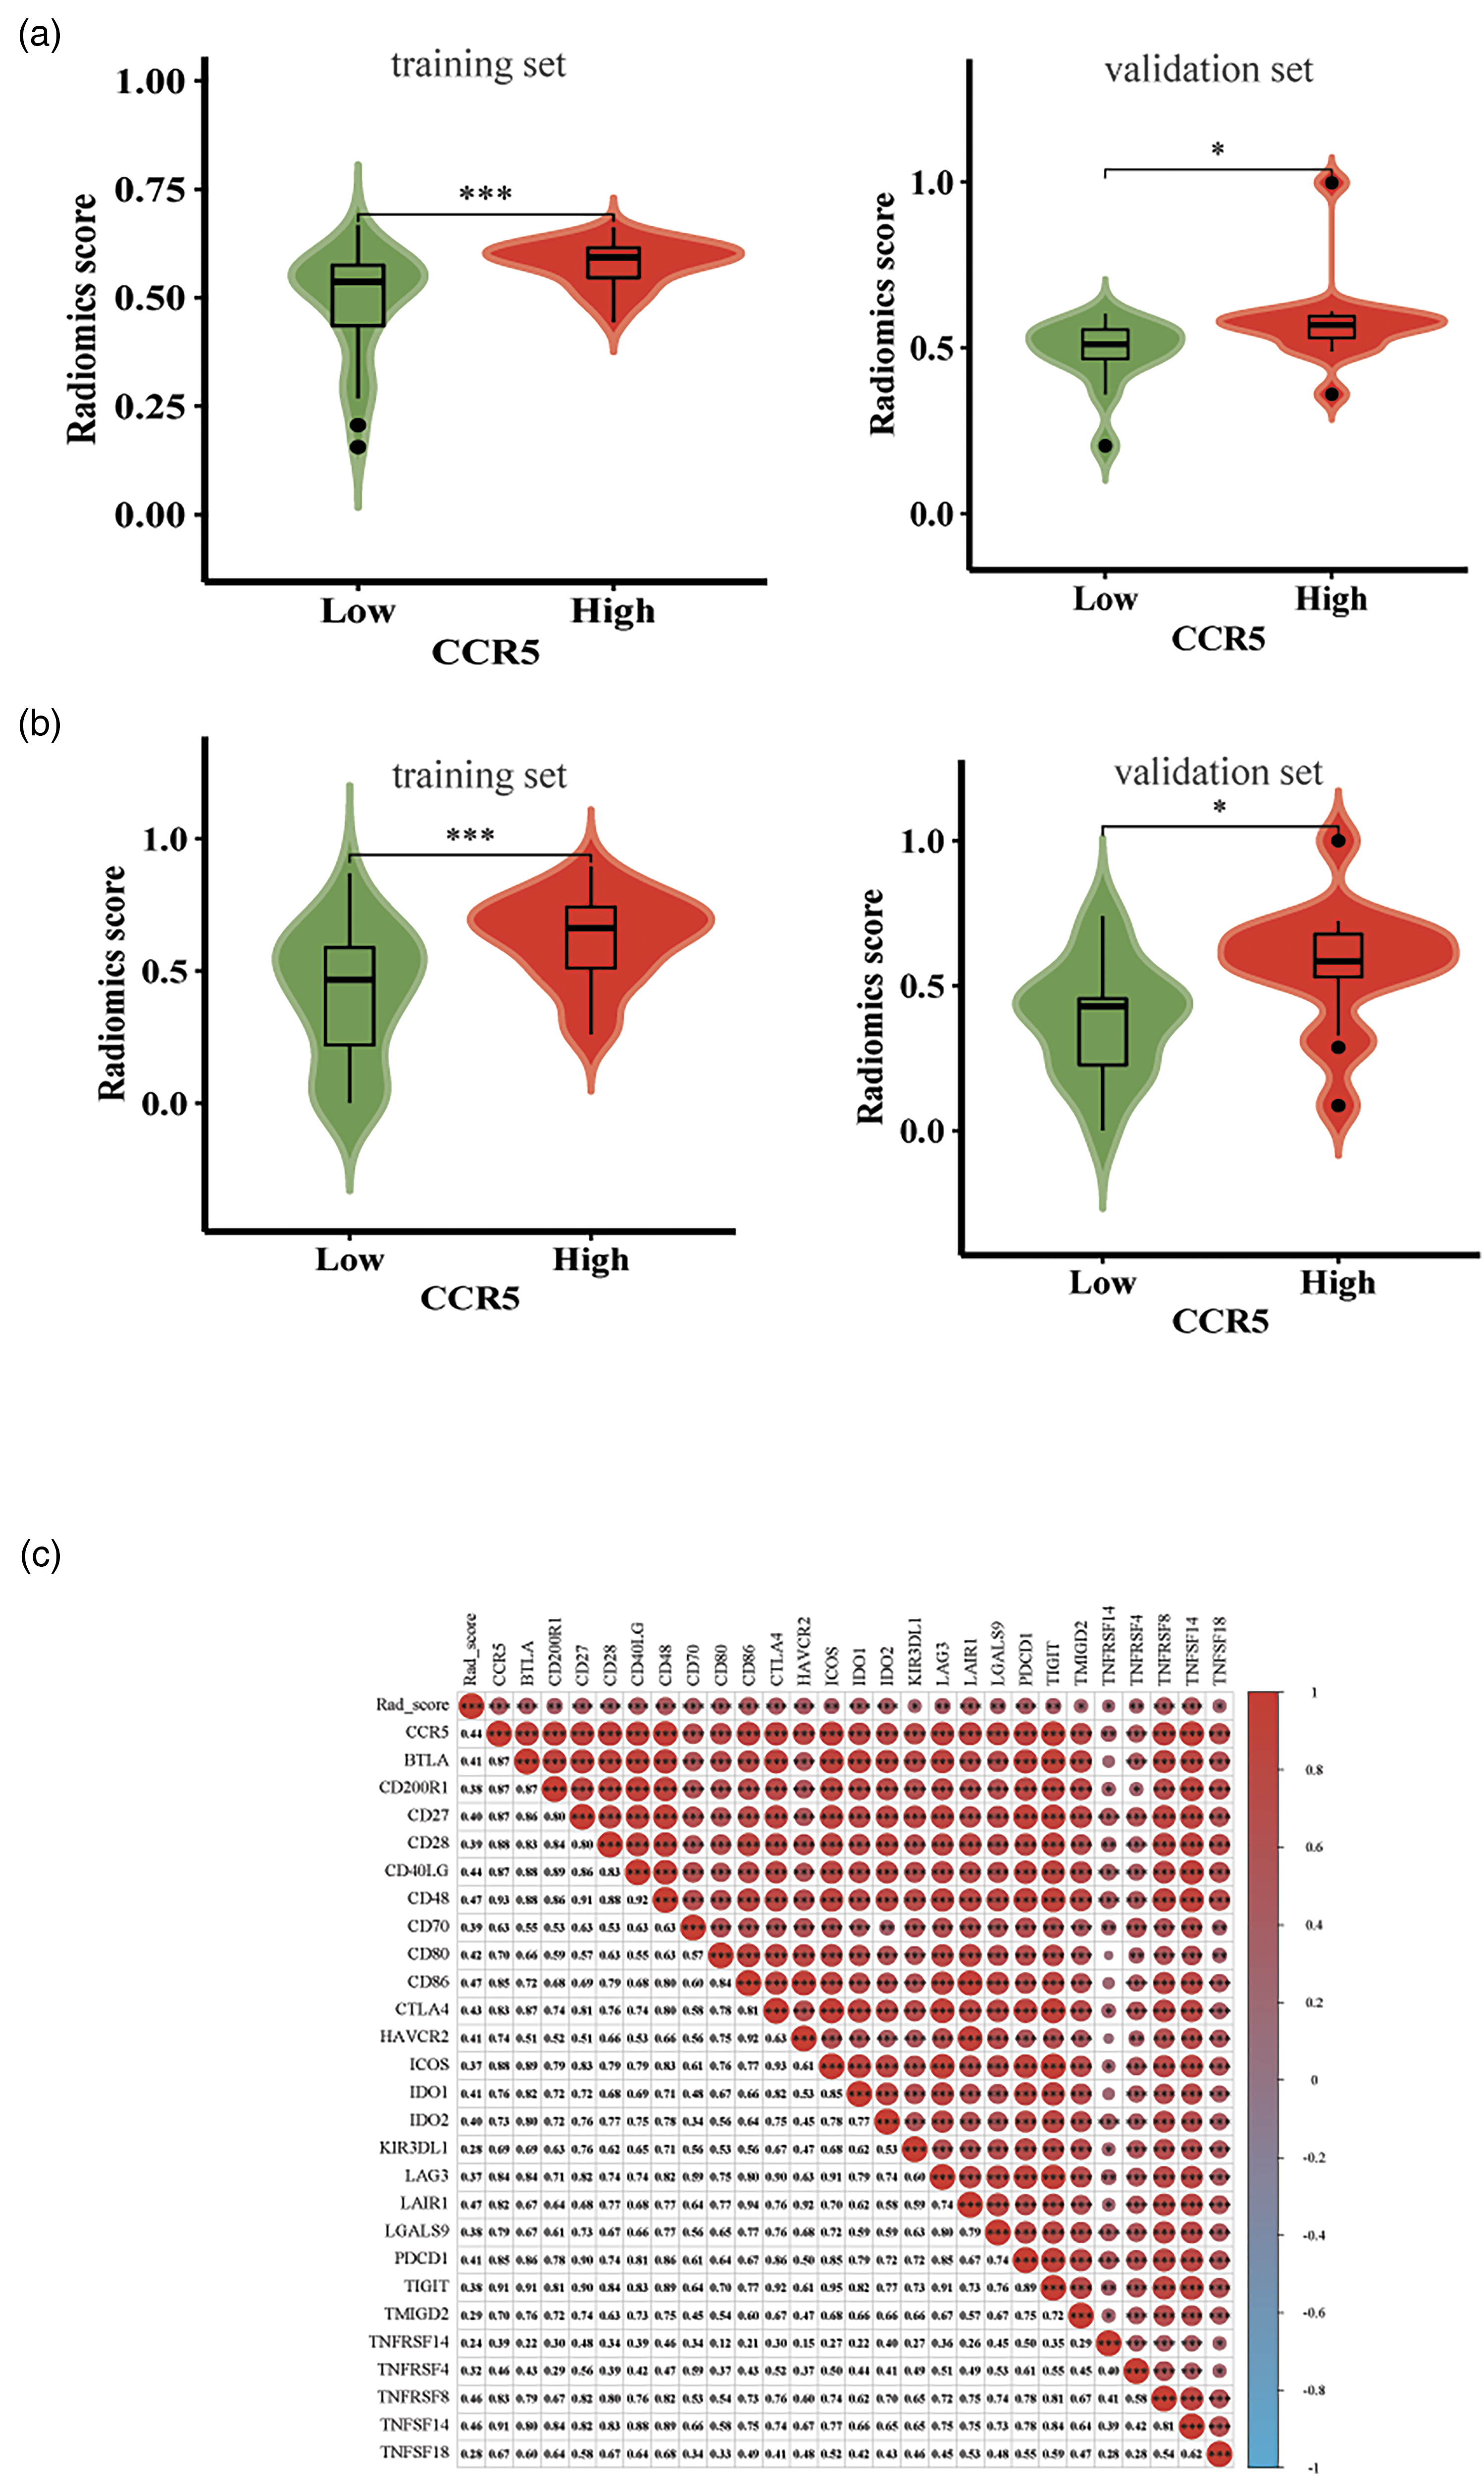
Correlation between RS and clinical characteristics. (a) Correlation between SVM_Rad_Score and CCR5 expression. (b) Correlation between LR_Rad_Score and CCR5 expression. (c) Correlation analysis of SVM_Rad-score, CCR5 and immune genes.
We constructed radiomics models to predict CCR5 using two machine learning algorithms. Both models demonstrated strong predictive performance, as evidenced by their discriminative ability, calibration, and DCA curves.
Discussion
This study reveals a correlation between CCR5 expression and prognosis, along with the relationship between DCE-MRI radiomics and CCR5 expression in BC patients. The radiomics model developed herein shows promise as a non-invasive predictive tool for assessing CCR5 as a prognostic marker in this patient population.
Accumulating evidence suggests that CCR5 is a valuable biomarker for BC. 24 Despite thorough research in the past few years, the precise role of CCR5 remains unclear. Although controversial, some studies suggest that CCR5 may promote the progression of breast and gastric cancers, while others highlight its role in enhancing tumor immunity through CD4+ and CD8+ T cell expression.46–48 Studies indicate that elevated levels of CCR5 in patients with triple-negative BC and TP53 mutations are linked to improved survival rates, suggesting that CCR5 functions both as a prognostic marker and an immune system regulator for this type of cancer. 49 Our study found that decreased CCR5 expression correlated with reduced survival rates, as indicated by the KM survival curve. High CCR5 expression, in conjunction with chemotherapy and radiotherapy, was identified as protective factors for OS. The survival analysis results of varying CCR5 expression levels in this study were in line with previous findings. 49
Currently, immunotherapy50–52 is considered one of the most promising treatment modalities for BC and other tumors. CCR5, which is not expressed on normal epithelial cells, presents a potentially valuable target for immunotherapy. Originally targeted in AIDS treatment, CCR5 was the target of several commercial drugs, including Maraviroc, 46 Leronlimab, and Vicriviroc, that may have clinical applications. Several clinical randomized controlled trials (RCTs) have investigated targeted CCR5 therapy for tumors (e.g. NCT03274804, NCT03838367, NCT04504942, NCT03631407, NCT01736813, NCT03767582, NCT04721301, NCT04123379), primarily in phases I and II, with promising results. 24 However, current methods for detecting CCR5 are often invasive, costly, and rely on localized tumor tissue samples. This approach not only fails to represent the overall tumor status but also hinders dynamic monitoring. Radiomics has emerged as a valuable tool for prognosis prediction in various diseases, including BC. Among these, DCE-MRI stands out due to its high resolution for soft tissue imaging and its remarkable diagnostic sensitivity of 94% for BC. 53 Previous researches have identified several key factors affecting BC recurrence risk and prognosis, including tumor stage, lymph node metastasis, tissue differentiation, and clinicopathological features.54–56 These factors provide critical insights into distinguishing between benign and malignant breast abnormalities, predicting molecular subtypes of BC, 57 and understanding the heterogeneity of cancer cells and the TME.54,58 This aforementioned research emphasizes the potential of radiomics in forecasting clinical outcomes for BC.
The radiomics process involves several key steps: image data acquisition, tumor segmentation, feature extraction, screening, and model building. In this study, six features were selected for model development after applying feature filtering using the mRMR_RFE algorithm. Yu, Y. et al. 54 investigated the role of radiomics features in predicting distant disease-free survival in patients with invasive BC. Their study, utilized two machine learning algorithms, both of which demonstrated high stability and predictive performance. The LR and SVM algorithms59–61 are commonly employed in medical radiomics to differentiate tumor types and predict lymph node metastasis. The radiomics models based on SVM and LR proposed in this study aim to provide a dynamic, non-invasive assessment of CCR5 expression, capturing tumor heterogeneity and microenvironmental characteristics while overcoming the limitations of traditional methods. As a standard imaging technique in BC diagnosis, DCE-MRI, combined with radiomics analysis, not only provides objective and batch predictions but also enables dynamic monitoring without imposing additional burdens on patients. The Rad_score can serve as a screening tool for CCR5-targeted therapy, helping to identify patients who may benefit from CCR5-targeted or immunotherapy. In the future, CCR5 prediction models integrated with radiomics will not only enhance decision-making efficiency in clinical practice but also offer new perspectives for precise treatment of BC.
The present study also identified that varying genes expression levels in the CCR5 high-expression group were predominantly enriched in the T cell receptor and CHEMOKINE signaling pathway. The T cell receptor signaling pathway 62 plays a crucial role in anti-tumor responses within the TME, Our radiomics model successfully predicted CCR5 expression, and further analysis revealed a correlation between CCR5 and immune infiltration, as well as immune-related gene expression. Elevated CCR5 expression was positively associated with the polarization of CD4 + T cells, CD8 + T cells, Treg cells, and M1 macrophage. Tumor development is linked to macrophage polarization, with M1 macrophages playing an anti-tumor role. 63 The presence of CCR5 in both CD4 + T and CD8 + T cells suggest its potential role in regulating macrophages and contributing to anti-tumor effects through T cell signaling pathways. Additionally, members of TNFSF/TNFRSF 64 family regulate cellular differentiation, survival, and apoptosis. Notably, TNFRSF14 65 has been shown to promote apoptosis and inhibit cancer cell proliferation, suggesting a possible link between elevated CCR5 expression, immune activation in tumors, and improved survival rates. However, further experiments are required to validate this relationship.
Radiomics shown significant potential for predicting tumor outcomes and evaluating treatment efficacy; however, several limitations need to be addressed. Firstly, all imaging data in this study were sourced from the public dataset TCIA dataset. Despite preprocessing with standardized protocols, variations in imaging parameters among different sources may introduce inconsistencies in image quality, which could impact predictive accuracy. Furthermore, this study based on TCGA and TCIA data, mainly involves European and American patients, which may not fully represent BC patients from other regions or ethnicities. Additionally, the radiomics model was developed and validated only with the internal dataset, and has not been tested in independent external datasets. This limits its generalizability and applicability across different institutions or equipment. External validation is essential to assess the model's stability and robustness under varying imaging conditions and patient populations. Future studies should include large-scale, multi-center datasets for external validation to ensure the model's broader applicability and clinical value.
Conclusion
In conclusion, the DCE-MRI radiomics model developed in our study has the potential to be used as a non-invasive tool for predicting CCR5 expression levels in BC patients, thereby assisting in clinical decision-making.
Supplemental Material
sj-docx-1-cbm-10.1177_18758592251332852 - Supplemental material for Non-invasive prediction of DCE-MRI radiomics model on CCR5 in breast cancer based on a machine learning algorithm
Supplemental material, sj-docx-1-cbm-10.1177_18758592251332852 for Non-invasive prediction of DCE-MRI radiomics model on CCR5 in breast cancer based on a machine learning algorithm by Qingfeng Li, Wenting Li, Jianliang Wang, Xiangyuan Li, Yi Ji and Mianhua Wu in Cancer Biomarkers
Supplemental Material
sj-docx-2-cbm-10.1177_18758592251332852 - Supplemental material for Non-invasive prediction of DCE-MRI radiomics model on CCR5 in breast cancer based on a machine learning algorithm
Supplemental material, sj-docx-2-cbm-10.1177_18758592251332852 for Non-invasive prediction of DCE-MRI radiomics model on CCR5 in breast cancer based on a machine learning algorithm by Qingfeng Li, Wenting Li, Jianliang Wang, Xiangyuan Li, Yi Ji and Mianhua Wu in Cancer Biomarkers
Footnotes
Author contributions/CRediT
Conception: QF Li and MH Wu; Interpretation or analysis of data: JL Wang; Preparation of the manuscript: QF Li and WT Li; Revision for important intellectual content: XY Li and Y Ji; Supervision: MH Wu, XY Li and Y Ji.
Funding
This work was supported by grants from Wu Mianhua Inheritance Studio of National Famous and Old Chinese Medicine Experts (State Administration of Traditional Chinese Medicine No. [2022]75), the National Natural Science Foundation of China (No. 81774266), Young Science and Technology Talent Support Project of Jiangsu Association for Science and Technology (No. JSTJ-2023-WJ028) and Postgraduate Research and Practice Innovation Program of Jiangsu Province (No. KYCX22_1929), The Jiangsu Province Traditional Chinese Medicine Science and Technology Development Plan – Young Talents Project (QN202302).
Conflicting interests
The authors declared no potential conflicts of interest with respect to the research, authorship, and/or publication of this article.
Data availability
The data from TCIA and TCGA can be downloaded from https://www.cancerimagingarchive.net/ and ![]() .
.
Supplemental material
Supplemental material for this article is available online.
References
Supplementary Material
Please find the following supplemental material available below.
For Open Access articles published under a Creative Commons License, all supplemental material carries the same license as the article it is associated with.
For non-Open Access articles published, all supplemental material carries a non-exclusive license, and permission requests for re-use of supplemental material or any part of supplemental material shall be sent directly to the copyright owner as specified in the copyright notice associated with the article.